Power BI is one of the most robust and powerful business intelligence tools out there. One of the most powerful features of Power BI is DAX (Data Analysis Expressions), which is a formula expression designed for advanced data analysis. DAX formulas contain functions, operators, statements, and more. This cheat sheet is designed to be your handy companion when working with DAX in Power BI.
Explore DAX in more detail by starting our course now.
Have this cheat sheet at your fingertips
Download PDFBecome a Power BI Data Analyst
Master the world's most popular business intelligence tool.
Maths & Statistical Functions
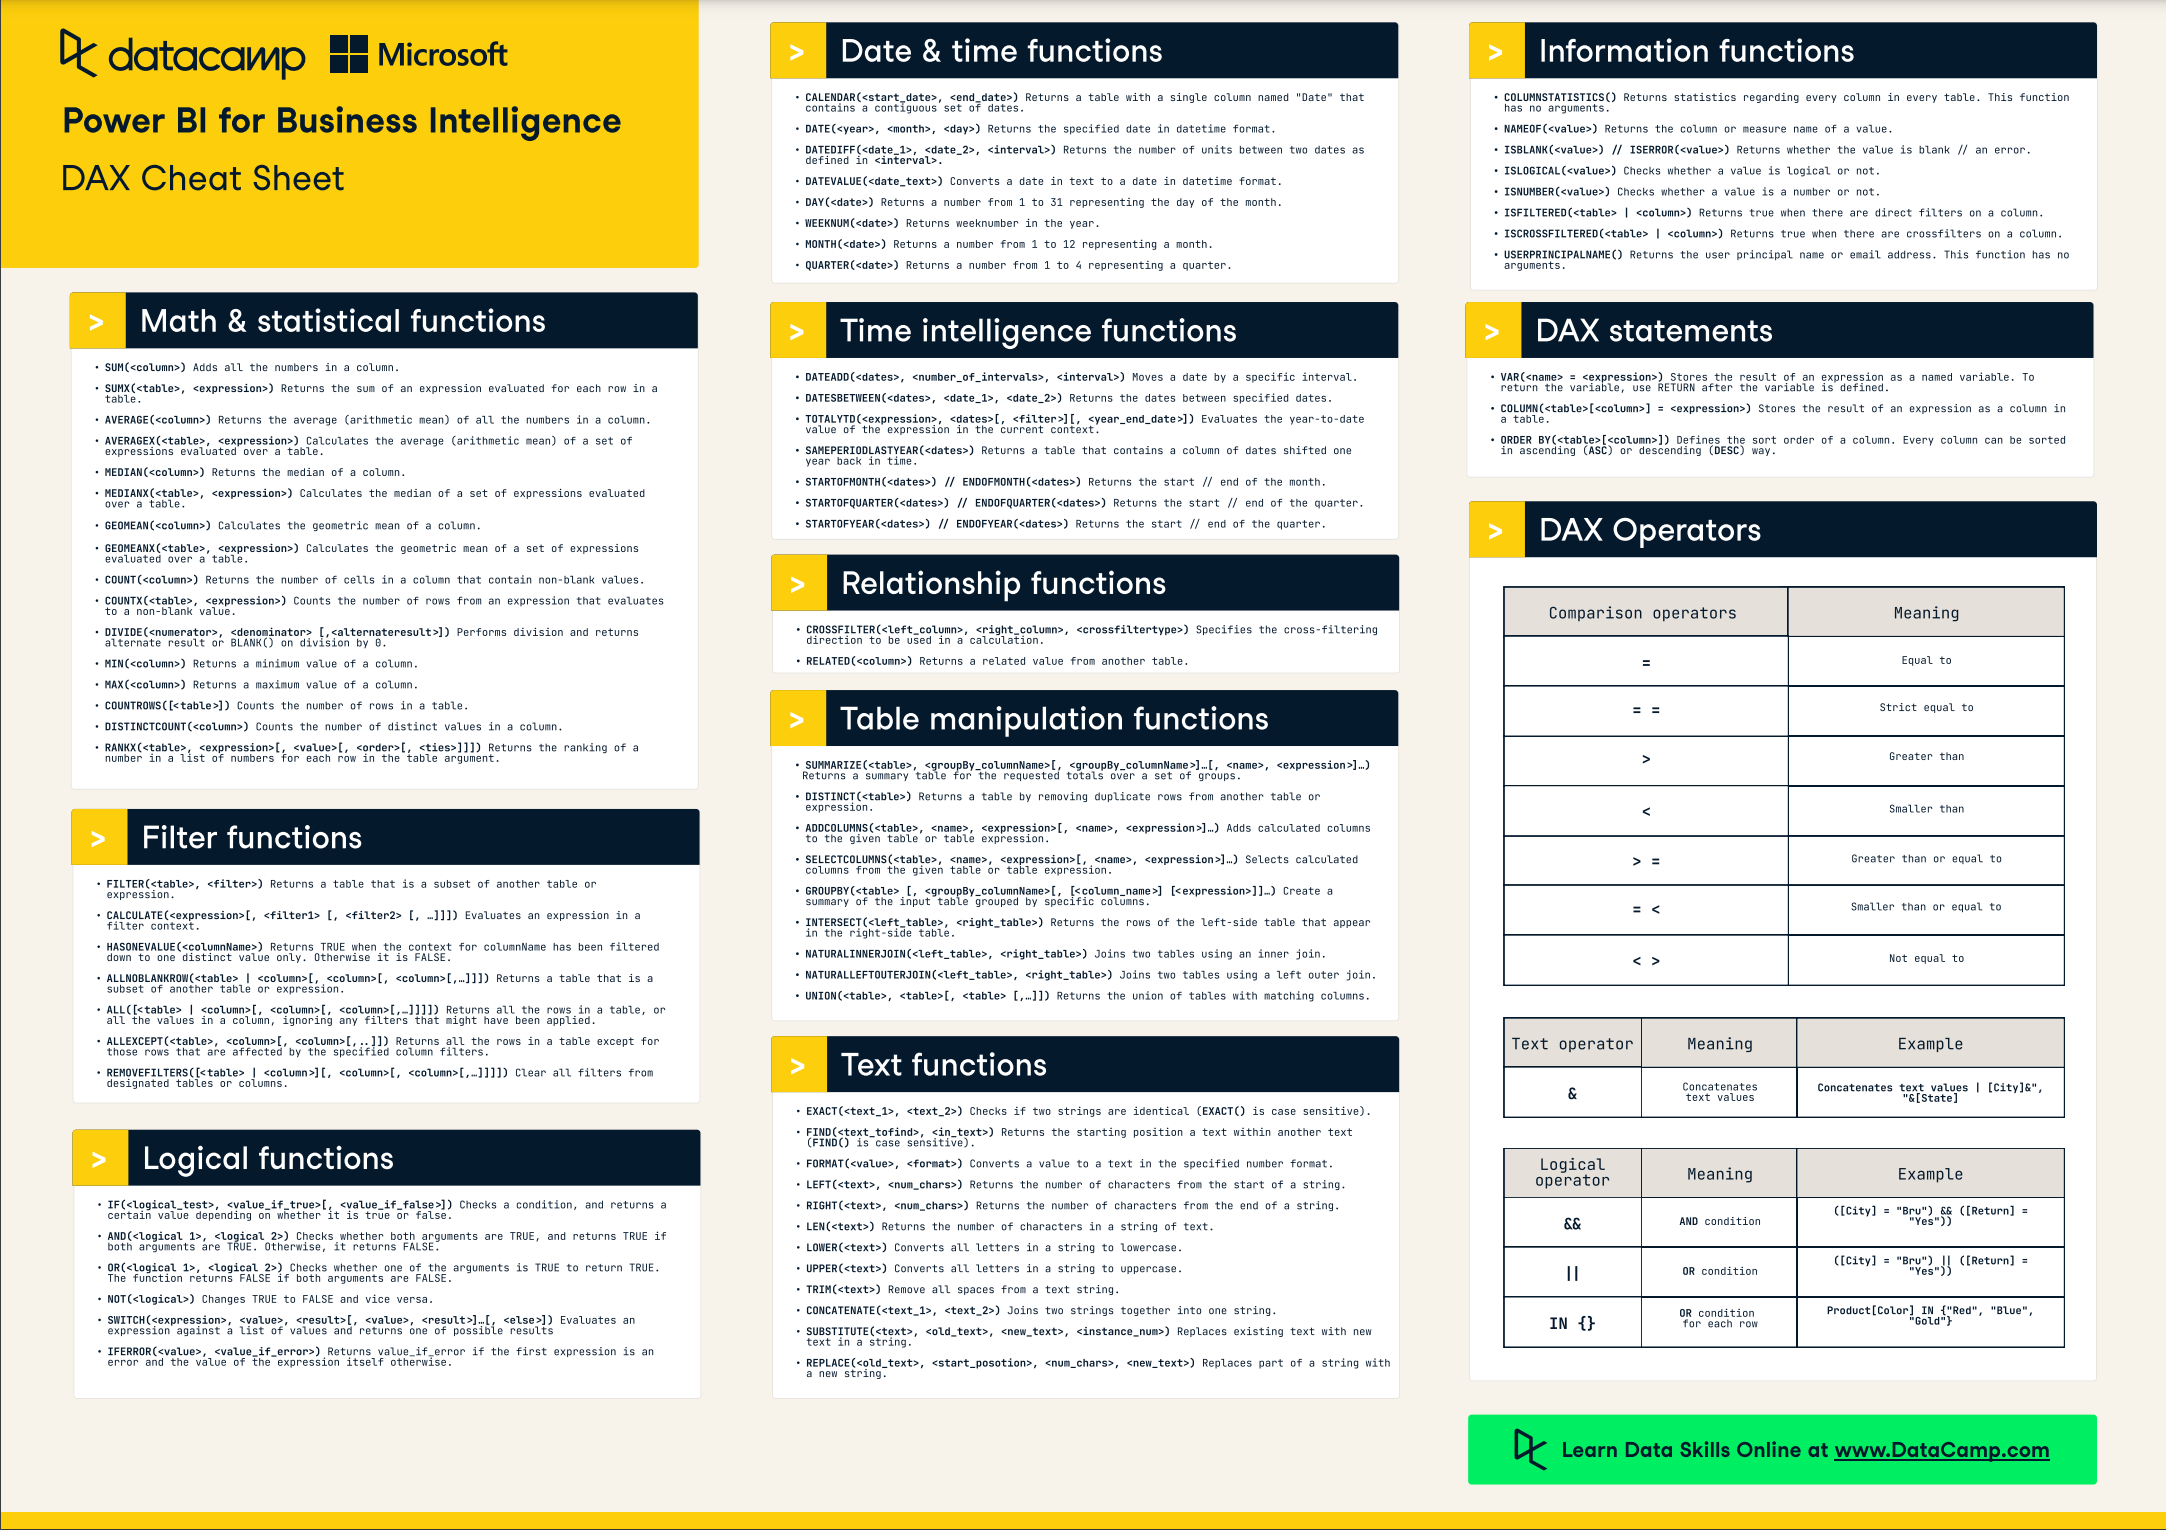
SUM(<column>)Adds all the numbers in a column.SUMX(<table>, <expression>)Returns the sum of an expression evaluated for each row in a table.AVERAGE(<column>)Returns the average (arithmetic mean) of all the numbers in a column.AVERAGEX(<table>, <expression>)Calculates the average (arithmetic mean) of a set of expressions evaluated over a table.MEDIAN(<column>)Returns the median of a column.MEDIANX(<table>, <expression>)Calculates the median of a set of expressions evaluated over a table.GEOMEAN(<column>)Calculates the geometric mean of a column.GEOMEANX(<table>, <expression>)Calculates the geometric mean of a set of expressions evaluated over a table.COUNT(<column>)Returns the number of cells in a column that contains non-blank values.COUNTX(<table>, <expression>)Counts the number of rows from an expression that evaluates to a non-blank value.DIVIDE(<numerator>, <denominator> [,<alternateresult>])Performs division and returns alternate result orBLANK()on division by 0.MIN(<column>)Returns a minimum value of a column.MAX(<column>)Returns a maximum value of a column.COUNTROWS([<table>])Counts the number of rows in a table.DISTINCTCOUNT(<column>)Counts the number of distinct values in a column.RANKX(<table>, <expression>[, <value>[, <order>[, <ties>]]])Returns the ranking of a number in a list of numbers for each row in the table argument.
Filter Functions
FILTER(<table>, <filter>)Returns a table that is a subset of another table or expression.CALCULATE(<expression>[, <filter1> [, <filter2> [, …]]])Evaluates an expression in a filter context.HASONEVALUE(<columnName>)ReturnsTRUEwhen the context for columnName has been filtered down to one distinct value only. Otherwise, it isFALSE.ALLNOBLANKROW(<table> | <column>[, <column>[, <column>[,…]]])Returns a table that is a subset of another table or expression.ALL([<table> | <column>[, <column>[, <column>[,…]]]])Returns all the rows in a table, or all the values in a column, ignoring any filters that might have been applied.ALLEXCEPT(<table>, <column>[, <column>[,..]])Returns all the rows in a table except for those rows that are affected by the specified column filters.REMOVEFILTERS([<table> | <column>][, <column>[, <column>[,…]]]])Clear all filters from designated tables or columns.
Logical Functions
IF(<logical_test>, <value_if_true>[, <value_if_false>])Checks a condition, and returns a certain value depending on whether it is true or false.AND(<logical 1>, <logical 2>)Checks whether both arguments areTRUE, and returnsTRUEif both arguments areTRUE. Otherwise, it returnsFALSE.OR(<logical 1>, <logical 2>)Checks whether one of the arguments isTRUEto returnTRUE. The function returnsFALSEif both arguments areFALSE.NOT(<logical>)ChangesTRUEtoFALSEand vice versa.SWITCH(<expression>, <value>, <result>[, <value>, <result>]…[, <else>])Evaluates an expression against a list of values and returns one of possible resultsIFERROR(<value>, <value_if_error>)Returns value_if_error if the first expression is an error and the value of the expression itself otherwise.
Date & Time Functions
CALENDAR(<start_date>, <end_date>)Returns a table with a single column named "Date" that contains a contiguous set of dates.DATE(<year>, <month>, <day>)Returns the specified date in datetime format.DATEDIFF(<date_1>, <date_2>, <interval>)Returns the number of units between two dates as defined in <interval>.DATEVALUE(<date_text>)Converts a date in text to a date in datetime format.DAY(<date>)Returns a number from 1 to 31 representing the day of the month.WEEKNUM(<date>)Returns weeknumber in the year.MONTH(<date>)Returns a number from 1 to 12 representing a month.QUARTER(<date>)Returns a number from 1 to 4 representing a quarter.
Time Intelligence Functions
DATEADD(<dates>, <number_of_intervals>, <interval>)Moves a date by a specific interval.DATESBETWEEN(<dates>, <date_1>, <date_2>)Returns the dates between specified dates.TOTALYTD(<expression>, <dates>[, <filter>][, <year_end_date>])Evaluates the year-to-date value of the expression in the current context.SAMEPERIODLASTYEAR(<dates>)Returns a table that contains a column of dates shifted one year back in time.STARTOFMONTH(<dates>) // ENDOFMONTH(<dates>)Returns the start // end of the month.STARTOFQUARTER(<dates>) // ENDOFQUARTER(<dates>)Returns the start // end of the quarter.STARTOFYEAR(<dates>) // ENDOFYEAR(<dates>)Returns the start // end of the quarter.
Relationship Functions
CROSSFILTER(<left_column>, <right_column>, <crossfiltertype>)Specifies the cross-filtering direction to be used in a calculation.RELATED(<column>)Returns a related value from another table.
Table Manipulation Functions
SUMMARIZE(<table>, <groupBy_columnName>[, <groupBy_columnName>]…[, <name>, <expression>]…)Returns a summary table for the requested totals over a set of groups.DISTINCT(<table>)Returns a table by removing duplicate rows from another table or expression.ADDCOLUMNS(<table>, <name>, <expression>[, <name>, <expression>]…)Adds calculated columns to the given table or table expression.SELECTCOLUMNS(<table>, <name>, <expression>[, <name>, <expression>]…)Selects calculated columns from the given table or table expression.GROUPBY(<table> [, <groupBy_columnName>[, [<column_name>] [<expression>]]…)Create a summary of the input table grouped by specific columns.INTERSECT(<left_table>, <right_table>)Returns the rows of the left-side table that appear in the right-side table.NATURALINNERJOIN(<left_table>, <right_table>)Joins two tables using an inner join.NATURALLEFTOUTERJOIN(<left_table>, <right_table>)Joins two tables using a left outer join.UNION(<table>, <table>[, <table> [,…]])Returns the union of tables with matching columns.
Text Functions
EXACT(<text_1>, <text_2>)Checks if two strings are identical (EXACT()is case sensitive).FIND(<text_tofind>, <in_text>)Returns the starting position a text within another text (FIND()is case sensitive).FORMAT(<value>, <format>)Converts a value to a text in the specified number format.LEFT(<text>, <num_chars>)Returns the number of characters from the start of a string.RIGHT(<text>, <num_chars>)Returns the number of characters from the end of a string.LEN(<text>)Returns the number of characters in a string of text.LOWER(<text>)Converts all letters in a string to lowercase.UPPER(<text>)Converts all letters in a string to uppercase.TRIM(<text>)Remove all spaces from a text string.CONCATENATE(<text_1>, <text_2>)Joins two strings together into one string.SUBSTITUTE(<text>, <old_text>, <new_text>, <instance_num>)Replaces existing text with new text in a string.REPLACE(<old_text>, <start_posotion>, <num_chars>, <new_text>)Replaces part of a string with a new string.
Information Functions
COLUMNSTATISTICS()Returns statistics regarding every column in every table. This function has no arguments.NAMEOF(<value>)Returns the column or measure name of a value.ISBLANK(<value>)//ISERROR(<value>)Returns whether the value is blank // an error.ISLOGICAL(<value>)Checks whether a value is logical or not.ISNUMBER(<value>)Checks whether a value is a number or not.ISFILTERED(<table> | <column>)Returns true when there are direct filters on a column.ISCROSSFILTERED(<table> | <column>)Returns true when there are crossfilters on a column.USERPRINCIPALNAME()Returns the user principal name or email address. This function has no arguments.
DAX Statements
VAR(<name> = <expression>)Stores the result of an expression as a named variable. To return the variable, use RETURN after the variable is defined.COLUMN(<table>[<column>] = <expression>)Stores the result of an expression as a column in a table.ORDER BY(<table>[<column>])Defines the sort order of a column. Every column can be sorted in ascending (ASC) or descending (DESC) way.
DAX Operators
| Comparison operators | Meaning |
= |
Equal to |
= = |
Strict equal to |
> |
Great than |
< |
Smaller than |
> = |
Greater than or equal to |
= < |
Smaller than or equal to |
< > |
Not equal to |
| Text operator | Meaning | Example |
& |
Concatenates text values | Concatenates text values | [City]&", "&[State] |
| Logical operator | Meaning | Example |
&& |
AND condition |
([City] = "Bru") && ([Return] = "Yes")) |
|| |
OR condition |
([City] = "Bru") || ([Return] = "Yes")) |
IN {} |
OR condition for each row |
Product[Color] IN {"Red", "Blue", "Gold"} |
Master Power BI From Scratch
No experience required—learn to work with data via Power BI.
Topics


