Top 5 Business Intelligence Courses to Take on DataCamp
DataCamp offers various business intelligence courses tailored to equip you with the skills necessary to thrive in any data-driven role. Whether you are a seasoned learner or just starting on DataCamp, these courses cover popular data analysis tools essential for analytics. Read on and start learning today!
Introduction to Power BI
- What is it: A 3-hour course providing a comprehensive overview of Power BI basics and how to build impactful reports.
- Taught by: Sara Billen, Data Scientist at DataCamp.
- What you will learn:
- Gain a 360° overview of Power BI basics.
- Learn to load and transform data using Power Query confidently.
- Understand the importance of data models and how to make reports interactive.
- Create visualizations, sort data types, and drill deeper into reports.
- Where to start: Enroll the course here!
Intermediate DAX in Power BI
- What is it: A course focusing on DAX functions and their applications, including logical functions, row-level security, table manipulation functions, and time intelligence functions.
- Taught by: Carl Rosseel, Head of the BI Curriculum at DataCamp.
- What you will learn:
- Expand core DAX knowledge with logical functions like IF and SWITCH.
- Use DAX for row-level security and table manipulation.
- Explore time intelligence functions for advanced visuals without writing DAX.
- Where to start: Enroll the course here!
Financial Analysis in Power BI
- What is it: A course focusing on basic and intermediate finance skills and how to apply them in Power BI dashboards.
- Taught by: Nick Edwards, Analyst for Mynd
- What you will learn:
- Learn how to perform financial analysis in Power BI or apply existing financial skills using Power BI data visualizations.
- Understand how to use the income statement and balance sheet in Power BI.
- Engage in a Power BI case study where you analyze mortgage trading, enhancing your data modeling and financial analysis skills.
- Where to start: Enroll the course here!
Introduction to Tableau
- What is it: A course providing a comprehensive introduction to Tableau, a widely used BI and analytics software.
- Taught by: Maarten Van den Broeck, Maarten Van den Broeck
- What you will learn:
- Understand fundamental concepts and features of Tableau, including loading data, working with workbooks, and navigating the interface.
- Learn to create visualizations using an Airbnb dataset and build your first Tableau dashboard.
- Explore best practices for formatting and presenting data with Tableau, such as creating dual-axis graphs and understanding the differences between worksheets, dashboards, and stories.
- Gain the skills needed to explore Tableau and create impactful data dashboards confidently.
- Where to start: Enroll the course here!
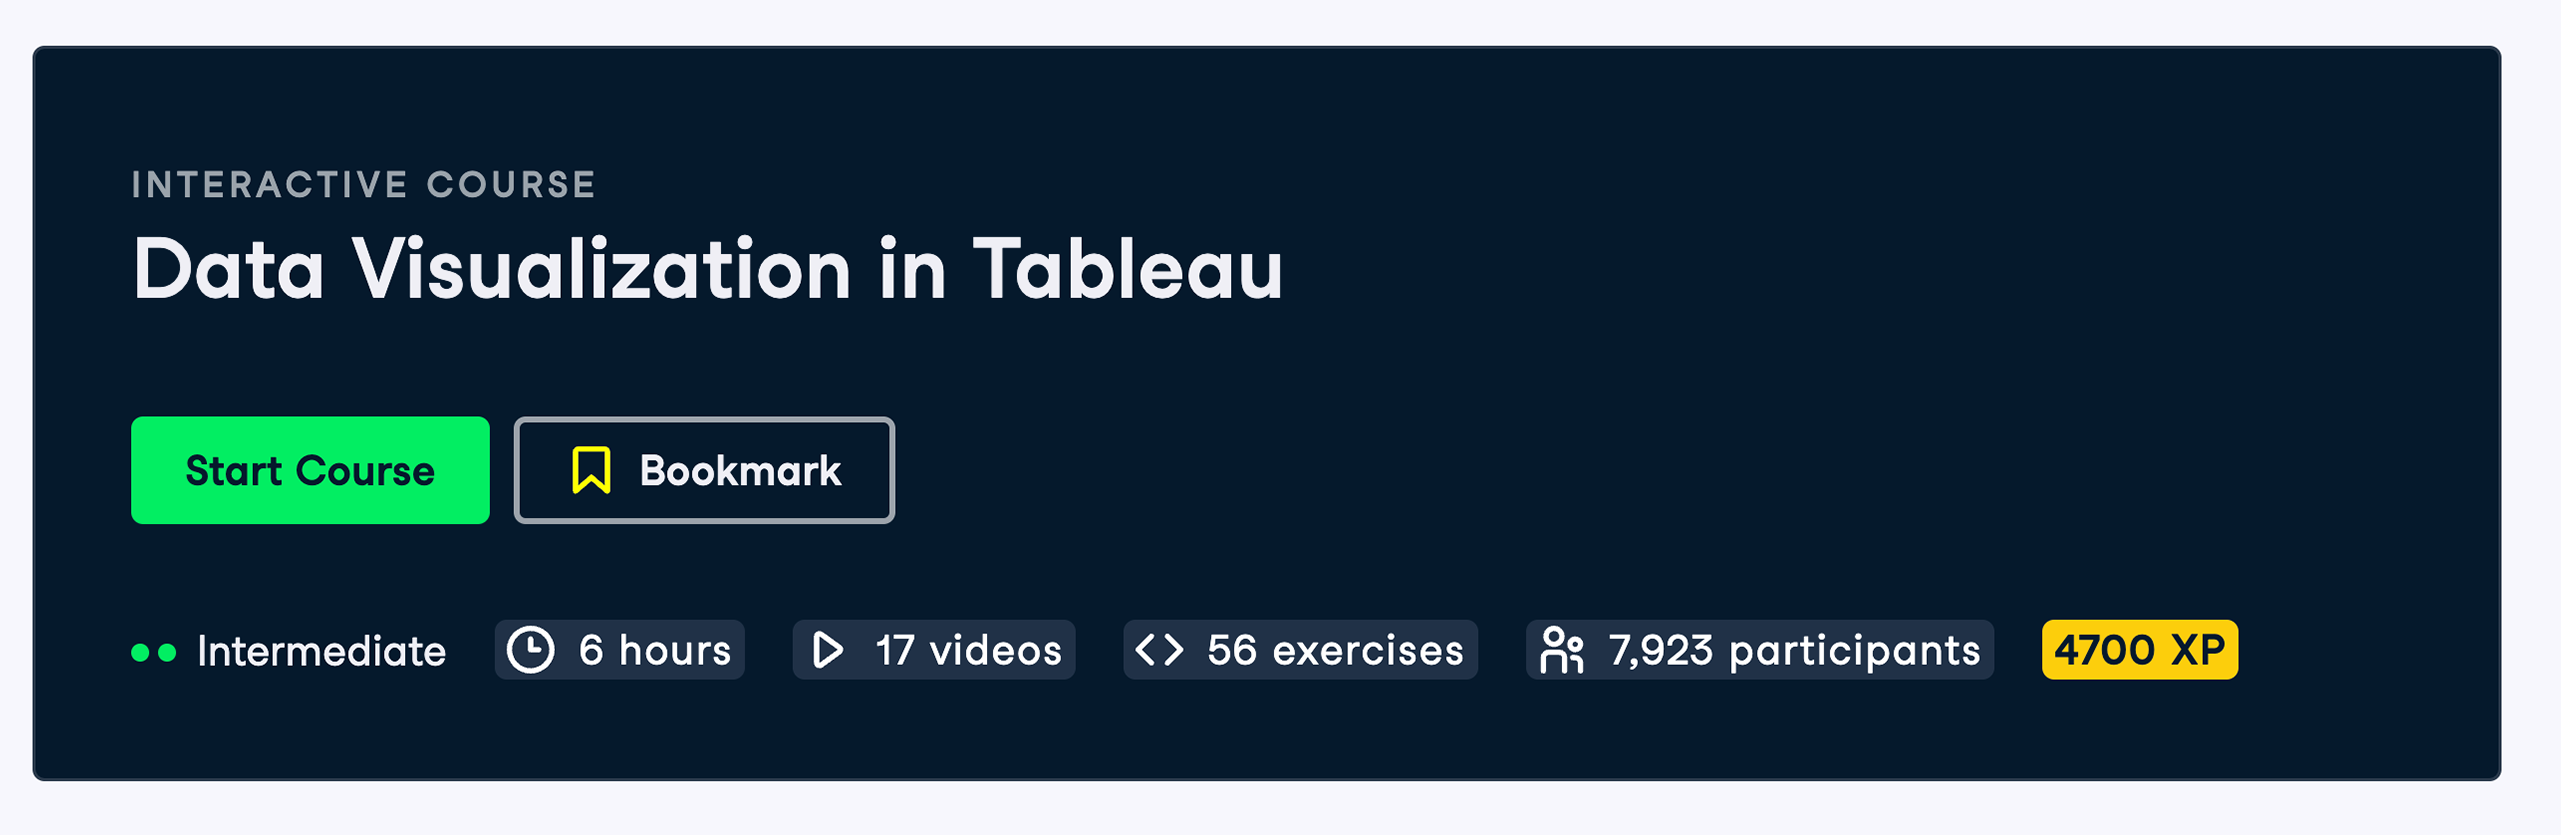
Data Visualization in Tableau
- What is it: A course designed to help you create engaging and informative visualizations using Tableau.
- Taught by: Agata Bak-Geerinck, Senior Data Analyst at Telenet
- What you will learn:
- Learn the principles of data visualization and how to use Tableau to create informative, useful, and attractive charts.
- Discover best practices for making data visualizations, including creating basic and intermediate visualizations, analyzing change over time with line charts, and using stacked bar charts to get unstuck.
- Explore how to communicate insights visually, which increases understanding and retention of information.
- Progress from basic data visualization skills to advanced and custom-made charts, such as Waffle, DNA, and Sankey charts.
- Where to start: Enroll the course here!
Learn more!
For those looking to expand their data analytics and visualization skills further, DataCamp offers a range of Tableau and Power BI courses. Whether you're a beginner or looking to deepen your expertise, there's something for everyone. Explore more courses on DataCamp to continue your learning journey in data visualization and analytics.


blog
Power BI Developer Salaries in 2024: Unlock Your Earning Potential

Joleen Bothma
6 min
tutorial
Power BI Slicer Tutorial: A Comprehensive Guide to Enhancing Your Reports
Joleen Bothma
7 min
tutorial
How to Create a Waterfall Chart in Tableau

Eugenia Anello
8 min
tutorial
Power BI RELATED DAX Function: Introduction and Use Cases
Joleen Bothma
9 min
tutorial
A Comprehensive Guide to DAX LOOKUPVALUE
Joleen Bothma
9 min
tutorial
Power BI Matrix: A Comprehensive Guide
Joleen Bothma
10 min