HomeCheat sheetsMachine Learning

Unsupervised Machine Learning Cheat Sheet

In this cheat sheet, you'll have a guide around the top unsupervised machine learning algorithms, their advantages and disadvantages and use cases.
Dec 2022  · 9 min read

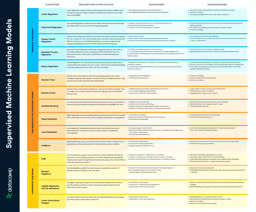
When working with machine learning models, it's easy to try them all out without understanding what each model does and when to use them. In this cheat sheet, you'll find a handy guide describing the most widely used unsupervised machine learning models, their advantages, disadvantages, and some key use cases.

Group 407.png

Have this cheat sheet at your fingertips
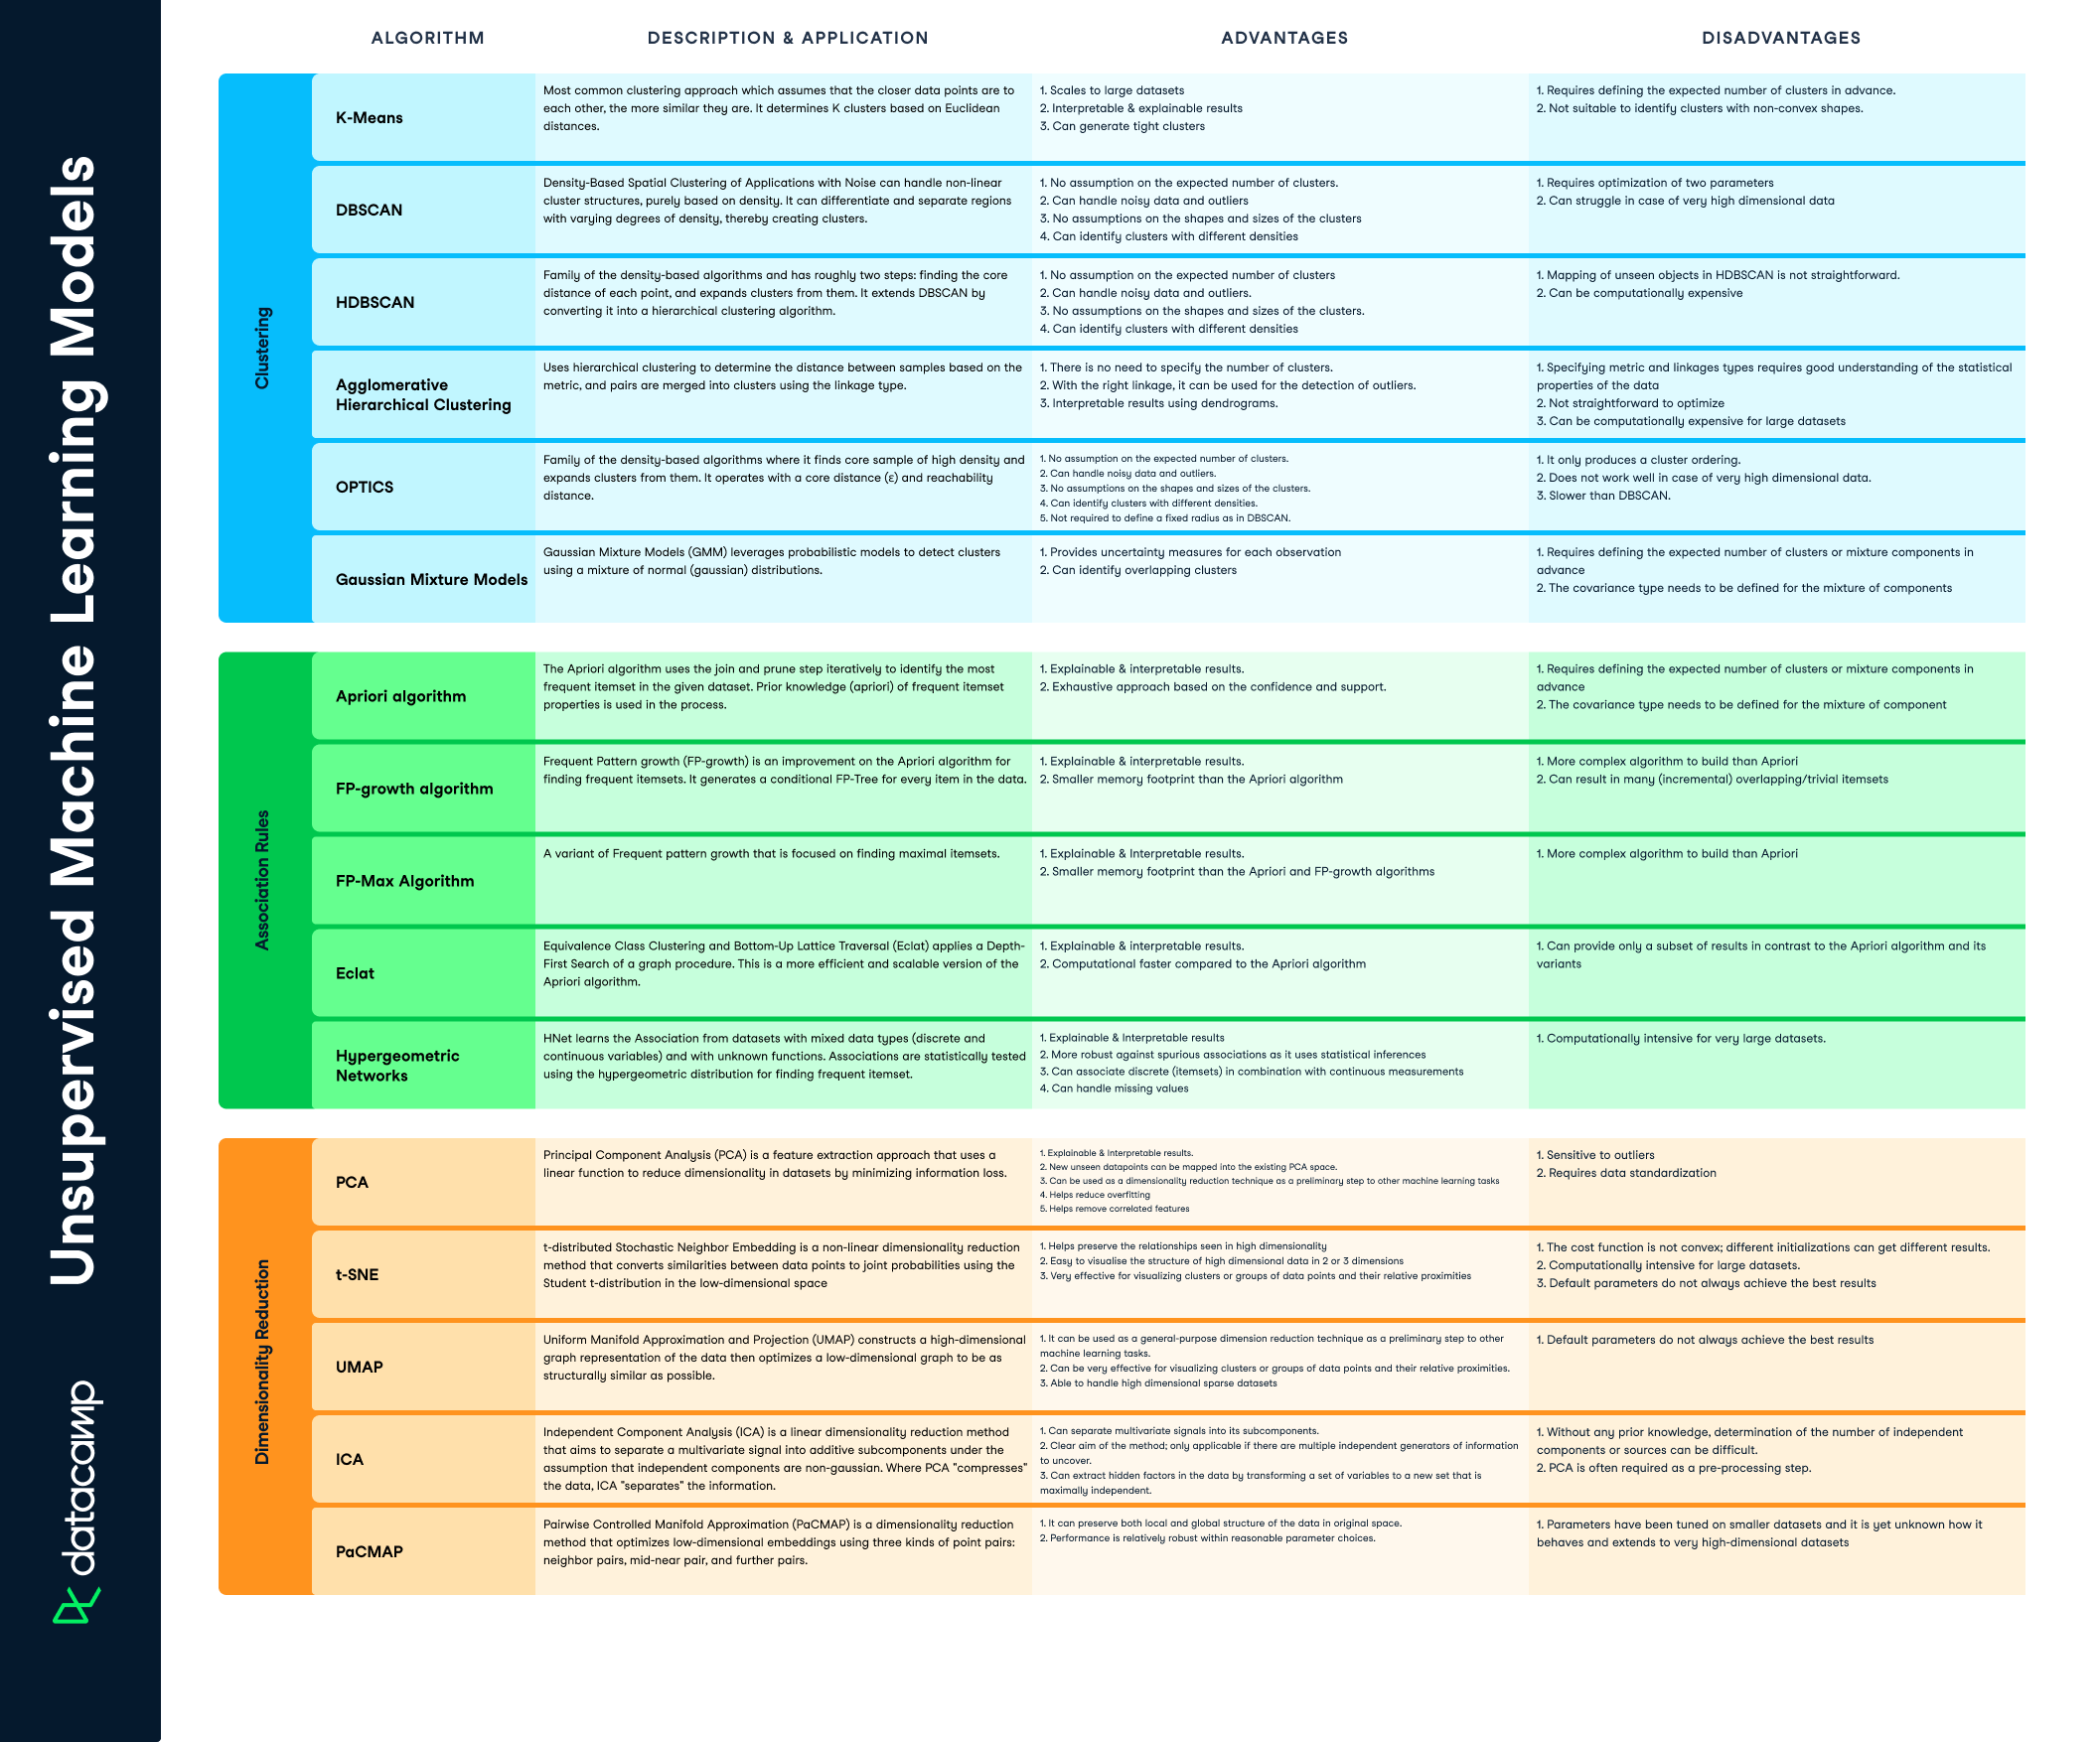
Download PDF

Unsupervised Learning

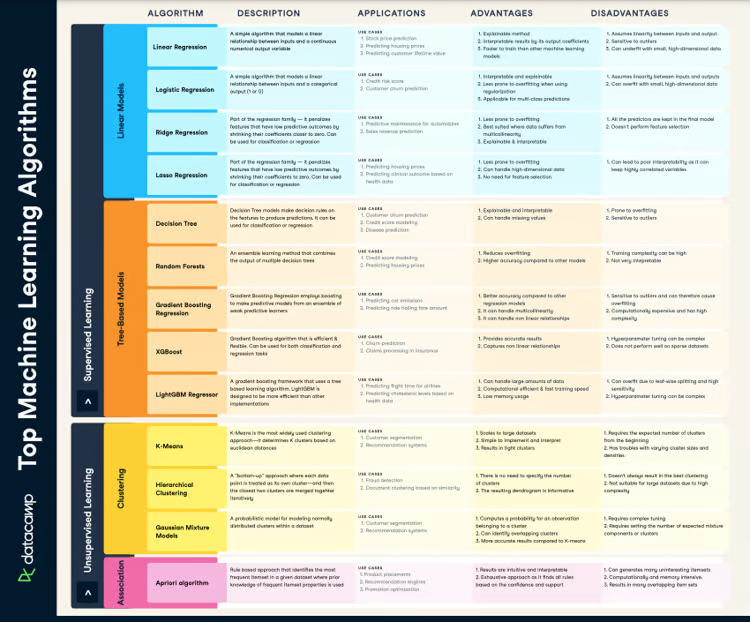
Unsupervised learning is about discovering general patterns in data. The most popular example is clustering or segmenting customers and users. This type of segmentation is generalizable and can be applied broadly, such as to documents, companies, and genes. Unsupervised learning consists of clustering models that learn how to group similar data points together or association algorithms that group different data points based on pre-defined rules. 

Clustering Models

Algorithm Description and Application Advantages Disadvantages
K-Means

Most common clustering approach which assumes that the closer data points are to each other, the more similar they are. It determines K clusters based on Euclidean distances.

  1. Scales to large datasets.
  2. Interpretable & explainable results
  3. Can generate tight clusters
  1. Requires defining the expected number of clusters in advance.
  2. Not suitable to identify clusters with non-convex shapes.
DBSCAN Density-Based Spatial Clustering of Applications with Noise can handle non-linear cluster structures, purely based on density. It can differentiate and separate regions with varying degrees of density, thereby creating clusters.
  1. No assumption on the expected number of clusters. 
  2. Can handle noisy data and outliers 
  3. No assumptions on the shapes and sizes of the clusters 
  4. Can identify clusters with different densities
  1. Requires optimization of two parameters.
  2. Can struggle in case of very high dimensional data
HDBSCAN Family of the density-based algorithms and has roughly two steps: finding the core distance of each point, and expands clusters from them. It extends DBSCAN by converting it into a hierarchical clustering algorithm.
  1. No assumption on the expected number of clusters 

  2. Can handle noisy data and outliers.
  3. No assumptions on the shapes and sizes of the clusters.
  4. Can identify clusters with different densities
  1. Mapping of unseen objects in HDBSCAN is not straightforward.
  2. Can be computationally expensive
Agglomerative 
Hierarchical Clustering Uses hierarchical clustering to determine the distance between samples based on the metric, and pairs are merged into clusters using the linkage type.
  1. There is no need to specify the number of clusters.
  2. With the right linkage, it can be used for the detection of outliers.
  3. Interpretable results using dendrograms.
  1. Specifying metric and linkages types requires good understanding of the statistical properties of the data
  2. Not straightforward to optimize
  3. Can be computationally expensive for large datasets
OPTICS Family of the density-based algorithms where it finds core sample of high density and expands clusters from them. It operates with a core distance (ɛ) and reachability distance.
  1. No assumption on the expected number of clusters.
  2. Can handle noisy data and outliers.
  3. No assumptions on the shapes and sizes of the clusters.
  4. Can identify clusters with different densities.
  5. Not required to define a fixed radius as in DBSCAN.
  1. It only produces a cluster ordering.
  2. Does not work well in case of very high dimensional data.
  3. Slower than DBSCAN.
Gaussian Mixture Models Gaussian Mixture Models (GMM) leverages probabilistic models to detect clusters using a mixture of normal (gaussian) distributions.
  1. Provides uncertainty measures for each observation
  2. Can identify overlapping clusters
  1. Requires defining the expected number of clusters or mixture components in advance
  2. The covariance type needs to be defined for the mixture of components

Association Rules

Algorithm Description and Application Advantages Disadvantages
Apriori algorithm The Apriori algorithm uses the join and prune step iteratively to identify the most frequent itemset in the given dataset. Prior knowledge (apriori) of frequent itemset properties is used in the process.
  1. Explainable & interpretable results.
  2. Exhaustive approach based on the confidence and support.
  1. Requires defining the expected number of clusters or mixture components in advance
  2. The covariance type needs to be defined for the mixture of component
FP-growth algorithm Frequent Pattern growth (FP-growth) is an improvement on the Apriori algorithm for finding frequent itemsets. It generates a conditional FP-Tree for every item in the data.
  1. Explainable & interpretable results.

  2. Smaller memory footprint than the Apriori algorithm

  1. More complex algorithm to build than Apriori
  2. Can result in many (incremental) overlapping/trivial itemsets
FP-Max Algorithm A variant of Frequent pattern growth that is focused on finding maximal itemsets.
  1. Explainable & Interpretable results.

  2. Smaller memory footprint than the Apriori and FP-growth algorithms

  1. More complex algorithm to build than Apriori
Eclat Equivalence Class Clustering and Bottom-Up Lattice Traversal (Eclat) applies a Depth-First Search of a graph procedure. This is a more efficient and scalable version of the Apriori algorithm.
  1. Explainable & interpretable results.
  2. Computational faster compared to the Apriori algorithm
  1. Can provide only a subset of results in contrast to the Apriori algorithm and its variants
Hypergeometric Networks HNet learns the Association from datasets with mixed data types (discrete and continuous variables) and with unknown functions. Associations are statistically tested using the hypergeometric distribution for finding frequent itemset. 
  1. Explainable & Interpretable results

  2. More robust against spurious associations as it uses statistical inferences 

  3. Can associate discrete (itemsets) in combination with continuous measurements

  4. Can handle missing values

  1. Computationally intensive for very large datasets.

Dimensionality Reduction

Algorithm Description and Application Advantages Disadvantages
PCA Principal Component Analysis (PCA) is a feature extraction approach that uses a linear function to reduce dimensionality in datasets by minimizing information loss.
  1. Explainable & Interpretable results.
  2. New unseen datapoints can be mapped into the existing PCA space.
  3. Can be used as a dimensionality reduction technique as a preliminary step to other machine learning tasks
  4. Helps reduce overfitting
  5. Helps remove correlated features
  1. Sensitive to outliers
  2. Requires data standardization
t-SNE t-distributed Stochastic Neighbor Embedding is a non-linear dimensionality reduction method that converts similarities between data points to joint probabilities using the Student t-distribution in the low-dimensional space
  1. Helps preserve the relationships seen in high dimensionality
  2. Easy to visualise the structure of high-dimensional data in 2 or 3 dimensions
  3. Very effective for visualizing clusters or groups of data points and their relative proximities
  1. The cost function is not convex; different initializations can get different results.
  2. Computationally intensive for large datasets.
  3. Default parameters do not always achieve the best results
UMAP Uniform Manifold Approximation and Projection (UMAP) constructs a high-dimensional graph representation of the data then optimizes a low-dimensional graph to be as structurally similar as possible.
  1. It can be used as a general-purpose dimension reduction technique as a preliminary step to other machine learning tasks.
  2. Can be very effective for visualizing clusters or groups of data points and their relative proximities.
  3. Able to handle high dimensional sparse datasets
  1. Default parameters do not always achieve the best results
ICA Independent Component Analysis (ICA) is a linear dimensionality reduction method that aims to separate a multivariate signal into additive subcomponents under the assumption that independent components are non-gaussian. Where PCA "compresses" the data, ICA "separates" the information.
  1. Can separate multivariate signals into its subcomponents.
  2. Clear aim of the method; only applicable if there are multiple independent generators of information to uncover.
  3. Can extract hidden factors in the data by transforming a set of variables to a new set that is maximally independent.
  1. Without any prior knowledge, determination of the number of independent components or sources can be difficult.
  2. PCA is often required as a pre-processing step.
PaCMAP Pairwise Controlled Manifold Approximation (PaCMAP) is a dimensionality reduction method that optimizes low-dimensional embeddings using three kinds of point pairs: neighbor pairs, mid-near pair, and further pairs.
  1. It can preserve both local and global structure of the data in original space.
  2. Performance is relatively robust within reasonable parameter choices.
  1. Parameters have been tuned on smaller datasets and it is yet unknown how it behaves and extends to very high-dimensional datasets
Topics
Related

How to Learn Machine Learning in 2024

Discover how to learn machine learning in 2024, including the key skills and technologies you’ll need to master, as well as resources to help you get started.
Adel Nehme's photo

Adel Nehme

15 min

A Beginner's Guide to CI/CD for Machine Learning

Learn how to automate model training, evaluation, versioning, and deployment using GitHub Actions with the easiest MLOps guide available online.
Abid Ali Awan's photo

Abid Ali Awan

15 min

OpenCV Tutorial: Unlock the Power of Visual Data Processing

This article provides a comprehensive guide on utilizing the OpenCV library for image and video processing within a Python environment. We dive into the wide range of image processing functionalities OpenCV offers, from basic techniques to more advanced applications.
Richmond Alake's photo

Richmond Alake

13 min

An Introduction to the Mamba LLM Architecture: A New Paradigm in Machine Learning

Discover the power of Mamba LLM, a transformative architecture from leading universities, redefining sequence processing in AI.
Kurtis Pykes 's photo

Kurtis Pykes

9 min

A Beginner's Guide to Azure Machine Learning

Explore Azure Machine Learning in our beginner's guide to setting up, deploying models, and leveraging AutoML & ML Studio in the Azure ecosystem.
Moez Ali's photo

Moez Ali

11 min

ML Workflow Orchestration With Prefect

Learn everything about a powerful and open-source workflow orchestration tool. Build, deploy, and execute your first machine learning workflow on your local machine and the cloud with this simple guide.
Abid Ali Awan's photo

Abid Ali Awan

See MoreSee More