HomeTutorialsBusiness Intelligence

Power BI RELATED DAX Function: Introduction and Use Cases

Learn how to use the RELATED DAX function in Power BI to simplify data modeling and build insightful reports.
Apr 2024  · 9 min read

Data modeling is fundamental to building insightful Power BI reports. It enables you to define clear table relationships and efficiently organize, clean, and retrieve data. In this tutorial, you’ll learn about the RELATED function in Power BI.

By looking at hands-on examples, you’ll learn how the RELATED function can enhance your data modeling and reporting skills.

If you’re still new to Power BI, you can familiarize yourself with the subject with the help of our Power BI Fundamentals skill track.

You can also download the DAX cheat sheet and keep it on hand as you learn more about Power BI and DAX.

Power BI DAX Cheat Sheet

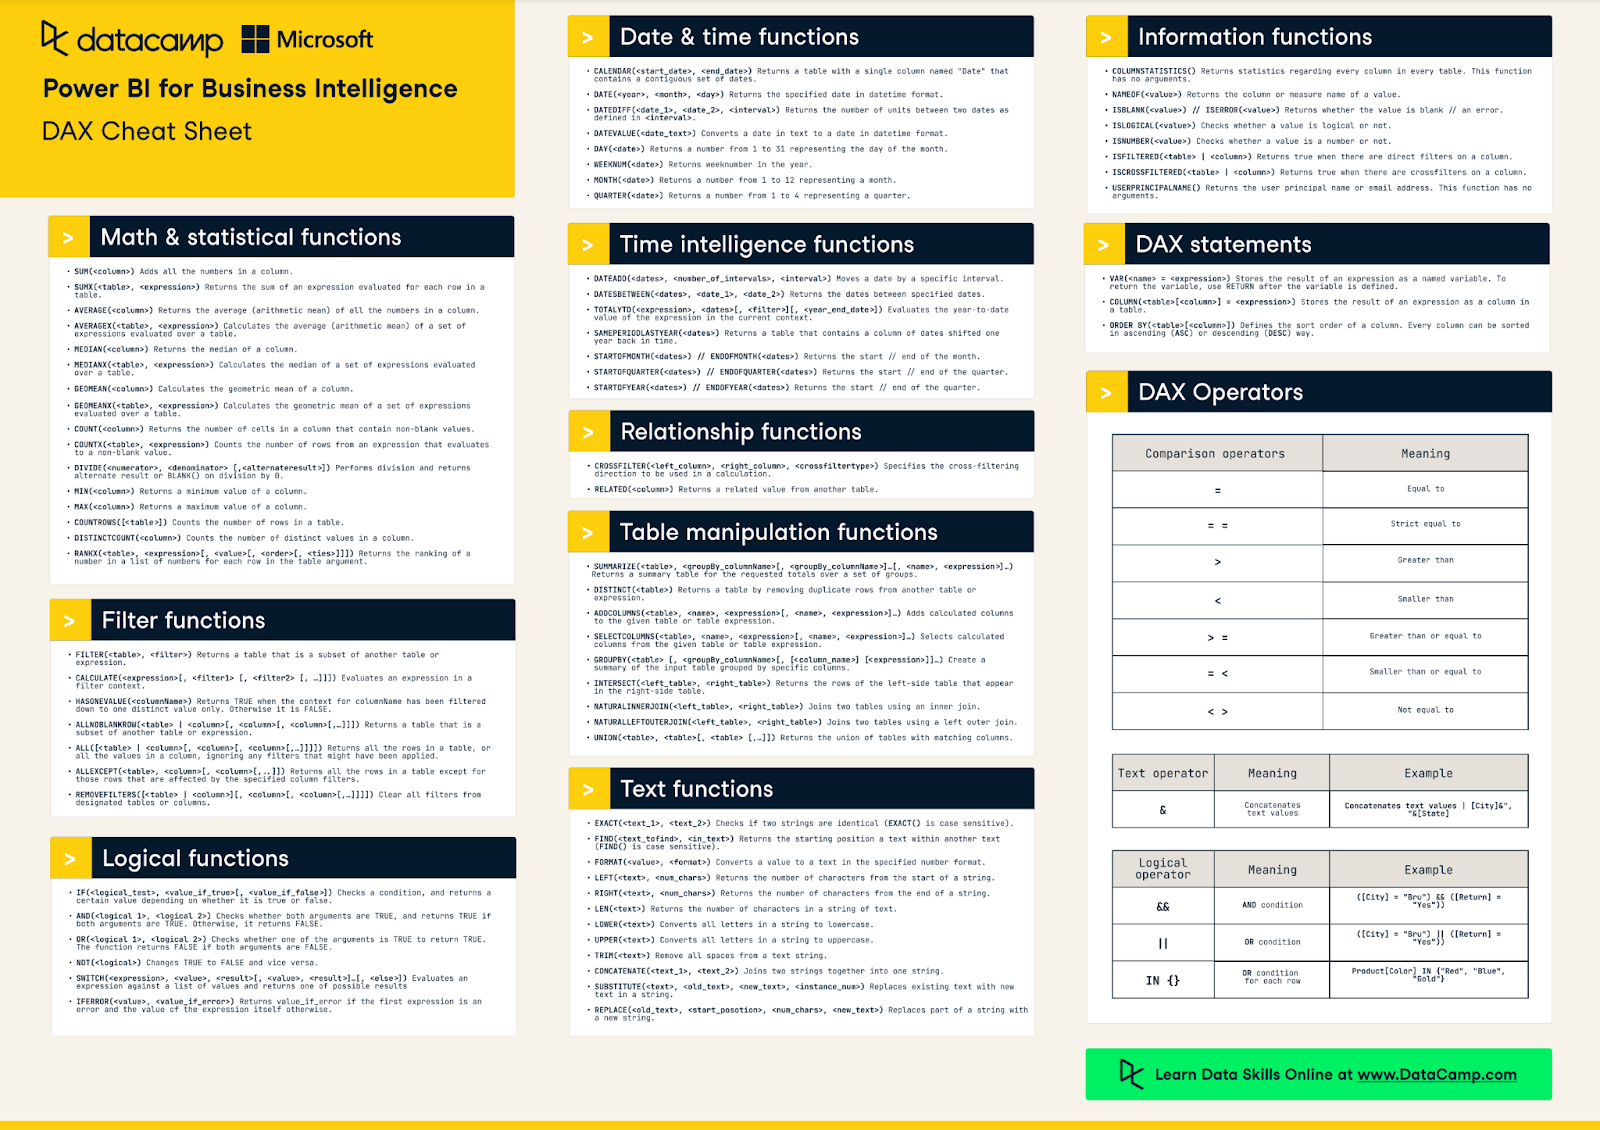
DataCamp DAX Cheat Sheet

RELATED is a Power BI DAX function that allows you to fetch a value from a column in a related table. Crucially, this function only works if there's a relationship between the current table and the table where the desired column is located.

The RELATED function simplifies data modeling by allowing you to incorporate relevant data from different tables without manually merging or joining tables.

This is what the syntax for the RELATED function looks like:

RELATED(ColumnToFetch)

As a simple example, suppose you have a Sales table and a separate Products table:

InvoiceID

ProductID

Quantity

Price

1000

123

2

21

1001

456

1

19.99

1002

123

3

31.5

1003

789

1

24.95

Table 1. Sales


ProductID

ProductName

UnitPrice

123

Widget

10.5

456

Gear

19.99

789

Gizmo

24.95

Table 2. Products

The Sales table tracks sales transactions, including a Product ID for each sale, but not the product name or details. The Products table contains those names and details linked to each Product ID.

Without RELATED, you’d have to merge the two tables if you wanted to create a calculated column that uses the product name from within the Sales table.

With RELATED, you can create a new column in the Sales table that directly shows the Product Name for each sale by fetching it from the Products table. You can also use the RELATED function in a measure to dynamically fetch this information.

InvoiceID

ProductID

Quantity

Price

Product Name

1000

123

2

21

Widget

1001

456

1

19.99

Gear

1002

123

3

31.5

Widget

1003

789

1

24.95

Gizmo

Table 3. Using RELATED

Understanding Relationships in Power BI

In Power BI, relationships allow you to link tables together based on common columns. These relationships are fundamental to how Power BI integrates data from multiple sources, allowing for a relational database approach within your data models.

Types of relationships in Power BI

The types of relationships we can have in Power BI are:

  • One-to-one (1:1): Each row in one table is related to one (and only one) row in another table. This type of relationship is less common.
  • One-to-many (1:many): A single row in one table can relate to many rows in another table. This is the most common type of relationship in Power BI.
  • Many-to-many (many:many): Rows in one table can relate to multiple rows in another table and vice versa. Due to potential complexity and performance implications, use many-to-many relationships with caution.

The RELATED function leverages these relationships to fetch data from a related table, pulling it into the context of the current table. Without properly defined relationships, the RELATED function won’t work.

Relationships provide a clear navigational path for RELATED to follow, ensuring that the function knows exactly where to pull the data from.

Good data modeling practices and well-defined relationships allow the RELATED function to access related data efficiently. This means you can avoid complex lookup operations and improve the performance and usability of your Power BI reports.

Let's now examine some examples to understand how RELATED works in practice.

Suppose we have a table containing monthly product sales but not product names or categories, just the ProductID. We also have a Products table with ProductID, ProductName, and Category. We create a relationship between these two tables using ProductID.

We want to analyze sales by product category. To do this, we create a calculated column in the Sales table with the following DAX formula, which we can then add to a visual in our Power BI report:

ProductCategory = RELATED(Products[ProductCategory])

RELATED is perfect for this because there's a direct, one-to-many relationship between Products and Sales, making it straightforward to fetch ProductName or Category.

Advanced scenario

RELATED is particularly powerful when you need to pull data from a related table into the current table's context.

Using RELATED in a measure allows you to perform dynamic calculations that change according to the report's current filter context. Measures are used for aggregations and can incorporate related data through row context functions like SUMX.

If you’re not familiar with the SUMX function, you can learn more about it in this comprehensive SUMX tutorial.

Let’s explore a more complex version of our earlier example. Suppose you have tables containing multiple products with different prices and a dynamic sales target that varies by product and changes monthly. Your goal is to track monthly sales performance against these targets across different product categories.

Our data model, which contains a Sales and Products table, now also includes a SalesTargets table containing monthly sales targets for each product, including ProductID, Month, and TargetAmount columns.

To use the RELATED function correctly, we create a relationship based on a composite key containing a combination of Product ID and Month in both the Sales and SalesTargets tables.

The objective is to calculate the percentage of sales target achieved for each product category, each month.

Monthly Target Achievement =
VAR TotalSalesRevenue =
    SUMX(
        Sales,
        Sales[QuantitySold] * RELATED(Products[Price])
    )
VAR MonthlyTarget =
    SUMX(
        Sales,
        RELATED(SalesTargets[TargetAmount])
    )
RETURN
IF(
    MonthlyTarget > 0,
    TotalSalesRevenue / MonthlyTarget,
    BLANK()
)

This measure calculates TotalSalesRevenue by iterating over the Sales table, using RELATED to fetch the Price per product. Then, MonthlyTarget is calculated by summing up target amounts for the relevant month and product from the SalesTargets table.

Finally, it divides the total sales revenue by the monthly target to get the achievement percentage, ensuring that it only returns a value if there's a target set (to avoid division by zero).

You can learn more about financial data analysis in the Financial Reporting in Power BI skill track, which has hands-on examples that walk you through analyzing and visualizing your data in Power BI.

Now that we've got a good grasp on how RELATED works, let's dive deeper and explore some of the best practices.

Apply RELATED for cases where you truly need data from another table incorporated into your current table's context for calculations. This is particularly useful for creating calculated columns that simplify report building.

Overusing RELATED can lead to unnecessarily complex data models, potentially slowing your report performance. If you can achieve your analysis directly through relationships in visuals without needing to bring the data into your table physically, that's often more efficient.

Understand your data model

Before using RELATED, make sure you understand your data model, especially the relationships between tables. RELATED requires an existing active relationship — typically a one-to-many relationship where the function is used on the "many" side to pull data from the "one" side.

The RELATED function does not work with many-to-many relationships.

If you use RELATED without properly defining your relationships or misunderstanding the directionality of the relationship, it can lead to errors or unexpected results.

Understand the direction of the relationship

Use RELATED to pull data from a primary table (one side) into a related table (many side). This is especially useful when you want to include lookup data from other tables in your calculations or analyses.

Using RELATED in the opposite direction (from many to one) without a proper understanding can lead to confusion. For the reverse direction, RELATEDTABLE might be more appropriate, though it requires further aggregation functions since it returns a table.

When the RELATED function doesn't fit your needs in Power BI, there are some alternative approaches you can consider. The two alternatives we cover here are the LOOKUPVALUE function and merging data with Power Query.

LOOKUPVALUE

LOOKUPVALUE is an incredibly versatile function, but it might perform slower than RELATED. That’s because it searches through the table row by row to find a match. In our example, potentially thousands or millions of sales transactions could significantly slow down report performance.

LOOKUPVALUE might be unnecessarily complicated for simple needs where a direct relationship exists. However, if you need more complex matching criteria, don't have established relationships, or are not concerned about performance, LOOKUPVALUE offers more flexibility.

If you want to learn more, you can read this comprehensive guide to DAX LOOKUPVALUE.

Merging data with Power Query

Merging tables in Power Query effectively creates a static snapshot of your data when merging.

But suppose your Products table is frequently updated (new products added or categories changed). In that case, your merged table in Power Query won't automatically reflect these updates without a refresh of both the Products and Sales tables.

Merged tables can become quite large and may slow down your report's performance, especially if you're only interested in a small piece of data from the related table (like a product category).

Conclusion

The RELATED function simplifies data modeling by fetching data from connected tables based on relationships, eliminating the need for manual merges. This allows you to create calculated columns and measures that dynamically incorporate data from other tables.

For optimal use, use RELATED strategically, only introducing data into the current table's context when necessary. A clear understanding of the data model and established relationships is crucial.

If you want to continue learning about Power BI, you can try out these resources:

FAQs

Can the RELATED function be used with inactive relationships?

No, the RELATED function cannot directly leverage inactive relationships in Power BI. RELATED is designed to work with active relationships between tables.

In a Power BI model, while multiple relationships between two tables can exist, only one can be active at a time. The active relationship is the one that Power BI automatically uses for the RELATED function.

Can the RELATED function be used in a measure and a calculated column?

While RELATED is typically used within calculated columns, it can also be used in measures, particularly inside iterating functions like SUMX, which we explored in this tutorial.

When used in a measure, RELATED fetches data from a related table based on the current row context established by the iterating function. This allows dynamic calculations across related tables within the measure’s filter context.

Can the RELATED function be used across multiple tables in a chain of relationships?

Yes, RELATED can traverse a chain of relationships across multiple tables, as long as each link in the chain has a properly defined relationship. This enables complex data models where RELATED can pull data through intermediate tables.

How does filter context affect the use of RELATED in measures?

RELATED operates within the established filter context when used in measures, which can be modified by slicers, visuals, or other DAX functions like CALCULATE.

The values pulled by RELATED will reflect the current filter context, making it dynamic and responsive to changes in the report. This allows for context-sensitive calculations that adapt to user interactions.

Topics

Learn Power BI from scratch!

Course

Introduction to Power BI

3 hr
351.7K
Master the Power BI basics and learn to use the data visualization software to build impactful reports.
See DetailsRight Arrow
Start Course
See MoreRight Arrow
Related

blog

Power BI Developer Salaries in 2024: Unlock Your Earning Potential

Learn all about Power BI Developer Salaries, what to expect in the role, and how to increase your compensation
Joleen Bothma's photo

Joleen Bothma

6 min

tutorial

Power BI Slicer Tutorial: A Comprehensive Guide to Enhancing Your Reports

Unlock the power of Power BI slicers with our step-by-step tutorial. Learn to create, customize, and optimize slicers for better reports.
Joleen Bothma's photo

Joleen Bothma

7 min

tutorial

Complete Guide to Power BI Conditional Formatting

Learn how to use conditional formatting to boost your Power BI reports.
Joleen Bothma's photo

Joleen Bothma

7 min

tutorial

How to Create a Waterfall Chart in Tableau

Enhance your data analysis skills and learn how to build and customize a waterfall chart in Tableau
Eugenia Anello's photo

Eugenia Anello

8 min

tutorial

A Comprehensive Guide to DAX LOOKUPVALUE

Master the LOOKUPVALUE function in Power BI with simple examples and advanced combinations with other DAX functions.
Joleen Bothma's photo

Joleen Bothma

9 min

tutorial

Power BI Matrix: A Comprehensive Guide

Enhance your data analysis skills by learning how to customize a Power BI matrix.
Joleen Bothma's photo

Joleen Bothma

10 min

See MoreSee More