Course
Introduction to Power BI
4 hr
793.3K
The SUMX function in Power BI is a powerful DAX function used to calculate the sum of an expression that is calculated for each row in a table. This function is important because it allows for more complex calculations than a simple sum.
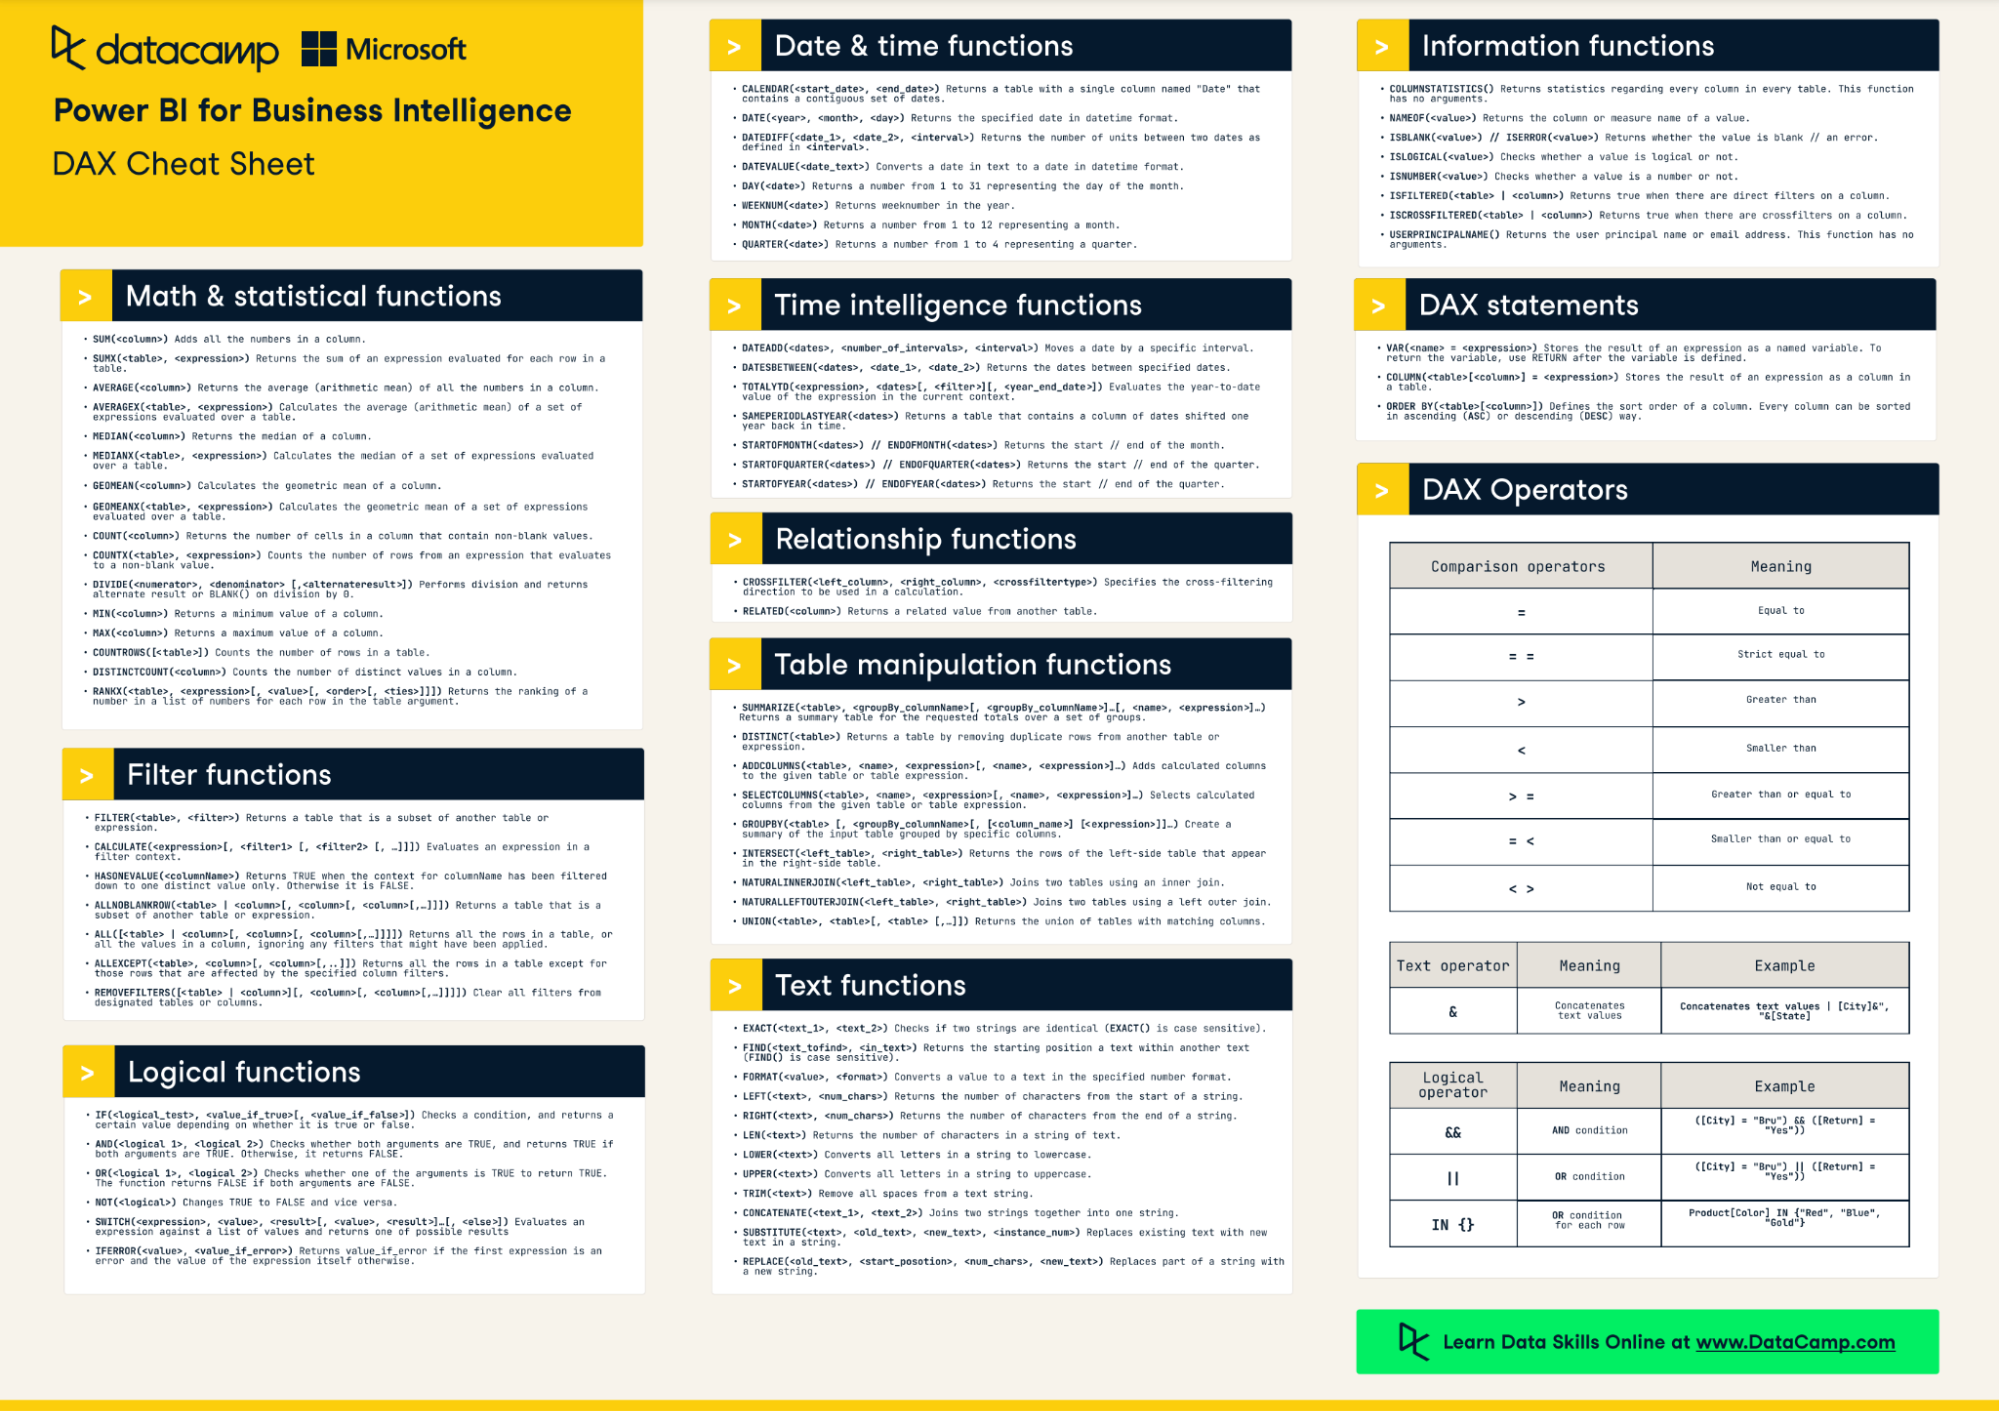
Keep our DAX cheat sheet on hand for a quick reference on many of the most useful DAX functions you will encounter.
The syntax of the SUMX function is
SUMX(Table, Expression)
SUMX is particularly useful when you must perform calculations that depend on individual row values before summing up the results. For example, calculating total sales by multiplying the quantity and price for each transaction or applying different discount rates per product before summing up the total discounted sales. It offers flexibility and precision in your calculations, making it a pretty important function to learn about.
Here's a breakdown of how the SUMX function works under the hood:
In Power BI, context is crucial for understanding how DAX functions like SUMX operate. Context determines how the values in data models are calculated and displayed. Check out our introduction to DAX course, where we discuss contexts in more detail. With the SUMX function, there are two main types of context to consider: row context and filter context.
Row context refers to the environment where DAX formulas evaluate each row of a table. When you are within a row context, you can directly reference columns of the table, and DAX formulas will use the value from the current row in calculations.
When you use SUMX, it creates and leverages row context for its operation. For each row in the specified table, SUMX evaluates the given expression in the context of that particular row.
Filter context is a set of filters applied to data in a Power BI report, such as filters from visuals, slicers, and report-level filters. This context determines which data points are considered in calculations.
Although SUMX operates within row context for its row-by-row calculations, these calculations are still subject to the overall filter context of the report or visual. This means that the rows iterated by SUMX are those that meet the criteria defined by the current filter context.
When using SUMX, the function respects both the row context and the filter context. The table over which SUMX iterates is shaped by the filter context, while the calculation for each row is done in the row context.
You can use a measure within SUMX. In this case, a context transition occurs, where the row context is temporarily transformed into an equivalent filter context to evaluate the measure for each row.
When using the SUMX function in Power BI, consider a few of these best practices:
Some functions are similar to SUMX, and knowing which function to use and when can be a little confusing. Let’s break down two functions that cause the most confusion.
SUM is used to calculate the sum of a column in a table and has the following syntax:
SUM(Column)
SUMX iterates over each row to evaluate an expression, while SUM directly aggregates values from a single column. This means that SUMX can handle more complex calculations involving multiple columns.
However, the iterative nature of SUMX makes it more resource-intensive, especially with large datasets, compared to SUM. Remember this if you’re working with a large data model, and stick to SUM for simple summations.
CALCULATE modifies the filter context on a calculation and is one of the most powerful functions in DAX. This is the syntax for the CALCULATE function:
CALCULATE(Expression, Filter1, Filter2,...)
CALCULATE is ideal for scenarios where you must perform calculations under different filter conditions than those currently applied to the report or model. On the other hand, SUMX is for row-level calculations followed by an aggregation.
In complex scenarios, we can use CALCULATE with other functions, like SUMX. For example, you might use CALCULATE to define a specific filter context within which SUMX performs its row-level calculations and aggregation.
Using the Power BI sample data (available when you install Power BI Desktop), we will demonstrate how to use the SUMX function and how to combine SUMX with some other useful DAX functions.
Here is a snapshot of our data showing monthly sales for different products across various segments and countries.
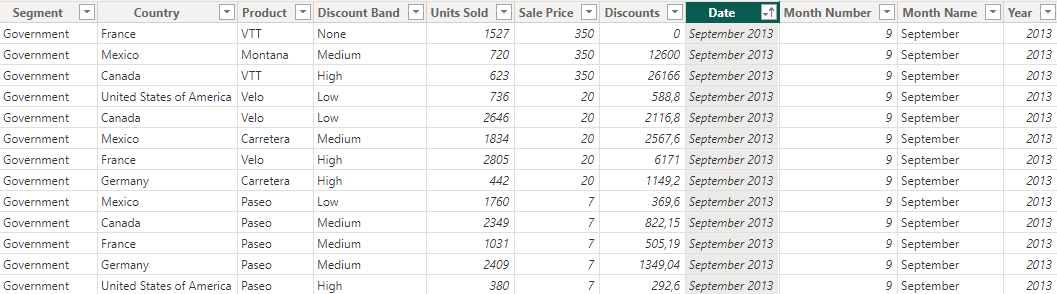
Here is a classic example of the power of SUMX. We want to use the number of units sold, the price per unit, and the value of any discounts given to calculate the total sales value.
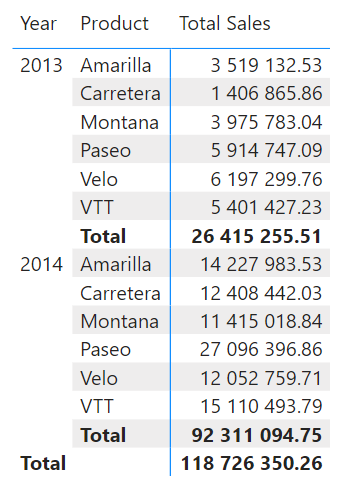
SUMX(Sales, (Sales[Units Sold] * Sales[Sale Price])-Sales[Discounts])
Here is a table showing the result of our SUMX function. As you can see, total sales can also have a filter context applied–in this case, we filter by Year and Product.
We could use filters with the SUMX function in two ways: with FILTER or CALCULATE.
FILTER is used to apply specific filters to a table or expression within SUMX. It allows more granular control over the rows that SUMX iterates over.
SUMX(FILTER(Sales, Sales[Discount Band] = "High"), Sales[Units Sold])
CALCULATE modifies the filter context for the SUMX function, allowing for complex conditional aggregations.
SUMX(Sales, CALCULATE(SUM(Sales[Units Sold]), Sales[Year] = 2020))
These functions are used to remove filters from a table or all tables except specified ones. They are often used within CALCULATE and in combination with SUMX to perform calculations over an unfiltered dataset.
SUMX(ALL(Sales), Sales[Sale Price] * Sales[Units Sold])
VALUES returns a one-column table of unique values from a column. You can combine it with SUMX for calculations that require iterating over unique values.
SUMX(VALUES(Sales[Country]), [Total Sales])
These are other iterative functions similar to SUMX but used to calculate average, minimum, or maximum values, respectively. They can be nested or used alongside SUMX.
AVERAGEX(Customers, SUMX(RELATEDTABLE(Sales), Sales[Units Sold]))
Logical functions like IF and SWITCH can be used within SUMX to perform conditional calculations.
SUMX(Sales, IF(Sales[Country] = "Mexico", Sales[Units Sold], 0))
USERELATIONSHIP specifies a particular relationship to be used in a calculation. It is especially useful when multiple relationships exist between tables.
SUMX(CALCULATETABLE(Sales, USERELATIONSHIP(Date[Date], Sales[Date])), Sales[Units Sold])
In this tutorial, we dug into the details of the SUMX function in Power BI and showed you how to implement it yourself. Not only is it a flexible and powerful DAX function, but it also demonstrates the importance of understanding contexts in DAX. To learn more, check out our Power BI fundamentals skill track.
Master the world's most popular business intelligence tool.
Start Your Power BI Journey Today!
Course
Course
Course
Tutorial
Allan Ouko
Tutorial
Laiba Siddiqui
Tutorial
Joleen Bothma
Tutorial
Joleen Bothma
Tutorial
Joleen Bothma
Tutorial
Joleen Bothma