Course
Data Visualization in Power BI
3 hr
144.1K
LOOKUPVALUE is a useful DAX function for finding and retrieving values in other tables.
While not a replacement for good data modeling practices in your Power BI reports, LOOKUPVALUE offers a lot of flexibility when writing complex expressions with multiple conditions, especially if you want to combine LOOKUPVALUE with other DAX functions.
In this tutorial, we’ll take you through the basics of the LOOKUPVALUE function, how it works, how to use it (especially when combined with other DAX functions), and some performance considerations and best practices to follow when using LOOKUPVALUE in your Power BI reports.
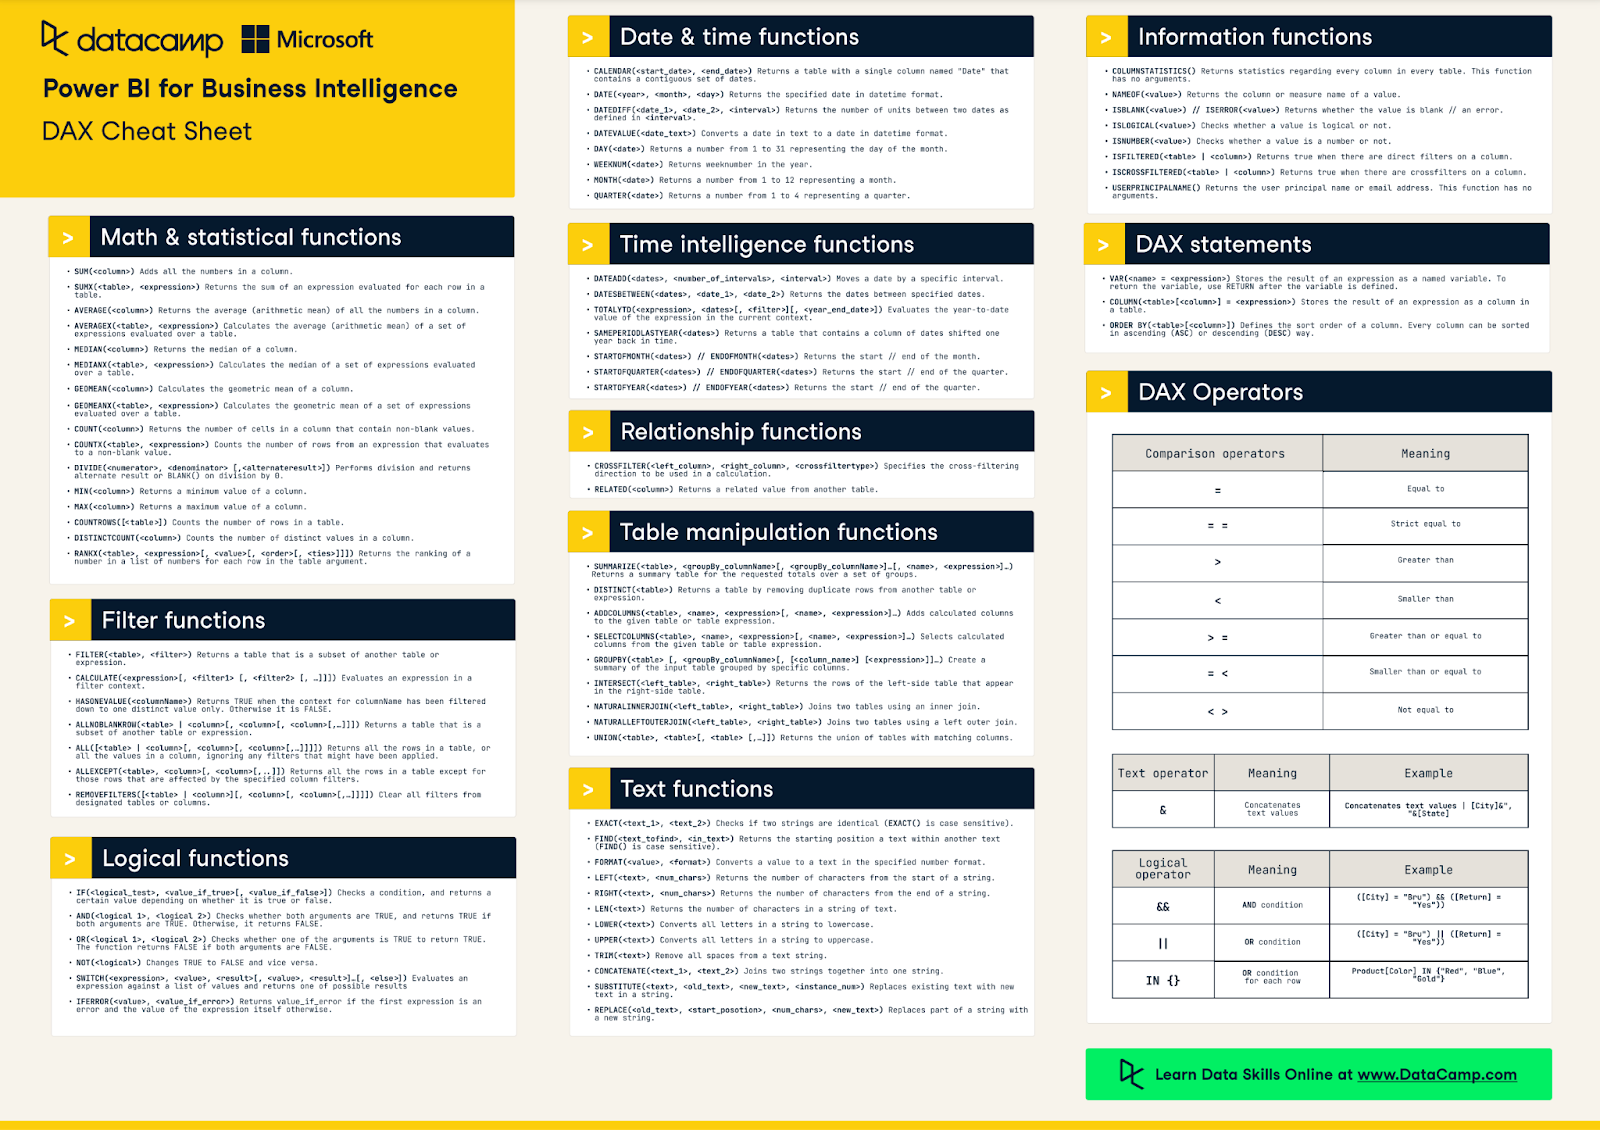
LOOKUPVALUE in Power BI is very similar to VLOOKUP in Microsoft Excel. However, it’s a good idea to familiarize yourself with DAX and Power BI before tackling LOOKUPVALUE. Our Power BI fundamentals skill track can get you up to speed quickly, and our DAX cheat sheet is a great reference to keep on hand while working with DAX functions.
Using the LOOKUPVALUE function, we can retrieve a single value from a column in another table based on one or more search conditions.
Here’s the standard syntax:
LOOKUPVALUE (
    <result_columnName>,
    <search_columnName>,
    <search_value>
    [, <search2_columnName>, <search2_value>]…
    [, <alternateResult>]
)
If you’re still new to DAX and the syntax, check out our Introduction to DAX course or have a quick read through our DAX tutorial for complete beginners. You can also deepen your DAX knowledge with our Intermediate DAX course.
Let’s go over the parameters of LOOKUPVALUE in more detail:
LOOKUPVALUE should perform a match against.LOOKUPVALUE does not find a suitable match, it’ll return this value.Each time LOOKUPVALUE performs a search in the target table, it should only ever find a single match. If there are multiple possible matches, you would need to define additional search pairs until LOOKUPVALUE is able to find a unique match.
For clarity, we'll discuss an example of this in the next section.
Let's say you have a products table with columns ProductID and ProductName. You want to find the name of the product with ID 101.
Product_Name = LOOKUPVALUE(Products[ProductName], Products[ProductID], 101)In this case, suppose you have a Sales table with columns ProductID, Region, and Revenue. You want to find the revenue for a specific product (ID 101) in a certain region (East).
Product_Revenue = LOOKUPVALUE(Sales[Revenue], Sales[ProductID], 101, Sales[Region], "East")In cases where the search conditions don’t return any matches, LOOKUPVALUE returns blank.
Here are two methods for handling these blank values:
LOOKUPVALUE.COALESCE function to specify an alternative result if LOOKUPVALUE returns a blank.You could specify a default value or alternative result in the LOOKUPVALUE function. This is an optional parameter that is placed at the very end of the LOOKUPVALUE expression.
Product_Name = LOOKUPVALUE(Products[ProductName], Products[ProductID], 101, "Not Found")Second, you could use the COALESCE function, which works almost exactly the same way as specifying an alternative result in the LOOKUPVALUE function.
However, depending on your use case and dataset, COALESCE could be more performant. If speed and performance are important for your Power BI report, then it's worth looking into COALESCE.
Commission Rate =
COALESCE(
     LOOKUPVALUE(
          'CommissionRates'[Rate],
          'CommissionRates'[SalespersonID], SELECTEDVALUE('Sales'[SalespersonID])
     ),
     0.05
)
Defining relationships between your tables is always good data modeling practice. It’s faster than using the DAX function LOOKUPVALUE, and it makes your semantic model easier to understand both now and in the future.
When you create relationships between your tables, you’re able to use the RELATED function. In most cases, the RELATED function is simpler and more direct than LOOKUPVALUE.
The RELATED function is ideal when you need to fetch a value from another table that has a direct relationship with your source table.
For example, if you want to add a customer's name to the sales table, and there’s a direct relationship between the sales table and the customers table on CustomerID, you can use:
Customer Name = RELATED(Customers[CustomerName])However, `LOOKUPVALUE` is more flexible than `RELATED` and is best used when you need to perform lookups without an existing direct relationship in your model or need to look up values based on complex or multiple criteria. It's versatile, but be careful not to overuse it because there are potential performance impacts.
We have already seen how you can combine LOOKUPVALUE with COALESCE to provide an alternative result when no match is found.
There are other DAX functions that pair well with LOOKUPVALUE, such as the CALCULATE and SWITCH functions.
We'll go over examples of these in this section.
Combining the LOOKUPVALUE function with the CALCULATE function is useful in scenarios where you need to retrieve values from another table based on a calculation or filter context that isn’t directly accessible through a simple relationship or a straightforward lookup.
This is often used to apply filters or change the granularity of calculations. When you combine it with LOOKUPVALUE, you can dynamically adjust the criteria for your lookup based on the results of calculations.
Here’s an example: Suppose you have a list of products and their sales targets for a specific year in a table. For a given product ID, you want to fetch its sales target for the current year.
Let’s go over how you could do this by combining the CALCULATE and LOOKUPVALUE functions.
Product Sales Target =
VAR SpecificProductID = 123
VAR CurrentYear = YEAR(TODAY())
RETURN
    CALCULATE(
        LOOKUPVALUE(
             SalesTargets[SalesTarget],
             SalesTargets[ProductID],
             SpecificProductID,
             SalesTargets[Year],
             CurrentYear
        ),
        ALL(SalesTargets)
)Combining the LOOKUPVALUE function with the SWITCH function works nicely when you need to dynamically look up values from another table and return different results based on multiple potential matches.
If you’re unfamiliar with the SWITCH function, we have a tutorial that will guide you through it in detail.
Here’s an example: Suppose you have a sales dataset and a separate commission rates table. The commission rate an employee receives is determined by their sales tier, which is not directly stored but can be calculated from their total sales amount.
You want to create a calculated column in the Sales table that indicates the commission rate for each sale based on the sales tier.
Commission Rate =
VAR SalesAmount = Sales[TotalSalesAmount]
VAR SalesTier =
    SWITCH(
        TRUE(),
        SalesAmount <= 500, "Low",
        SalesAmount <= 2000, "Medium",
        "High"
    )
RETURN
    LOOKUPVALUE(
        CommissionRates[CommissionRate],
        CommissionRates[SalesTier],
        SalesTier
    )
In this DAX expression, we use the SWITCH function to define the sales tier and then use this result in LOOKUPVALUE to retrieve the matching commission rate for that tier.
It is preferable to use direct relationships between tables whenever possible. Relationships are optimized for performance in Power BI, and functions like RELATED are often much more efficient than LOOKUPVALUE.
This approach also takes advantage of Power BI's internal optimizations, which is important if you’re trying to minimize your report loading times.
While LOOKUPVALUE can be used in calculated columns, it's generally best not to overdo it. Calculated columns are computed during data refresh and can slow the process, especially in large datasets.
Consider using LOOKUPVALUE in measures instead, where calculations are performed at query time and can benefit from query optimizations.
LOOKUPVALUE returns a blank result if no match is found. As we discussed earlier, It's important to choose the right method for handling this in your reports. You could consider using a function like COALESCE or the optional alternative result parameter of LOOKUPVALUE to provide default values when LOOKUPVALUE returns blank.
Ensure that the search value and the column being searched have matching data types, and be aware of case sensitivity. Mismatches in data types or case can lead to unexpected results or errors in the LOOKUPVALUE function.
In summary, LOOKUPVALUE gives you many more options when finding and retrieving values from other tables. It is especially powerful when you combine it with other DAX functions. However, it's not a replacement for good data modeling practices, and it is recommended that you first try to define relationships between tables in your Power BI reports.
If you’re considering moving into a career as a Power BI developer, check out our step-by-step guide on becoming a Power BI developer. We encourage you to continue your Power BI learning by exploring our complete Data Analyst in Power BI career track, which will teach you everything you need to know to start using Power BI in practice.
Continue Your Power BI Journey Today!
Course
Course
Course
Tutorial
Joleen Bothma
Tutorial
Arunn Thevapalan
Tutorial
Joleen Bothma
Tutorial
Joleen Bothma
Tutorial
Joleen Bothma
Tutorial
Joleen Bothma