
Track
Tableau Fundamentals
23hrs hr
Business intelligence (BI) is the heart of data-driven decisions. It combines analytics, data mining, data visualizations, and the use of data tools and infrastructure to make the decision-making process happen.
BI helps to channel the power of data to make better decisions to further improve performance, lower costs, manage risks and understand the market.
When it comes to using BI tools, it is not a one-size-fits-all kind of decision. Organizations need to consider different aspects, such as the business’s goal, data sources, integrations, collaboration, and more.
If we’re primarily focusing on BI tools, there are two that are currently the leading contenders in the BI landscape: Tableau and Looker Studio (Formerly Google Data Studio).

Image by DALL-E
Acquired by Google in 2019 and now part of the Google Cloud Platform (GCP), Looker is an enterprise platform for BI, data applications, and embedded analytics. The tool has been designed for businesses of all sizes.
The heart of Looker is its data modeling capabilities using LookML, short for Looker Modelling Language, which allows data analytics to find relationships between data and create models that can be accessed and explored by other users.
Looker seamlessly integrates with the GCP, with tools such as BigQuery allowing users to analyze large datasets in real time. The user-friendly interface allows users to explore the data without the need for technical expertise.
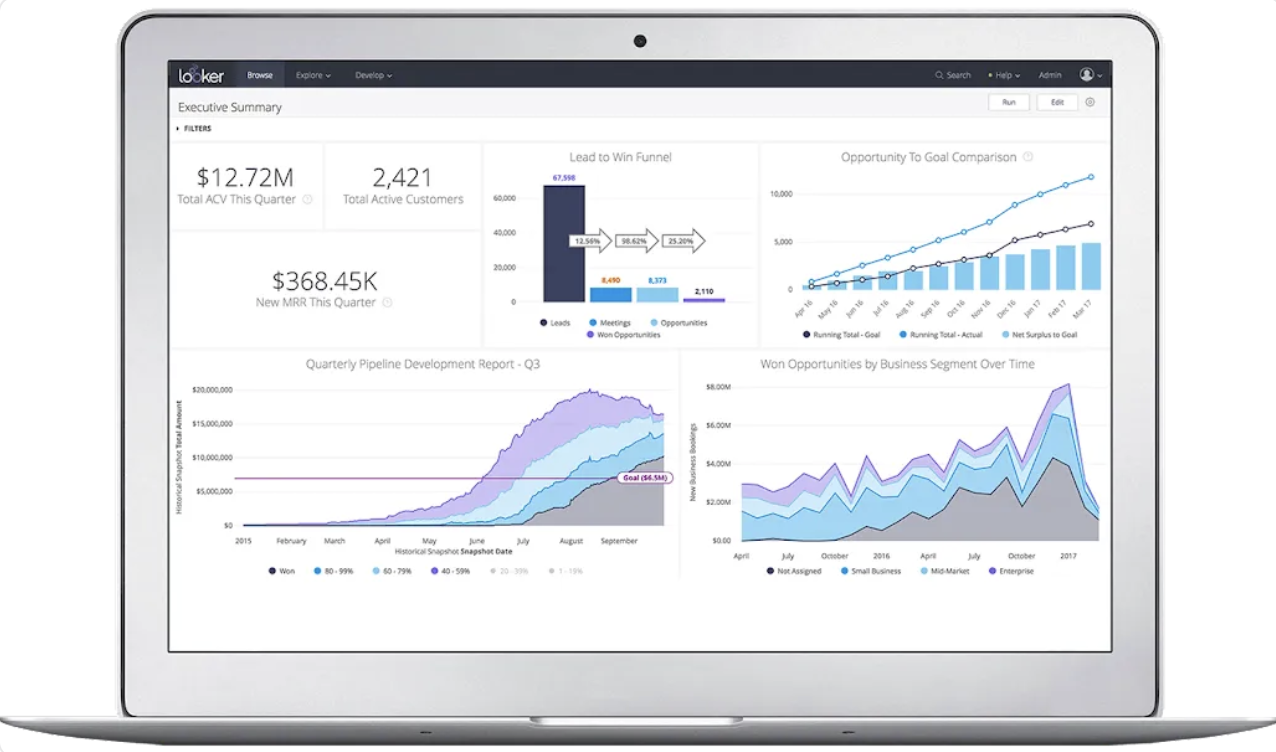
Image by Google Cloud
Founded in 2003 and acquired by Salesforce in 2019, Tableau is a visual analytics platform well known for its wide range of data visualization capabilities. It has transformed the way businesses understand and leverage their data. Tableau’s native language is VizQL, a data querying and visualization language.
When it comes to data visualization, Tableau sets the standard with its drag-and-drop interface. Users can create complex graphs, charts, and dashboards, making it accessible to all users from all levels so they can understand the patterns and trends in the data.
Outside of its data visualization capabilities, Tableau offers robust data analysis features that can connect to any data source, providing flexibility in data exploration. Its powerful in-memory data engine offers fast data processing, statistical computations, predictive modeling, and real-time analysis.
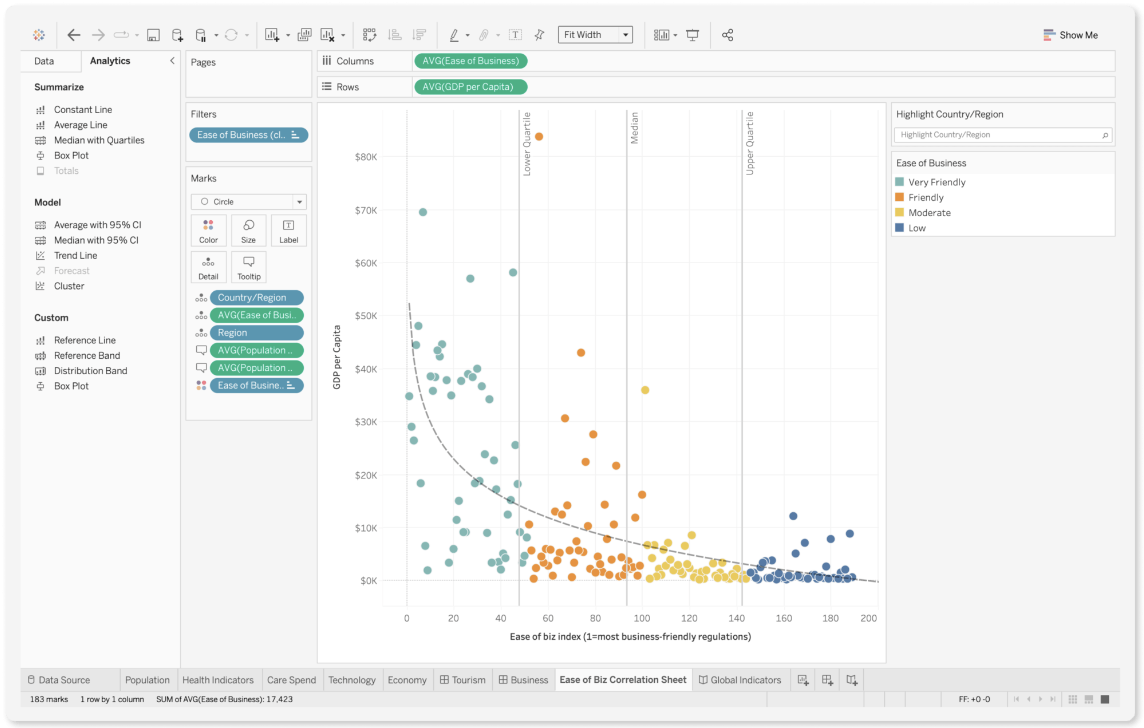
Image by Tableau
Data modeling and management are important elements of BI and data analytics. They act as the foundation for understanding, storing, organizing, and utilizing data in the most effective way possible.
When it comes to managing and standardizing data, LookML takes the win.
It allows users to define the business logic, understand the relationships between data, and make calculations directly on the platform. This approach ensures that the data analysis process is consistent and accurate, which is critical for data governance.
Organizations can also implement governance policies to further ensure data quality, compliance, and security.
On the other hand, Tableau’s approach to data modeling and management is focused on the flexibility of the platform and the comfortability of users.
Tableau’s interface allows users to handle diverse data structures without the requirement of programming knowledge. The drag-and-drop feature gives users the ability to create relationships between data and make calculations with ease.
Its data management capabilities are enhanced through its Data Model feature, which allows the integration of multiple data sources in a single view.
Visualizations are a key element for BI analysts and other stakeholders as they have a direct impact on their decision-making process.
Looker is powerful and user-friendly, making the creation of visualizations such as graphs and charts simple and effective. Users can create interactive dashboards that provide a comprehensive overview of metrics and trends with the use of a variety of chart types.
Looker also offers a drill-down capability that allows users to explore data in more detail and make adjustments with filters.
However, Looker has limitations when it comes to its visualization capabilities. For example, there are limitations to being able to customize different types of visualizations, such as the behavior of specific chart types. LookML is also not skill-set-friendly, as you will need to have a good understanding of LookML to navigate its full potential.
Another limitation is the platform caters to basic to intermediate analytics. Therefore, users who require advanced statistics or predictive modeling within visualizations will need to integrate other tools.
Tableau leads the way in data visualization. Known for its intuitive interface and analytics, users can transform their complex datasets into engaging visual stories. It also accommodates many data sources and has various visualization options, such as heat maps and scatter plots.
Tableau is continuously improving the platform with the integration of AI and ML for analysis, reaffirming its position as the leader in data visualization.
Preparing your data before it goes through the analysis phase is where the magic happens before it is integrated to help with the decision-making process.
LookML has a code-first environment that ensures precision and control of data preparation and integration on the platform. This works hand in hand with their version-controlled approach, ensuring that data is consistent, reusable, and easily maintainable.
Looker can also integrate with a wide range of data sources, such as Google BigQuery, allowing data to be seamlessly brought together in preparation for the analysis phase.
Tableau has a tool called Tableau Prep, which makes cleaning and preparing data easier without needing technical knowledge. The drag-and-drop interface makes the complex data preparation tasks much simpler and accessible to everybody. Tableau also offers seamless integration with a wide range of data courses such as Amazon Redshift, SQL databases, and more.
These extensive connections allow users to combine their data, analyze it, and create single visualizations or dashboards.
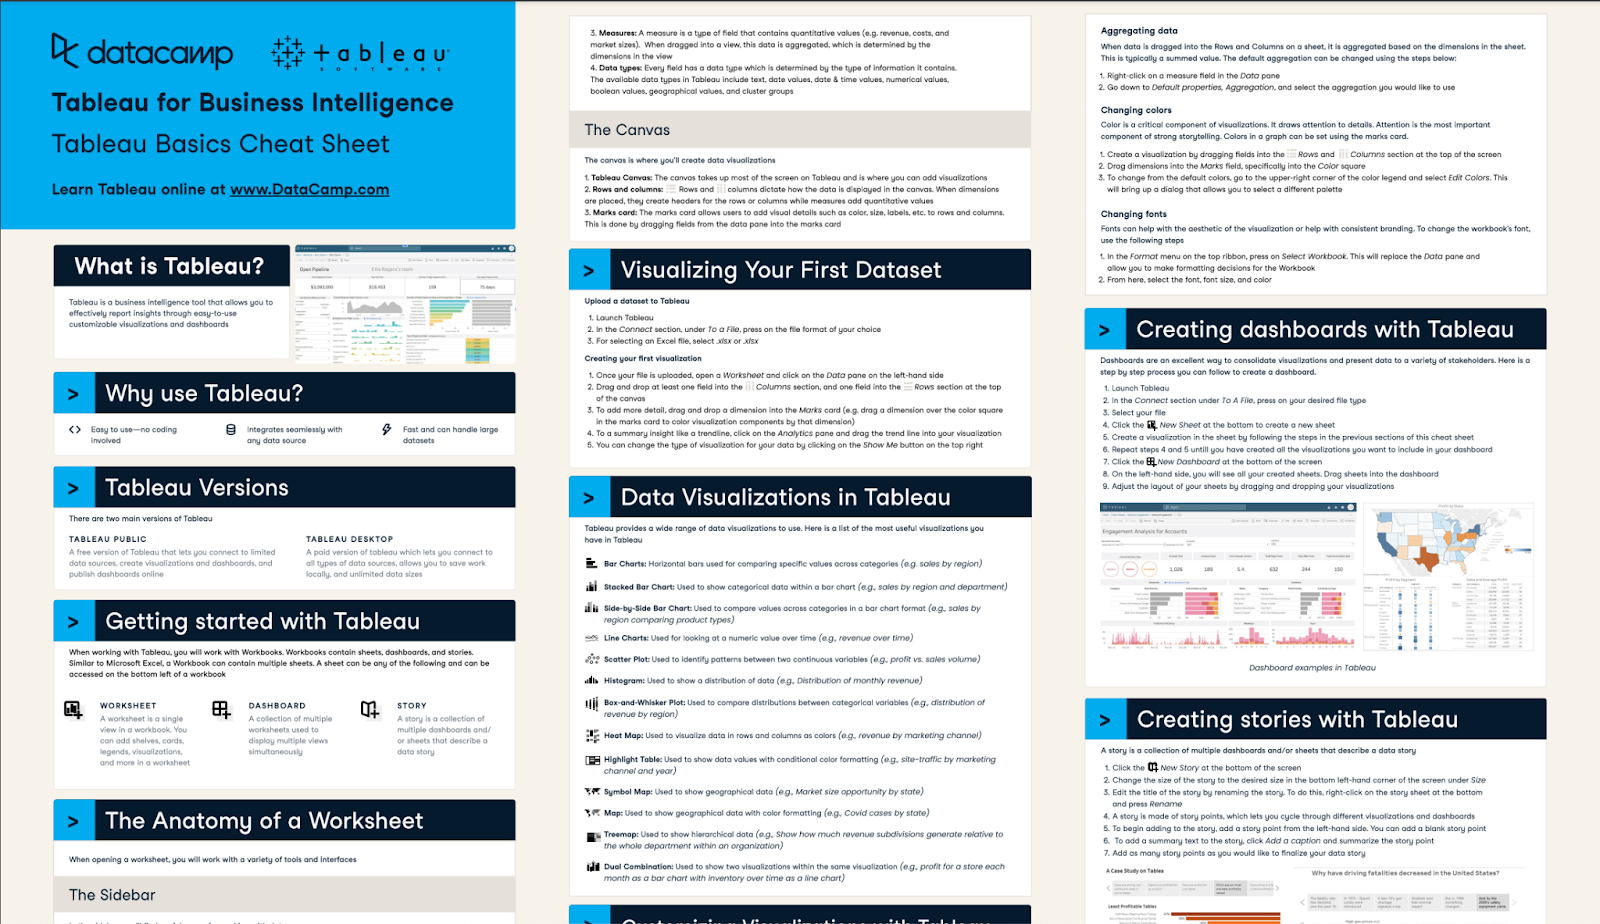
Our Tableau Cheat Sheet shows the uses of the tool for business analytics
When it comes to data governance and enterprise-scale data, Looker takes the win. LookML’s unified layer is central to its governance model. This approach ensures that users are working with a consistent set of definitions, calculations, and findings to enhance data accuracy.
Its code-first approach, as well as its permission and access controls, ensure the correct management of data access, maintaining security and compliance. Looker can effectively scale depending on an organization's needs by integrating modern data warehouses and supporting real-time analysis.
On the other hand, Tableau is well known for its flexibility and user-friendly interface. Users can perform ad-hoc analysis, tailored insights, and use features such as calculated fields for specific business needs. As we already know, Tableau’s power lies in its ability to ensure all users at all levels can use the platform comfortably.
However, with this being said, this flexibility for the users also presents a challenge in governance.
User-created calculated fields and analyses can lead to inconsistencies shared amongst the organization. Looker's centralized business logic approach in LookML has better management in comparison to Tableau, which requires careful management and other practices to ensure that ad-hoc analysis does not affect data consistency and accuracy.
Collaboration and usability are two aspects that ensure the successful utilization of BI tools, such as enhanced decision-making, improved productivity, and more.
One of Looker’s main collaboration features is its robust version control system, rooted in its code-first environment in LookML. Changes made in data models and dashboards are tracked and reviewed and can also be reverted. This offers a collaborative environment for team members to contribute, review, and overwrite other members' works.
Looker is also integrated with Google Workspace, which enhances the overall collaborative process. Users can work with familiar tools such as Google Sheets to analyze and visualize data. Team members can collaborate more effectively and share insights on their preferred platform.
On the other hand, Tableau’s user-friendly interface, along with its sharing capabilities, makes its collaboration features more engaging for non-technical users. Dashboards are interactive and have been specifically designed for it to be easily shareable and understandable. Users can comment on dashboards, add them to web pages, and share them on social media.
Looker’s code-first approach offers precision and control. However, this code-centric approach is primarily beneficial for users with a technical background and presents a steeper learning curve. This may not be beneficial for every organization that requires all business users to interact with their BI tool.
On the other hand, Tableau’s drag-and-drop interface and ability to create visualizations and dashboards without needing a technical background is more enticing. Users can clean and prepare code for the analysis without writing any code. This provides Tableau with the upper hand for organizations that are seeking impactful insights without technical knowledge.
If you’re intrigued about how to learn Tableau, check out our separate guide that gives you all the steps and resources you need to get started.
|
Looker |
Tableau |
|
|
Native Support |
Google Products |
Salesforce Products |
|
Native Language |
LookLM |
VizQL |
|
Number of supported data sources |
800+ |
100+ |
|
Data preparation and integration |
Precision and control. Integrates with a variety of data sources |
Prepare data with Tableau prep Extensive data source connectivity |
|
Data Modelling |
Code-first approach with LookML |
Drag-and-drop feature for visual and intuitive ease |
|
Visualization Capabilities |
Emphasis on data accuracy and consistency |
Emphasis on visuals and data storytelling |
|
Analytics |
Focus on precision, SQL-based analysis, and custom metrics |
Extension analytical approach and flexibility with calculated fields and ad-hoc analysis |
|
Governance |
Centralized data management with LookML |
Requires extra measures to ensure ad-hoc analysis does not affect data consistency and accuracy |
|
Collaboration |
Version control and integrated with Google Workspace |
Interactive dashboards that can be shared in a variety of way |
|
Learning Curve |
Steeper learning curve due to the technical nature of LookML |
Low learning curve as it’s specifically designed for all levels |
When choosing the right BI tool for your organization and data analytics needs, there are several factors that you need to take into consideration:
These key factors will act as your non-negotiables when choosing the right tools.
With this being said, I will recommend:
It can be difficult to really determine the capabilities of a tool if you haven’t been able to test it out. If you want to know what Tableau is all about without paying for it, have a look at our Tableau Fundamentals track, which covers everything you need to know.
Learn Tableau Today!
Track
Course
Course
Joleen Bothma
10 min
Adel Nehme
15 min
DataCamp Team
3 min
Austin Chia
11 min
Austin Chia
Austin Chia