Master Tableau From Scratch
Accelerate your career with Tableau—no experience required.
Tableau Projects for Beginners
In this section, we’ve included various case studies in starting you on your journey of managing an end-to-end dashboard development and analysis process. These beginner projects will enable you to put your fundamental Tableau skills into practice.
If you need a refresher, check out our Tableau tutorial to get up to speed with the essentials.
Analyzing Customer Churn
In the Analyzing Customer Churn in Tableau case study, you will use your analytics hat to uncover insights on customer churn for a fictional telecoms company called Databel. Reducing customer churn is their top priority, so you’ll start by first understanding what churn is and how much churn the organization is seeing. But you’ll take it a step further by figuring out why customers are churning and providing recommendations on reducing churn.
In this project, you will:
- Create calculated fields for further analysis
- Visualize various dimensions and measures of churn
- Combine visualizations to create an eye-catching dashboard
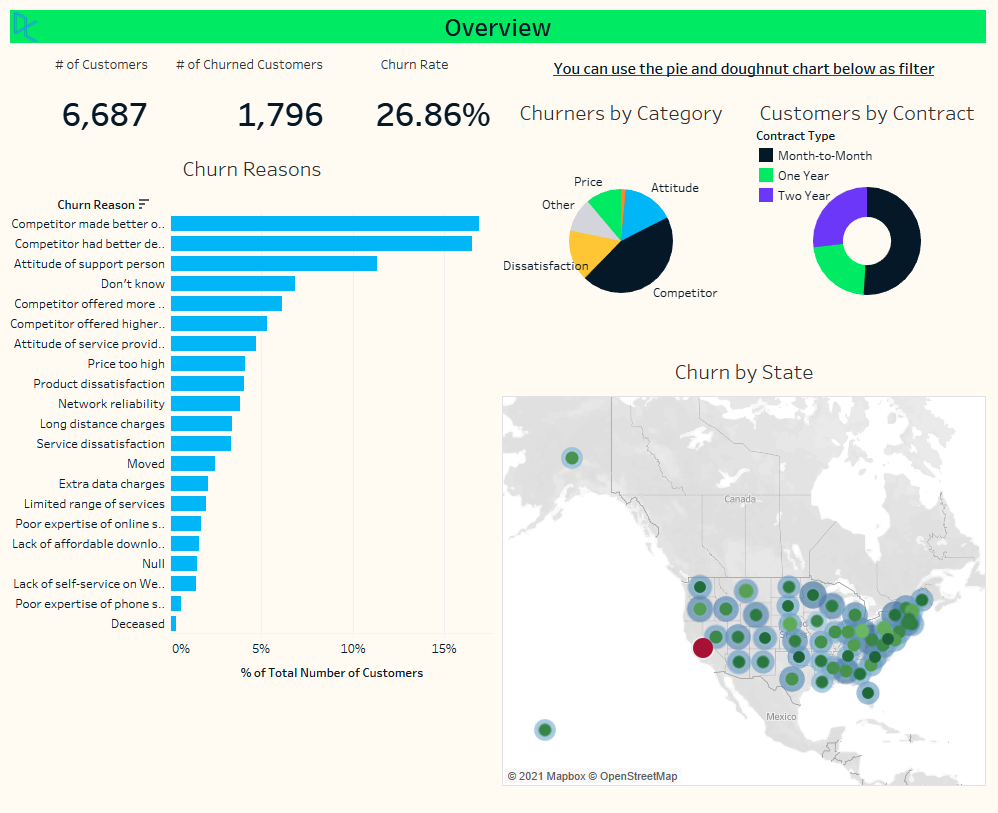
Here is an example of an overview page you might create whilst taking this Tableau project. Don’t be afraid to inject your creativity when building your own dashboards! You can check out our tutorial on creating Tableau dashboards for more inspiration.
Analyzing Job Marketing Data
In the Analyzing Job Market Data in Tableau case study, you will explore a real-world job posting dataset to uncover insights for a fictitious recruitment company, DataSearch. You’ll start by preparing the data and carrying out an initial exploratory analysis of the data before diving deeper into the most in-demand skills for data scientists, analysts, and engineers.
In this case study, you will:
- Use calculated fields for data manipulation and analysis
- Create dashboard-ready KPI visuals
- Combine visualizations to create an eye-catching dashboard
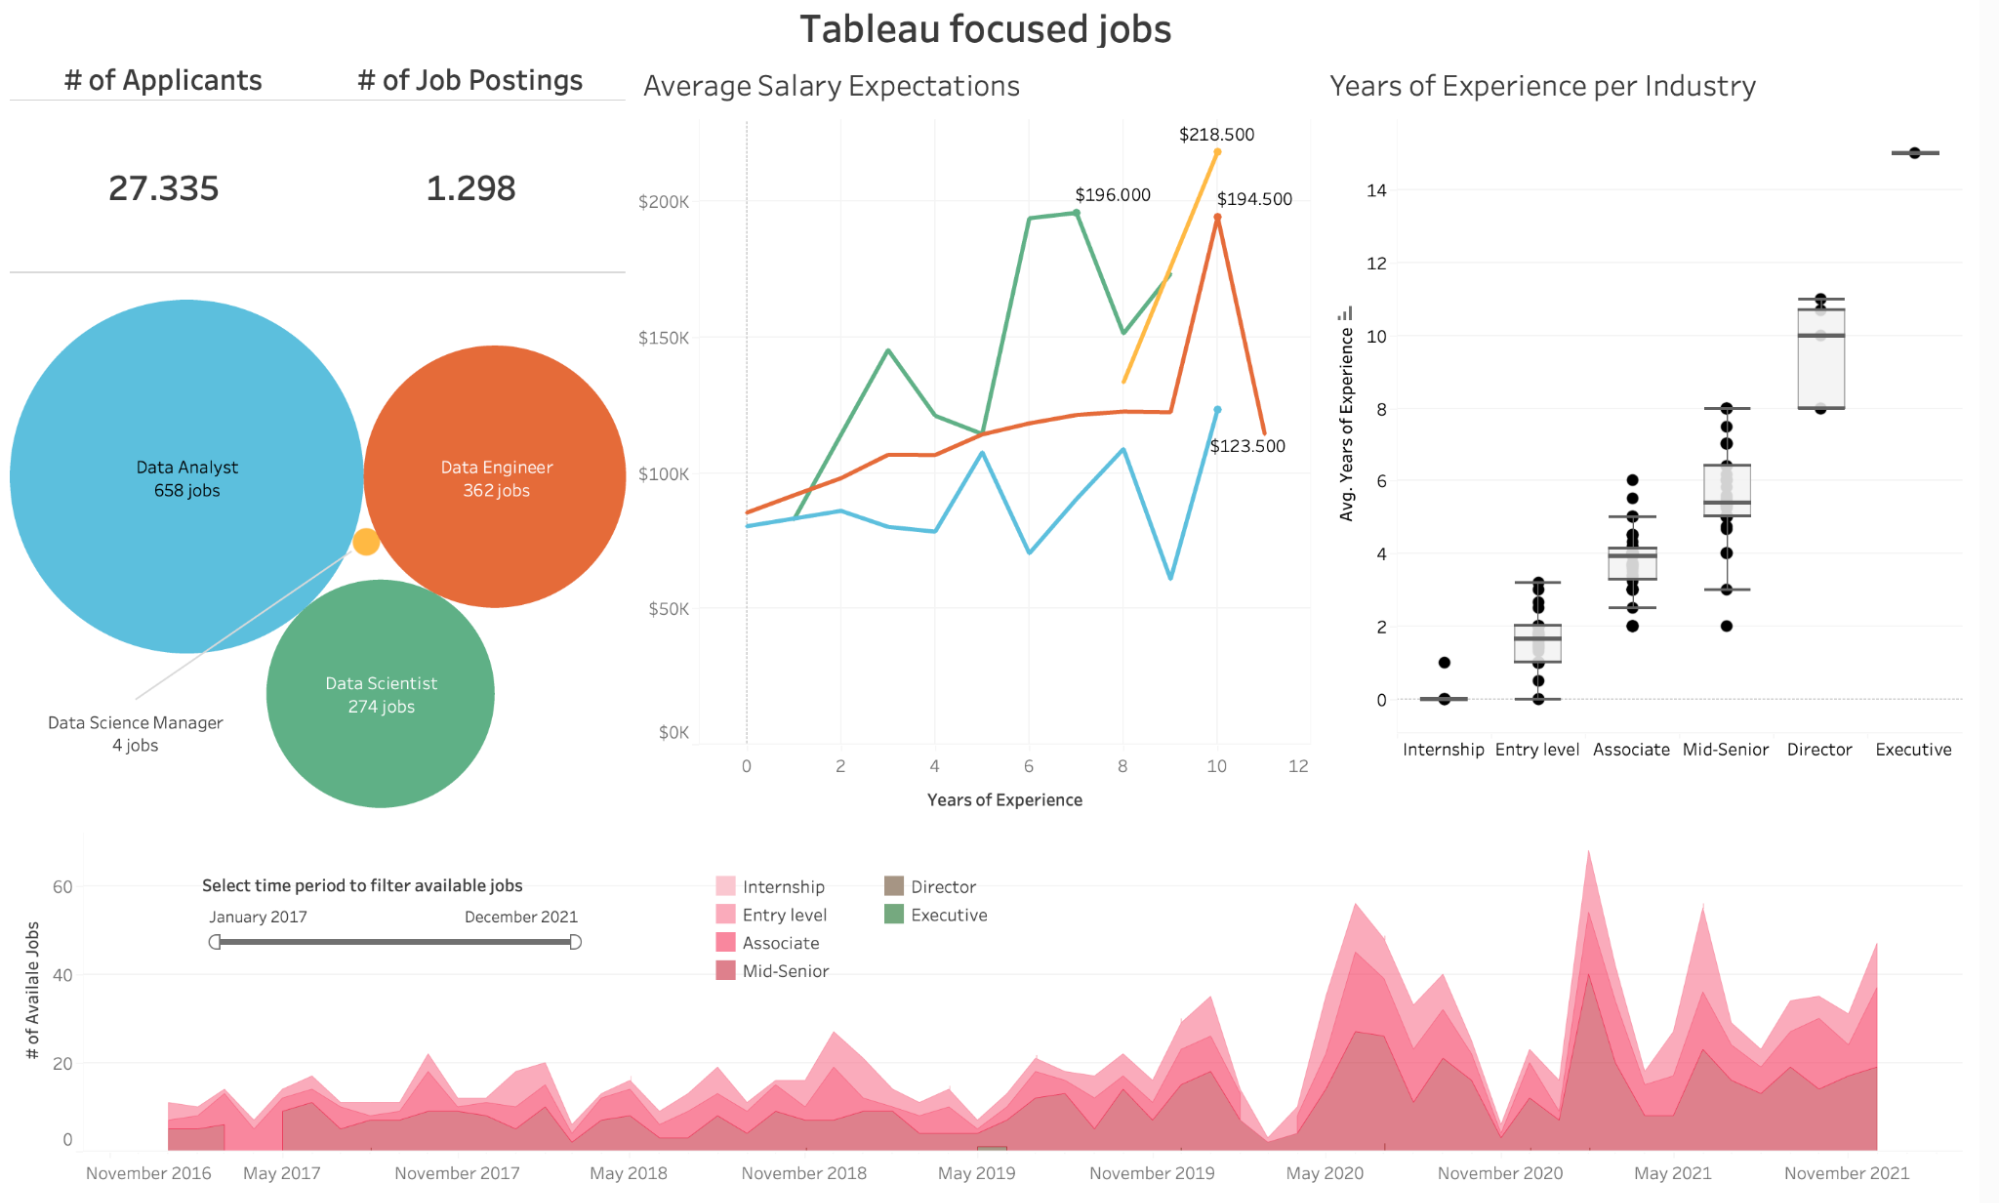
Above is an example of a page you might create whilst taking this case study.
HR Analytics
In the HR Analytics in Tableau case study, you’ll explore HR data for a fictitious software company called Atlas Labs. The primary goal is to summarize information on key employee metrics, as well as dive deeper into areas such as employee performance and attrition. This will involve understanding factors contributing to attrition and identifying appropriate actions to enhance employee retention.
In this project, you will:
- Create relationships between more than one table
- Create calculated fields to dive deeper into attrition
- Build a dashboard ready for distribution
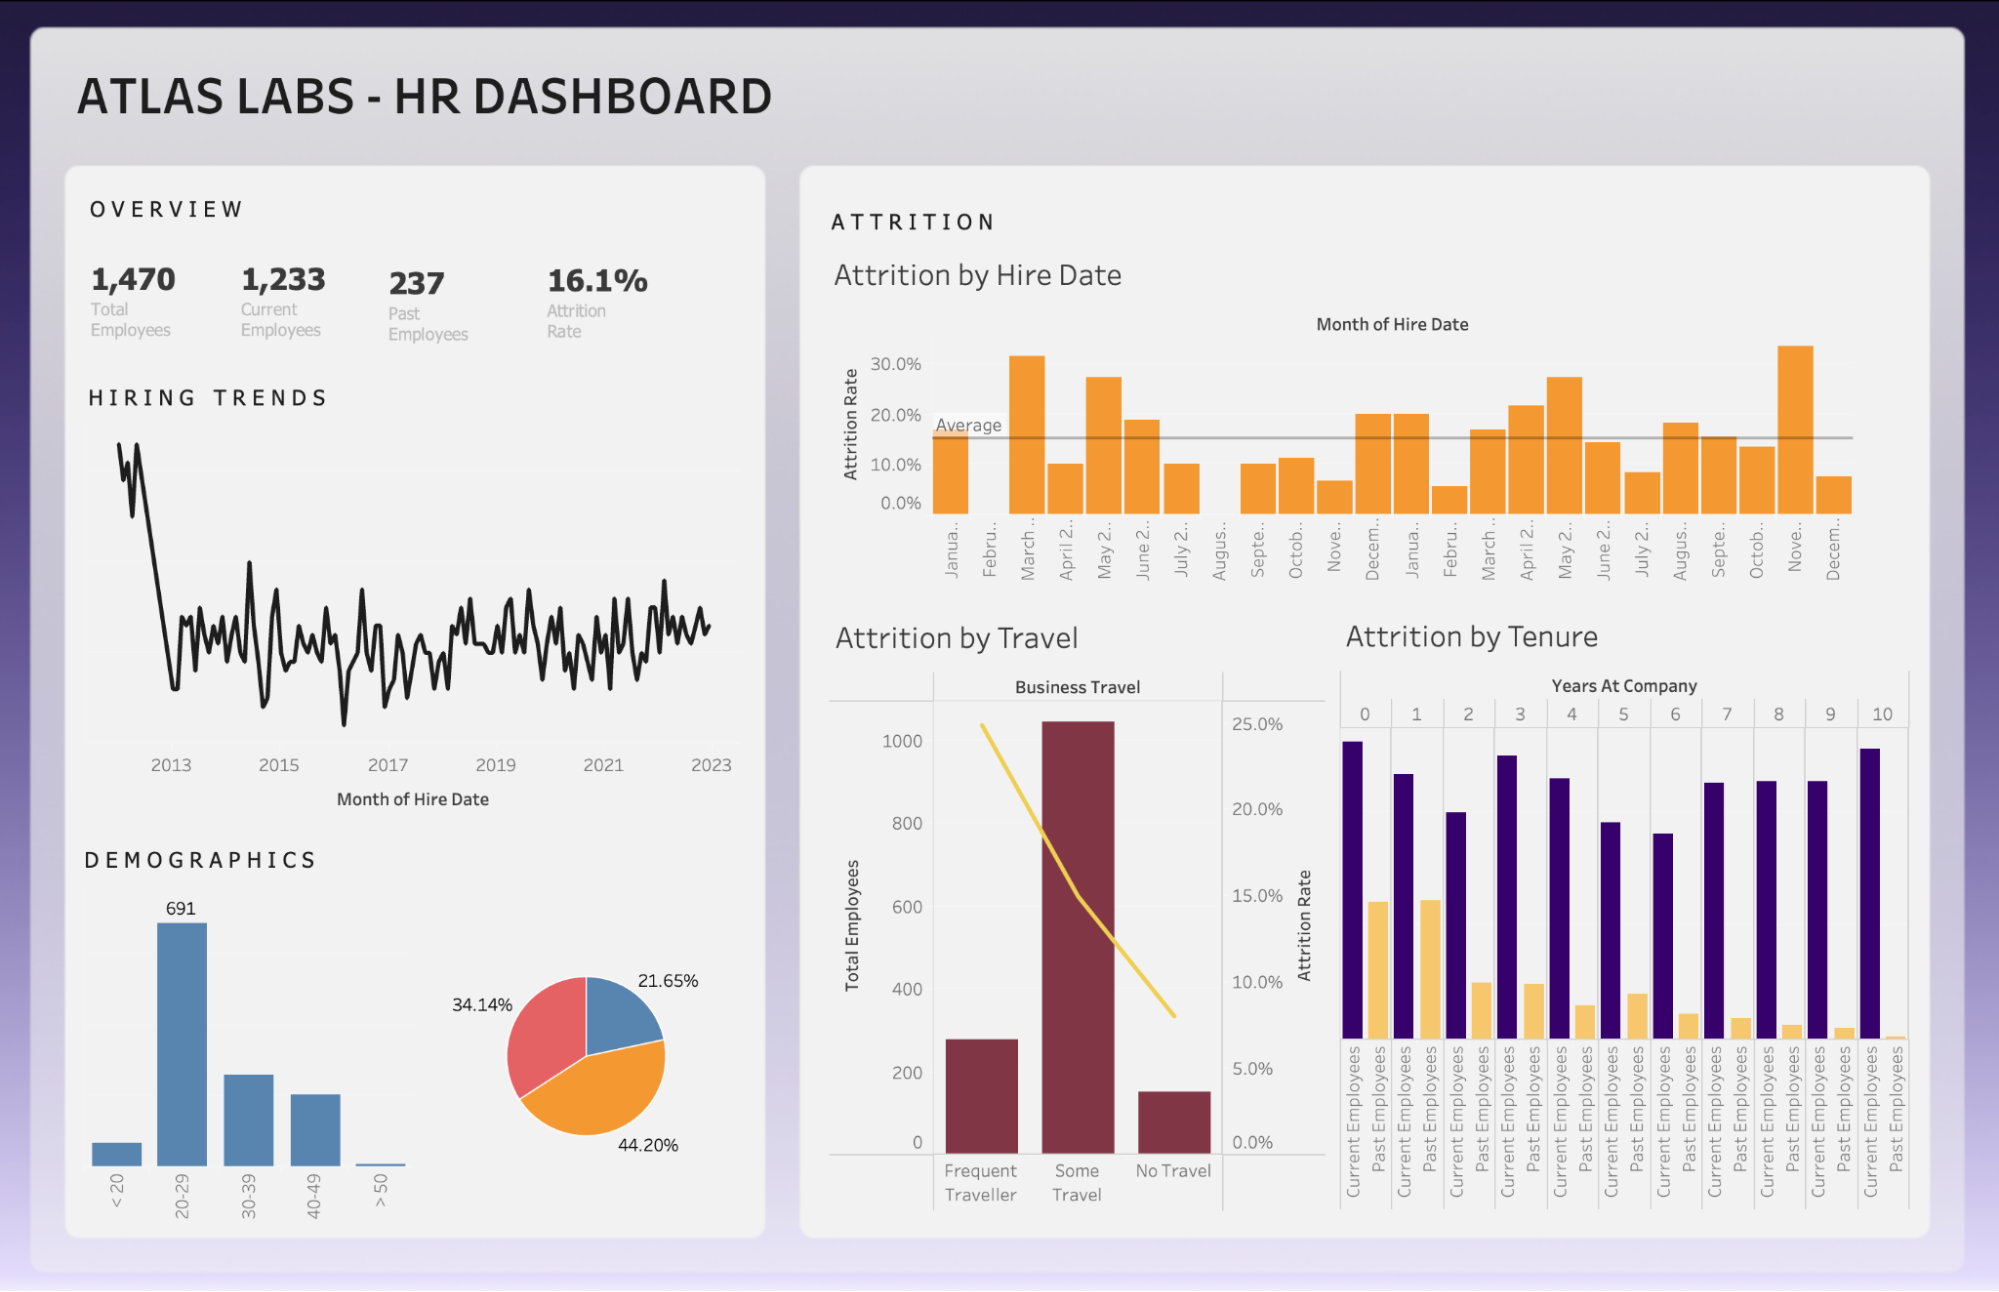
As you work through this beginner Tableau project, you may end up creating a dashboard like the one above.
Tableau Projects for Intermediate Learners
In this section, we’ve included various case studies in starting you on your journey of managing an end-to-end dashboard development and analysis process. These intermediate projects will further push the realms of detailed industry knowledge and Tableau skills.
Inventory Analysis
In this Inventory Analysis in Tableau case study, you’ll put your skills to the test with a real-world challenge based on a fictional retailer WarmeHands Inc. The primary goal of this case study is to identify potential improvements in inventory management and purchasing strategies. You’ll investigate inventory turnover and ABC analysis, then identify which products should be prioritized.
In this case study, you will:
- Prepare your data ready for analysis
- Create calculated fields to explore inventory management and ABC analysis
- Build extensive visualizations for deeper insights
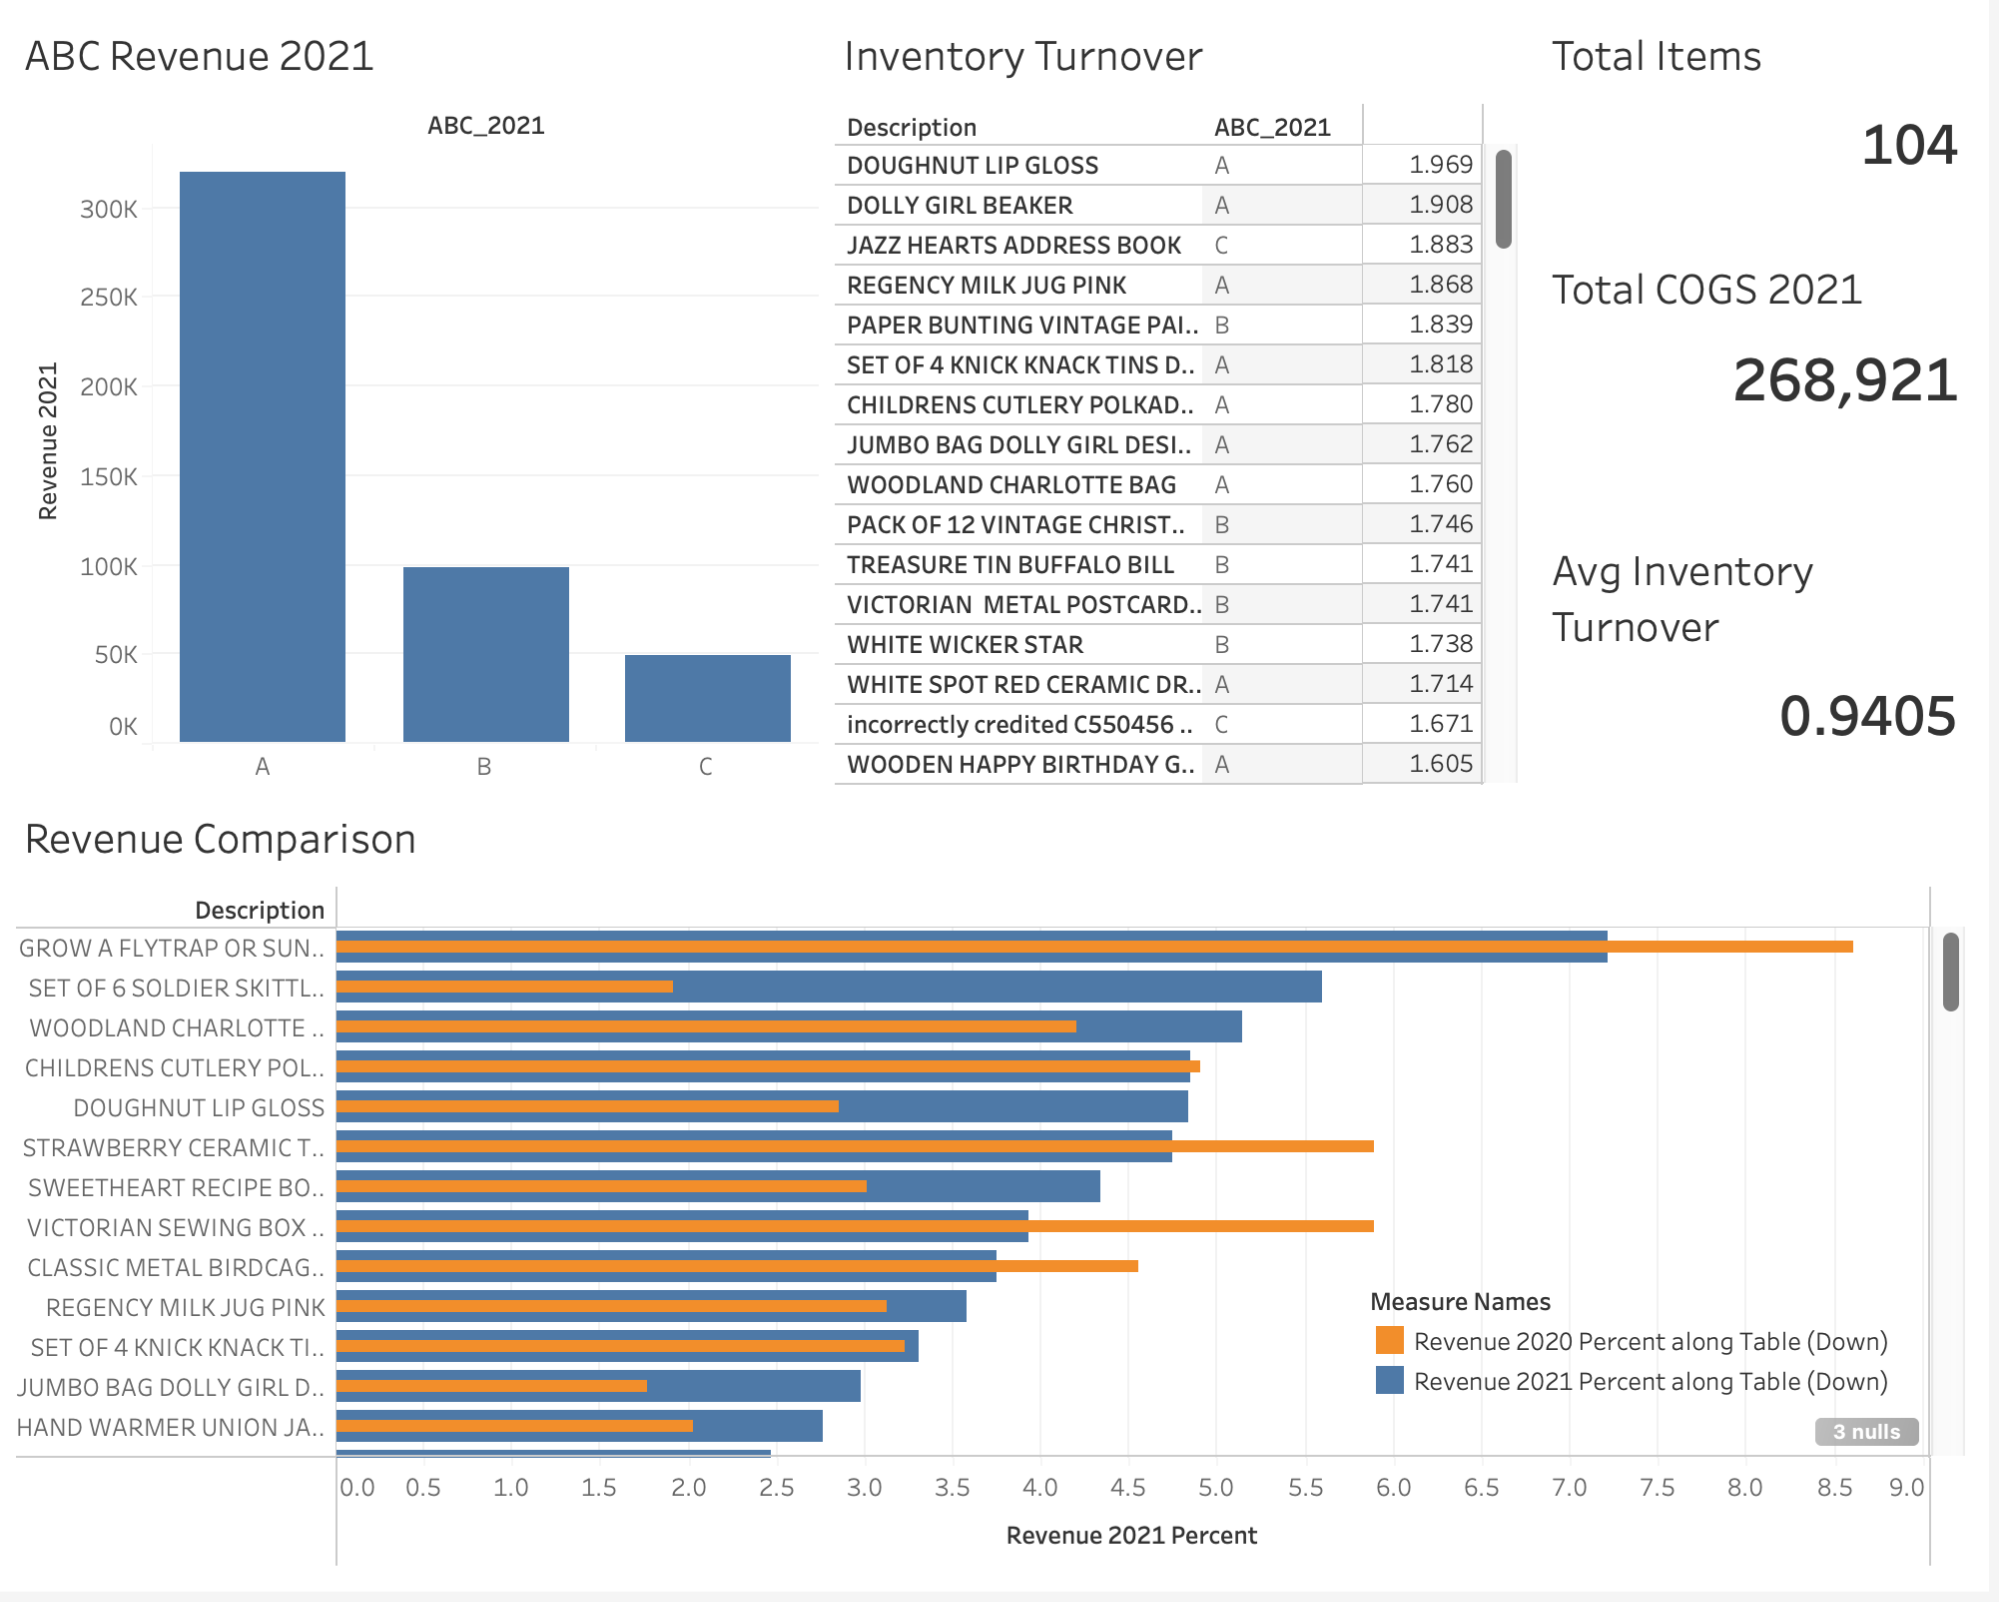
Here is an example of a page you might create whilst taking this case study. If you want to learn more about extending Tableau’s data visualization capabilities, check out our tutorial, Visualizing Data with Python and Tableau.
Supply Chain Analytics
In this Supply Chain Analytics in Tableau case study, you’ll be an Analyst diving into a number of rich datasets, including order and shipment information, inventory files containing details on stock and storage, and a fulfillment field to give us deeper insight into stock refills. You’ll develop a final dashboard to share with stakeholders looking to dive deeper into Supply Chain management.
In this project, you will:
- Prepare a data model ready for analysis
- Create calculated fields to dive deeper into inventory management
- Build an interactive dashboard
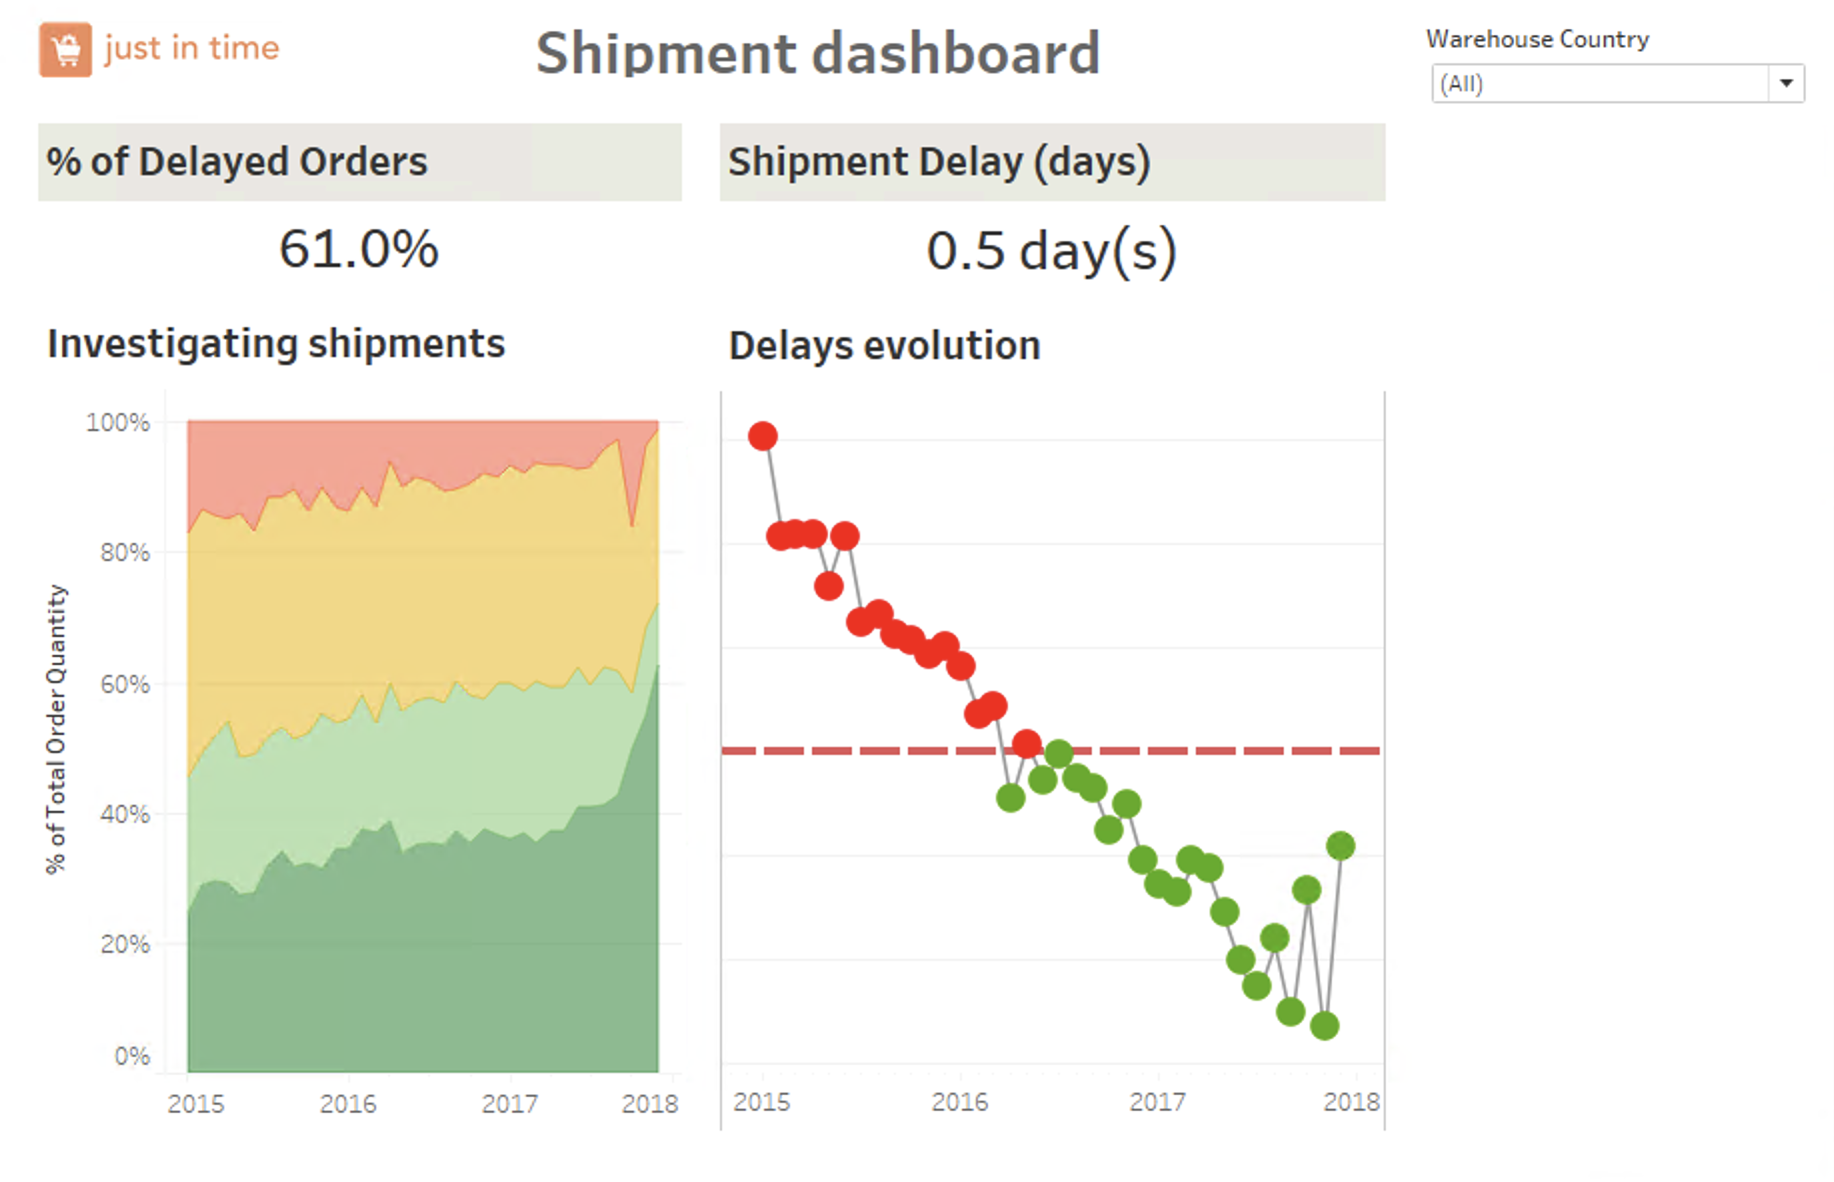
Here is an example of a page you might create whilst taking this intermediate Tableau project.
eCommerce Analysis
In this eCommerce Analytics in Tableau case study, you’ll be exploring data for a fictitious online pet supply company called Munchy’s. The primary goal will be to investigate how Munchy’s can increase sales and reduce expenses. You’ll analyze the dataset to see which products are frequently bought together and in what quantity. This will enable you to make upsell and cross-sell recommendations as part of a market basket analysis.
In this case study, you will:
- Create calculated fields to dive deeper into sales analysis
- Create dual-axis graphs, highlight tables and maps
- Apply filters and parameters to make visualizations more dynamic
- Combine all the visualizations into a story ready to be shared
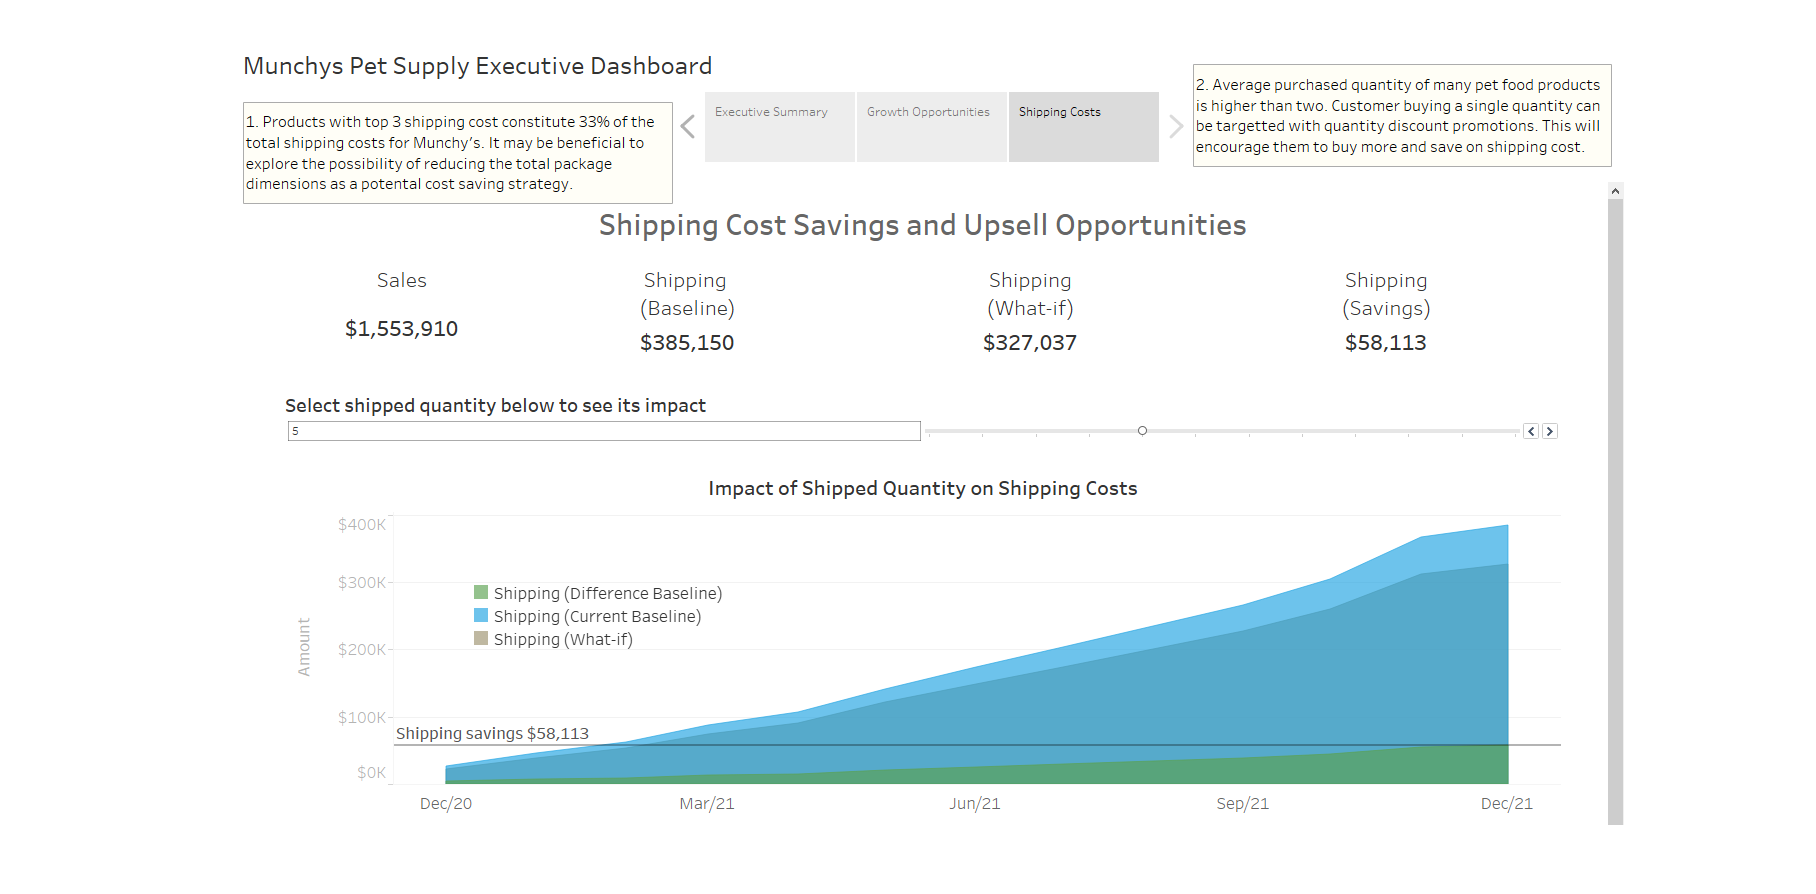
Here is an example of a page you might create whilst taking this case study.
Conclusion
After learning the essentials, these case studies give you the foundation to build a strong portfolio to help showcase your skills.
In this post, we have learned about beginner and intermediate projects that cover topics from data modeling, data transformation to visualization and storytelling.
So, what’s next? Now that you’ve followed a guided approach to projects - try experimenting with more complex datasets and see what insights you can derive! Make sure your skills are up-to-date by checking out tutorials like Creating Stories in Tableau and Using Tableau Logical Functions.