HomeBlogBusiness Intelligence

The Top 6 Business Intelligence Tools For 2024 You Need to Know

Discover how business intelligence is essential for business success and the top BI tools that make it possible.
Updated Nov 2023  · 12 min read

Business intelligence (BI) is a crucial pillar of success for organizations in almost every industry. The ability to extract valuable insights from data has never been more pivotal, and BI tools make this possible.

As the prevalence of big data continues to rise, businesses are increasingly aware of the need to harness its potential. The wealth of information at their disposal demands effective data management and analysis. This surge in data’s ubiquity and complexity has led to a corresponding surge in the adoption of business intelligence tools.

The sheer volume of available BI tools can be both empowering and overwhelming. To help you navigate this landscape, this article introduces and explains some of the best business intelligence tools available today with an emphasis on their suitability for beginners.

Understanding Business Intelligence Tools

Before we get to our list of the best BI tools, let’s first explore what they are and why they’re important to organizations of all sizes.

What are business intelligence tools?

Business Intelligence (BI) tools are a diverse set of software applications, platforms, and solutions designed to extract, transform, and present data to support data analysis, trend identification, and strategic decision-making within an organization. These tools enable you to transform raw data into valuable insights, leading to improved decision-making, optimized operations, and the ability to stay competitive in today’s data-centric markets.

That may already sound impressive, but you might wonder how BI tools can do all this. We can answer this by going over the four core capabilities of BI tools:

  1. Data integration: BI tools can connect to and consolidate data from multiple different sources, such as databases, spreadsheets, and cloud-based applications.
  2. Data transformation: since data can come in many different formats, this aspect of BI tools is crucial for improving the compatibility and usability of the data. Users can transform data by cleaning, structuring, and aggregating it.
  3. Data visualization: the bread-and-butter of business intelligence is its ability to represent large and often complex datasets visually to deliver insights and make trends and patterns more evident.
  4. Reporting: the final presentation of data in a BI tool is in the form of a report or dashboard that can be delivered to key stakeholders automatically.

Why are BI tools essential for your business?

These tools play a pivotal role in harnessing the potential of data and driving success, but the question is how and why you should care.

Let’s go over some of the ways that BI tools can benefit your business.

  1. Single source of truth: the ability to consolidate data from various sources creates a single source of truth, allowing for a centralized, comprehensive view of the organization’s operations (if you’ve ever gotten into an argument about whose numbers are more accurate, you’ll know why this is such a big deal).
  2. Trend analysis: By visualizing current and historical data, BI tools enable you to identify patterns and trends, which helps you understand market dynamics, customer behavior, and the impact of business strategies.
  3. Data-driven decisions: The ability to make data-driven decisions is one of the most significant advantages of BI tools. By providing actionable insights, these tools empower businesses to optimize operations, identify growth opportunities, and mitigate risks without relying on gut instinct alone.
  4. Efficiency and productivity: With automated reporting and data visualization, BI tools reduce manual data handling. This efficiency increases productivity and allows employees to focus on strategic tasks.
  5. Issue resolution: BI tools can highlight potential issues or bottlenecks within an organization. By identifying areas of concern, businesses can take corrective actions to improve processes and performance.

The most significant potential of business intelligence occurs when organizations integrate it with data science. With programming languages like Python, R, or SQL, analysts can generate and automatically distribute reports on key business metrics.

However, this can be quite a complex and often manual process unless you use a platform like DataLab to efficiently and effectively leverage these programming languages to produce automatic reports that combine the power of data science with the visualization capabilities of business intelligence tools.

Top Business Intelligence Tools for Beginners

1. Microsoft Power BI

Power BI is a powerful BI tool that offers both a desktop application (which is free) and a cloud-based platform for sharing reports and dashboards. Power BI is a full-featured tool with the ability to transform and visualize your data, along with some impressive predictive modeling and AI-based features that make this tool a true leader in the BI market.

Power BI is particularly ideal for beginners who are familiar with Microsoft products, providing a seamless transition into the world of BI. Get up to speed quickly with this Introduction to Power BI course by DataCamp. If you wish to take your Power BI skills to the next level, consider taking the Power BI Fundamentals skill track.

Power BI has two pricing options: a Pro subscription paid per user or a Premium plan per user or per capacity if you require access to advanced enterprise-scale features.

Key features:

  • Data connectors and integrations for a wide range of data sources.
  • User-friendly interface with a drag-and-drop report builder and powerful data visualization capabilities.
  • Natural language query for data exploration.
  • Web-based nature - Power BI reports can be published to the web and easily shared with others. In addition, reports can even be designed directly from Power BI Service on the web with direct integration with some applications.

Power BI also can integrate with Python, bringing the power of data science directly into your Power BI reports. Learn how to do this with DataCamp’s Introduction to Python in Power BI course.

Check out our blog post to learn all about Power BI.

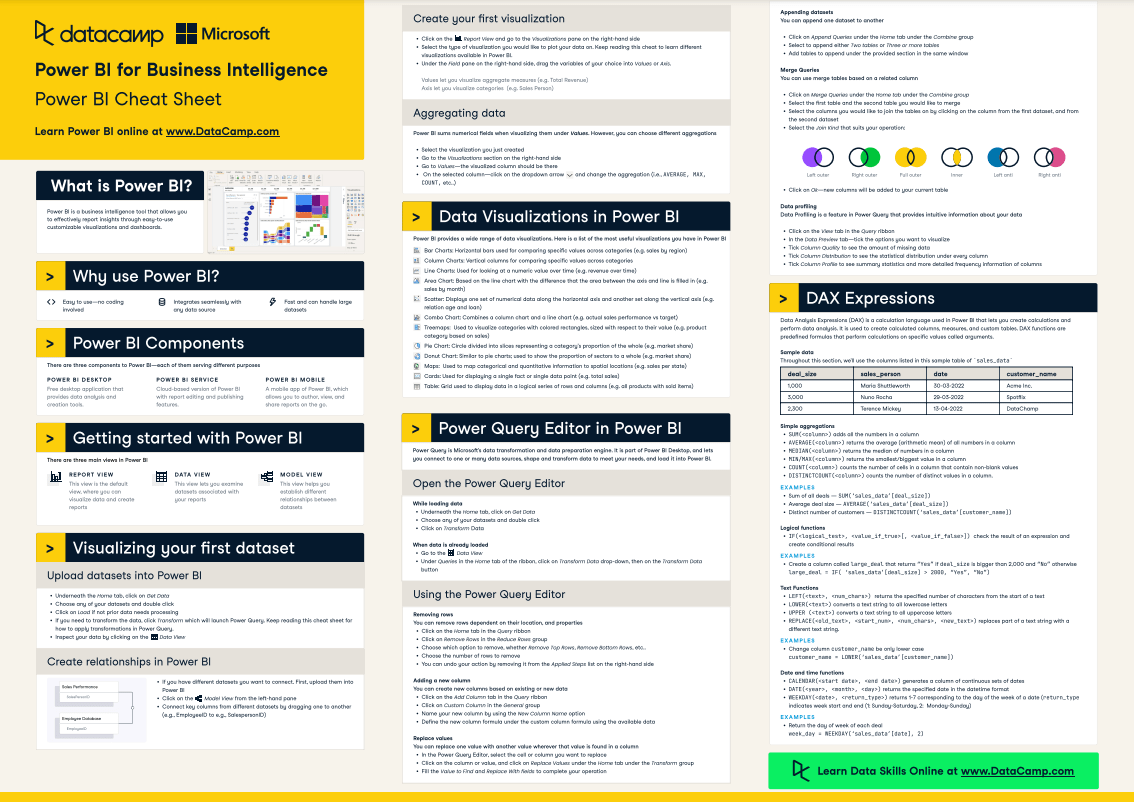
Our Power BI Cheat Sheet can help you master this top business intelligence tool

2. Tableau

Tableau is another leading BI tool with a strong emphasis on usability, particularly for non-technical users. Tableau can integrate with dozens of applications easily through the use of their pre-built data connectors, along with advanced data discovery and visualization capabilities.

However, a unique aspect of Tabelau is their Tableau Public offering, which is freely available to anyone, from complete beginners to seasoned experts, to learn more about Tableau and improve their analytical and BI skills. The Introduction to Tableau course by DataCamp is a great place to start learning about Tableau. If you want a more in-depth walkthrough of Tableau, then the Tableau Fundamentals skill track is an excellent place to start.

Tableau has a subscription-based pricing structure split into three levels, making it an affordable option even for small teams.

Key features:

  • Wide range of data connectors for almost every kind of data source.
  • Interactive, dynamic dashboards that users can either develop and automate or throw together quick ad-hoc analyses of their data.
  • Real-time data integration that allows users to visualize and analyze live data.

Check out our blog post to learn all about Tableau.

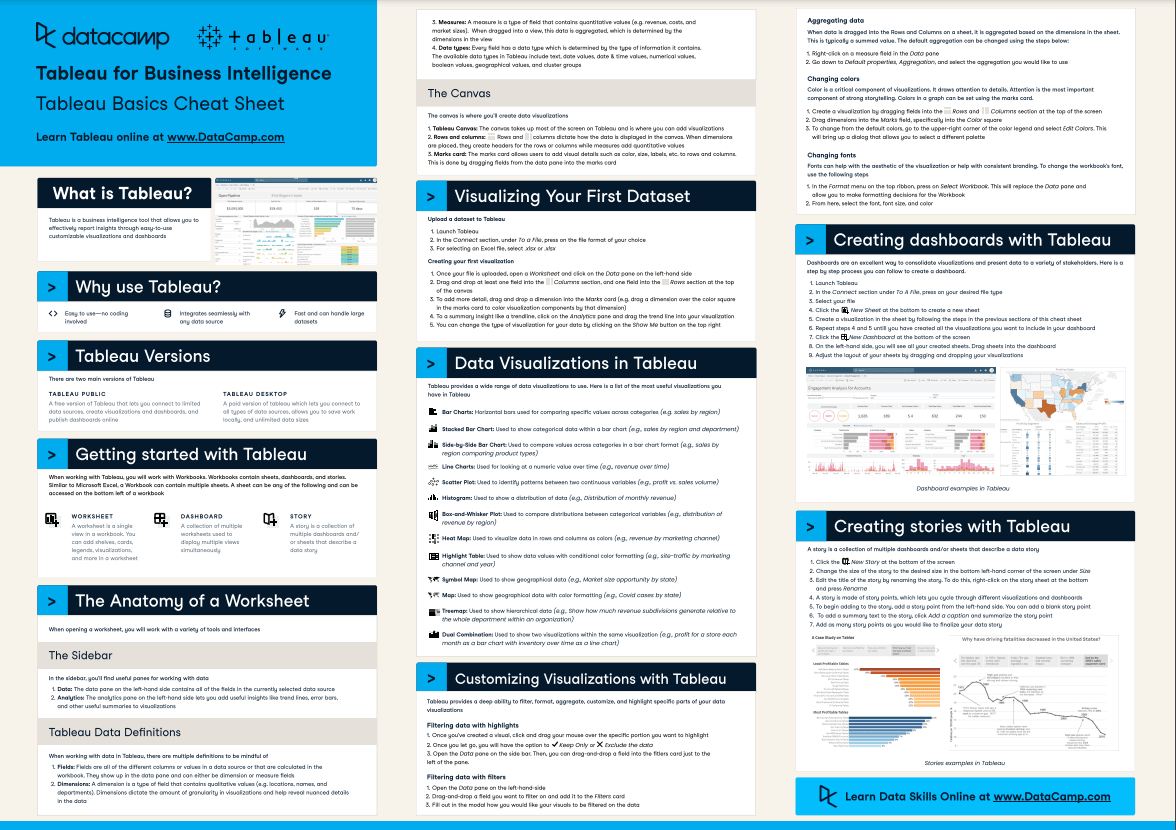
Check out our Tableau Cheat Sheet to learn more about this useful tool

3. Looker Studio (Formerly Google Data Studio)

Looker Studio is a free tool (with the option to upgrade to the Looker Studio Pro plan) for creating customized, interactive reports and dashboards that integrate with various data sources.

With a focus on simplicity and speed, Looker Studio allows even complete beginners to harness the power of Google’s ecosystem to create data visualizations and reports, making data accessible and understandable.

Key features:

  • Direct integration with Google Analytics, Google Sheets, and other Google services.
  • Drag-and-drop report builder with real-time collaboration.
  • Easy sharing and embedding of reports.

4. Domo

Domo is an entirely cloud-based BI platform offering easy-to-use data visualization and reporting capabilities. Domo is also particularly great for beginners thanks to its user-friendly and intuitive interface, pre-built connectors, and the simplest ETL solution out of all BI tools.

Domo offers a limited free version to learn more about the tool and try it out. After that, they offer three pricing tiers depending on your requirements. Domo has based its pricing structure on credits rather than users. You can have an unlimited number of users but will need to purchase more credits if your usage causes them to run out.

Key features:

  • Over 1,000 pre-built connectors for various data sources.
  • Magic ETL makes data transformation and cleaning a breeze even without extensive technical expertise.
  • Advanced embedded analytics with the goal of having “Domo Everywhere.”

5. Zoho Analytics

Zoho Analytics is a user-friendly BI tool that is highly affordable, making it especially attractive for small businesses and beginners. However, Zoho Analytics does not compromise on functionality to keep costs low. You can expect many of the same impressive data preparation and visualization features as the other BI tools on this list.

Zoho Analytics offers four pricing tiers depending on the number of users you have and the volume of data you want to import into the platform. If your organization has large volumes of data or many users, Zoho Analytics can provide a more tailored plan to you with the option for dedicated servers.

Key features:

  • Zoho DataPrep offers self-service data preparation and management.
  • Pre-built dashboards and widgets.
  • Integration with over 250 data sources and direct connection to more than 50 popular data apps.
  • ‘Ask Zia’ is their natural language query feature that lets users ask questions about their data in plain English and receive visualized answers.

6. Sisense

Sisense is known for its powerful and incredibly fast data analysis capabilities due to its unique data architecture that combines data preparation, data modeling, and data visualization into a single, unified platform. However, the power and sophistication of the platform should not deter beginners, as Sisense has taken great care in designing a no-code user experience with an excellent drag-and-drop dashboard builder.

Sisense offers self-hosted and cloud-based pricing options tailored to your needs.

Key features:

  • Single-stack architecture for data preparation and analysis.
  • Sisense’s in-chip data engine is designed for high-speed data processing and can handle large datasets with ease.
  • An intuitive drag-and-drop dashboard builder that makes it accessible to a broader range of users.
  • AI and machine-learning integration for advanced analytical capabilities.

Criteria for Choosing a Business Intelligence Tool

Now that you have an idea of some of the best business intelligence tools available, it’s time to look at the considerations you need to make when choosing the right one for your organization. Here are some factors to think about:

Ease of use

An essential pre-requisite for a BI tool to make this list is that it must be easy to use for both skilled data analysts as well as non-technical members of a team.

Gone are the days when data was only available to those with the technical expertise to access and analyze it. Instead, BI tools facilitate data democratization, empowering everyone in the organization to analyze data and make decisions or take action based on data insights.

DataCamp has an excellent article explaining data democratization and strategies and tools for successful data democratization.

Integration capabilities

Data silos are notoriously difficult to address when first introducing analytics in an organization. BI tools should overcome this by integrating and consolidating data from various sources. As previously mentioned, this consolidation creates a single source of truth for all data in the organization. Not only will this improve collaboration between business units and thus improve the ability to generate data insights, but it will also cultivate a data culture that drives success and growth in an organization.

Pricing and scalability

As businesses grow, their data needs evolve. BI tools should be designed to scale with the organization. They must handle increasing data volumes, additional data sources, and more complex analyses.

Furthermore, the pricing structure of BI tools can vary from offering per-user subscription plans to on-premise deployment solutions. When it comes to pricing, it’s important to consider the number of users you currently have or intend to onboard onto the platform, as well as your infrastructure capabilities. Don’t forget to factor in the potential for growth in the future and how this may impact your choice of tool and which pricing model best suits you.

Conclusion

In summary, choosing the right BI tool is pivotal for your organization’s data-driven success. These tools consolidate data, facilitate trend analysis, and empower informed decision-making. Try some of the tools we mentioned in this article and choose the tool that aligns best with your business objectives and fits in with the size and budget of your organization.

Embrace continuous learning to stay ahead in the evolving BI landscape with DataCamp courses.

If you’re interested in building a career as a BI analyst or data analyst in either Power BI or Tableau, then DataCamp has two career tracks containing more than 25 courses combined that will teach you everything you need to know to succeed:


Photo of Joleen Bothma
Author
Joleen Bothma
Topics

Start Your Data Analysis Journey Today!

Course

Analyzing Data in Tableau

8 hr
47.4K
Take your Tableau skills up a notch with advanced analytics and visualizations.
See DetailsRight Arrow
Start Course
See MoreRight Arrow
Related

A Complete Guide to Alteryx Certifications

Advance your career with our Alteryx certification guide. Learn key strategies, tips, and resources to excel in data science.
Matt Crabtree's photo

Matt Crabtree

9 min

Top 5 Business Intelligence Courses to Take on DataCamp

Find out about the courses DataCamp offers for business intelligence, equipping you with the skills necessary to thrive in any data-driven role!
DataCamp Team's photo

DataCamp Team

3 min

Scaling Enterprise Analytics with Libby Duane Adams, Chief Advocacy Officer and Co-Founder of Alteryx

RIchie and Libby explore the differences between analytics and business intelligence, generative AI and its implications in analytics, the role of data quality and governance, Alteryx’s AI platform, data skills as a workplace necessity, and more. 
Richie Cotton's photo

Richie Cotton

43 min

[Radar Recap] Building a Learning Culture for Analytics Functions, with Russell Johnson, Denisse Groenendaal-Lopez and Mark Stern

In the session, Russell Johnson, Chief Data Scientist at Marks & Spencer, Denisse Groenendaal-Lopez, Learning & Development Business Partner at Booking Group, and Mark Stern, VP of Business Intelligence & Analytics at BetMGM will address the importance of fostering a learning environment for driving success with analytics.
Adel Nehme's photo

Adel Nehme

41 min

[Radar Recap] From Data Governance to Data Discoverability: Building Trust in Data Within Your Organization with Esther Munyi, Amy Grace, Stefaan Verhulst and Malarvizhi Veerappan

Esther Munyi, Amy Grace, Stefaan Verhulst and Malarvizhi Veerappan focus on strategies for improving data quality, fostering a culture of trust around data, and balancing robust governance with the need for accessible, high-quality data.
Richie Cotton's photo

Richie Cotton

39 min

[Radar Recap] Scaling Data ROI: Driving Analytics Adoption Within Your Organization with Laura Gent Felker, Omar Khawaja and Tiffany Perkins-Munn

Laura, Omar and Tiffany explore best practices when it comes to scaling analytics adoption within the wider organization
Richie Cotton's photo

Richie Cotton

40 min

See MoreSee More