Understanding Artificial Intelligence
- BasicSkill Level
- 2 hr
- 403.4K learners
Learn the basic concepts of Artificial Intelligence, such as machine learning, deep learning, NLP, generative AI, and more.
Isenberg’s partnership with DataCamp is an investment designed to support our students as they explore new skills. With the exponential growth in artificial intelligence (AI) and all forms of information technology, DataCamp’s online learning platform provides the skills and hands-on practice students need for learning beyond the classroom

Learn the basic concepts of Artificial Intelligence, such as machine learning, deep learning, NLP, generative AI, and more.
Learn how to use ChatGPT. Discover best practices for writing prompts and explore common business use cases for the powerful AI tool.
Learn how to write effective prompts with ChatGPT to apply in your workflow today.
Explore AI ethics focusing on principles, fairness, bias reduction, and trust in AI design.
An introduction to machine learning with no coding involved.
Learn how to blend business, data, and AI, and set goals to drive success with an effectively scalable AI Strategy.
Discover how to make better business decisions by applying practical data frameworks—no coding required.
Learn how to analyze data with PivotTables and intermediate logical functions before moving on to tools such as what-if analysis and forecasting.
Master the Power BI basics and learn to use the data visualization software to build impactful reports.
Enhance your reports with trend analysis techniques such as time series, decomposition trees, and key influencers.
Start your Tableau journey with our Introduction to Tableau course. Discover Tableau basics such as its features and dashboards.
A non-coding introduction to cloud computing, covering key concepts, terminology, and tools.
An introduction to data visualization with no coding involved.
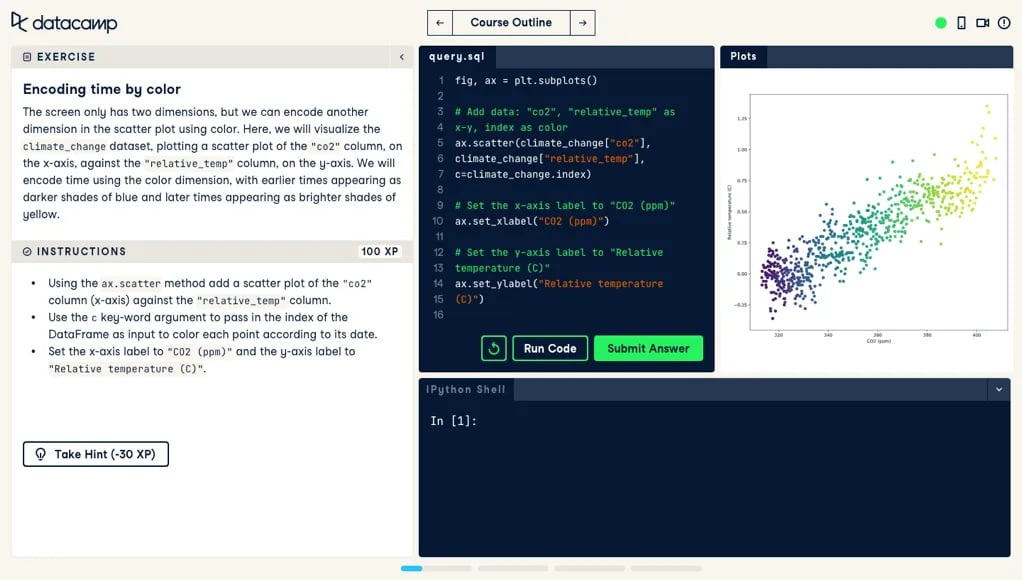
Learn how to create, customize, and share data visualizations using Matplotlib.
Power BI is a powerful data visualization tool that can be used in reports and dashboards.
Start your Tableau journey with our Introduction to Tableau course. Discover Tableau basics such as its features and dashboards.
Take your Tableau skills up a notch with advanced analytics and visualizations.
Dashboards are a must-have in a data-driven world. Increase your impact on business performance with Tableau dashboards.
Discover how data engineers lay the groundwork that makes data science possible. No coding involved!
Learn how to create and query relational databases using SQL in just two hours.
Accompanied at every step with hands-on practice queries, this course teaches you everything you need to know to analyze data using your own SQL code today!
Develop the skills you need to clean raw data and transform it into accurate insights.
Enter the world of Alteryx Designer and learn how to navigate the tool to load, prepare, and aggregate data.
Master data preparation, cleaning, and analysis in Alteryx Designer, whether you are a new or seasoned analyst.
Dive into data science using Python and learn how to effectively analyze and visualize your data. No coding experience or skills needed.
Level up your data science skills by creating visualizations using Matplotlib and manipulating DataFrames with pandas.
Learn how to import and clean data, calculate statistics, and create visualizations with pandas.
Learn to diagnose and treat dirty data and develop the skills needed to transform your raw data into accurate insights!
Master the basics of data analysis in R, including vectors, lists, and data frames, and practice R with real data sets.
Get started on the path to exploring and visualizing your own data with the tidyverse, a powerful and popular collection of data science tools within R.
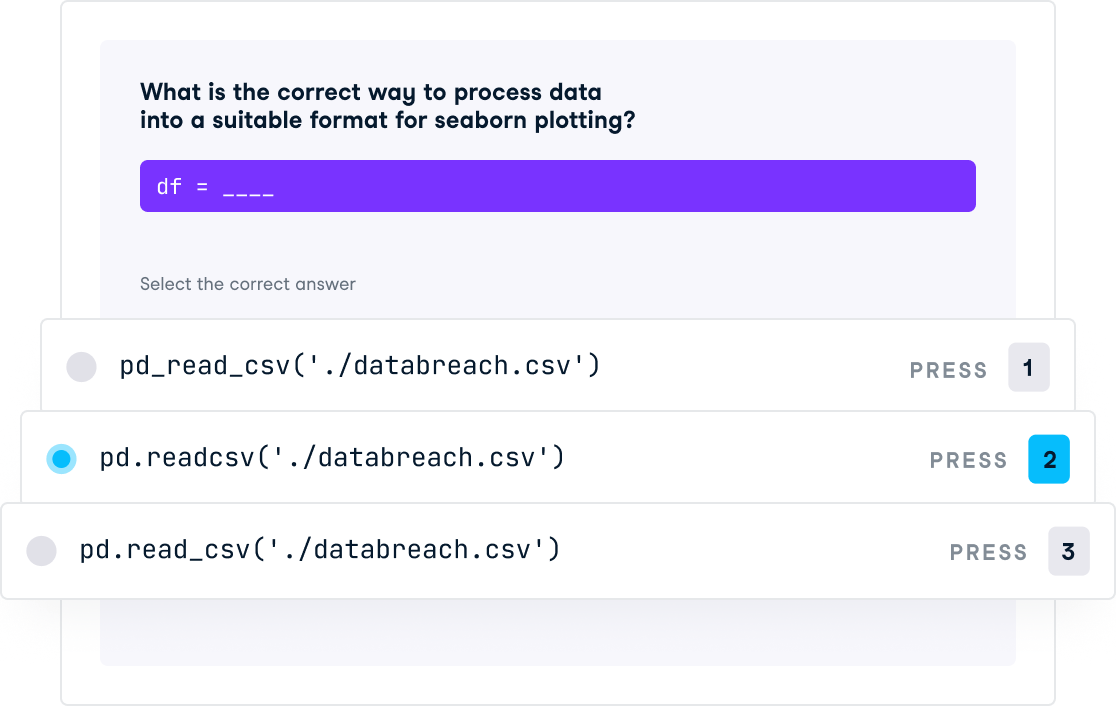
Learn fundamental natural language processing techniques using Python and how to apply them to extract insights from real-world text data.
Level up your data science skills by creating visualizations using Matplotlib and manipulating DataFrames with pandas.
Grow your statistical skills and learn how to collect, analyze, and draw accurate conclusions from data using Python.
In this course you'll learn to use and present logistic regression models for making predictions.
Grow your machine learning skills with scikit-learn in Python. Use real-world datasets in this interactive course and learn how to make powerful predictions!
Learn how to cluster, transform, visualize, and extract insights from unlabeled datasets using scikit-learn and scipy.
Learn the data skills you need online at your own pace—from non-coding essentials like data-driven decision making, Tableau, and Power BI to coding essentials with Python, R, and SQL.

Helpful resources like Cheatsheets, Blog posts and Webinars.
Keep your skills sharp with quick daily challenges on desktop or the DataCamp Mobile app
Join our webinars and live training sessions to learn how to build a data-driven organization. Even if you can’t attend live, we encourage you to register to receive a link to the on-demand recording.
For previously recorded webinars, view our on-demand webinars.

If you have any questions about the Isenberg DataCamp partnership,
please reach out to train@isenberg.umass.edu