
Our biggest-ever sale. 60% off AI & data skills
Buy Now

Berlatih dan lacak kemajuan Anda.
Lanjutkan dengan GoogleDengan melanjutkan, Anda menyetujui Ketentuan Penggunaan, Kebijakan Privasi dan bahwa data Anda disimpan di AS.Ikut koding bersama kami di
Ikut Kode ↗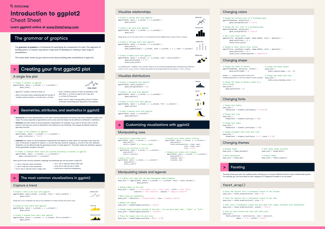
cheat sheets
 Richie Cotton

Tutorials
 DataCamp Team• 6 mnt

Tutorials
 Kevin Babitz• 7 mnt



In this live code-along, you'll perform an exploratory data analysis on video game sales data. The focus is on creating visualizations with ggplot2 in order to answer business questions. You'll also get an overview of the core philosophy behind ggplot2, which will allow you to extend your skill to visualize almost anything.
Key takeaways
Learn to perform simple exploratory data analysis using tidyverse packages, including dplyr and ggplot2
Learn the core philosophy behind the ggplot2 data visualization package
Learn how to answer business questions using bar plots and line plots