함께 코드 따라하기
코드 따라하기 ↗Visualizing Video Game Sales Data with ggplot2 in R
Learn to do exploratory data analysis and create visualizations with ggplot2.

Richie Cotton
무료 계정 만들기
실습 문제하고 트랙하세요.
Google로 계속하기계속 진행하시면 다음 사항에 동의하는 것으로 간주됩니다: 이용약관 및 개인정보 처리방침 그리고 귀하의 데이터가 미국에 저장된다는 점에 동의하는 것으로 간주됩니다.관련
치트 시트
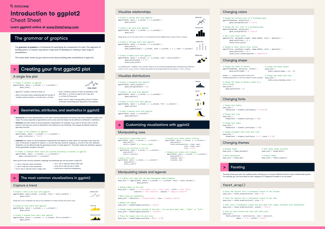
ggplot2 Cheat Sheet
ggplot2 is considered to be one of the most robust data visualization packages in any programming language. Use this cheat sheet to guide your ggplot2 learning journey.
Richie Cotton
튜토리얼
Graphics with ggplot2 Tutorial
Data visualization is an essential skill for data scientists. It combines statistics and design in meaningful and appropriate ways.
 DataCamp Team · 6 min

튜토리얼
ggplot2 Histogram in R: Complete Tutorial with Examples
Learn to create and customize ggplot2 histograms in R, from basic plots to colored, faceted, and density-overlaid visualizations.
 Kevin Babitz · 7 min




In this live code-along, you'll perform an exploratory data analysis on video game sales data. The focus is on creating visualizations with ggplot2 in order to answer business questions. You'll also get an overview of the core philosophy behind ggplot2, which will allow you to extend your skill to visualize almost anything.
Key takeaways
Learn to perform simple exploratory data analysis using tidyverse packages, including dplyr and ggplot2
Learn the core philosophy behind the ggplot2 data visualization package
Learn how to answer business questions using bar plots and line plots