
Chuyển đến nội dung chính
Data Analysis
Data Visualization
R
Data Analyst

Visualizing Video Game Sales Data with ggplot2 in R

Learn to do exploratory data analysis and create visualizations with ggplot2.
Richie Cotton's photo
Richie Cotton

Tạo tài khoản miễn phí của bạn

Luyện tập và Lộ trình tiến trình của bạn.

Tiếp Tục Với Google
Bằng cách tiếp tục, bạn chấp nhận Điều khoản sử dụng, Chính sách bảo mật và việc dữ liệu của bạn được lưu trữ tại Hoa Kỳ.
Code along with us onCode Along

View Slides

In this live code-along, you'll perform an exploratory data analysis on video game sales data. The focus is on creating visualizations with ggplot2 in order to answer business questions. You'll also get an overview of the core philosophy behind ggplot2, which will allow you to extend your skill to visualize almost anything.

Key takeaways

  • Learn to perform simple exploratory data analysis using tidyverse packages, including dplyr and ggplot2

  • Learn the core philosophy behind the ggplot2 data visualization package

  • Learn how to answer business questions using bar plots and line plots
Chủ đề
Data Analysis
Data Visualization
R
Data Analyst
Liên quan
ggplot2 cheat sheet.png

cheat-sheet

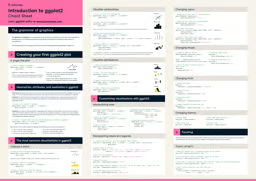
ggplot2 Cheat Sheet

ggplot2 is considered to be one of the most robust data visualization packages in any programming language. Use this cheat sheet to guide your ggplot2 learning journey.
Richie Cotton's photo

Richie Cotton

Hướng dẫn

Graphics with ggplot2 Tutorial

Data visualization is an essential skill for data scientists. It combines statistics and design in meaningful and appropriate ways.
DataCamp Team's photo

DataCamp Team

6 phút

Hướng dẫn

ggplot2 Histogram in R: Complete Tutorial with Examples

Learn to create and customize ggplot2 histograms in R, from basic plots to colored, faceted, and density-overlaid visualizations.

Kevin Babitz

7 phút

Hướng dẫn

Visualizing Climate Change Data with ggplot2: A Step-by-Step Tutorial

Learn how to use ggplot2 in R to create compelling visualizations of climate change data. This step-by-step tutorial teaches you to find, analyze, and visualize historical weather data.

Bruno Ponne

11 phút

Hướng dẫn

Facets for ggplot2 in R

In this tutorial, you'll learn how to make the most of ggplots facetting functions.
DataCamp Team's photo

DataCamp Team

8 phút

code-along

Exploratory Data Analysis in R for Absolute Beginners

Learn the basics of exploring new datasets in R.
Ishmael Rico's photo

Ishmael Rico

Xem thêm