Koda med oss på
Code Along ↗Visualizing Video Game Sales Data with ggplot2 in R
Learn to do exploratory data analysis and create visualizations with ggplot2.

Richie Cotton
Skapa ditt gratiskonto
Öva och håll koll på dina framsteg.
Fortsätt med GoogleGenom att fortsätta godkänner du vår användarvillkor, våra integritetspolicy och att dina uppgifter lagras i USA.Relaterat
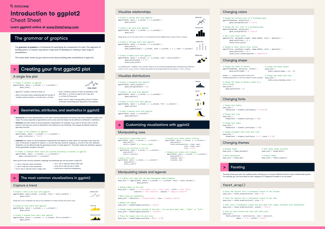
snabbguide
ggplot2 Cheat Sheet
ggplot2 is considered to be one of the most robust data visualization packages in any programming language. Use this cheat sheet to guide your ggplot2 learning journey.
Richie Cotton
Handledning
Graphics with ggplot2 Tutorial
Data visualization is an essential skill for data scientists. It combines statistics and design in meaningful and appropriate ways.
 DataCamp Team · 6 min

Handledning
ggplot2 Histogram in R: Complete Tutorial with Examples
Learn to create and customize ggplot2 histograms in R, from basic plots to colored, faceted, and density-overlaid visualizations.
 Kevin Babitz · 7 min




In this live code-along, you'll perform an exploratory data analysis on video game sales data. The focus is on creating visualizations with ggplot2 in order to answer business questions. You'll also get an overview of the core philosophy behind ggplot2, which will allow you to extend your skill to visualize almost anything.
Key takeaways
Learn to perform simple exploratory data analysis using tidyverse packages, including dplyr and ggplot2
Learn the core philosophy behind the ggplot2 data visualization package
Learn how to answer business questions using bar plots and line plots