함께 코드 따라하기
코드 따라하기 ↗Data Storytelling for Absolute Beginners: A Case Study with Green Businesses
In this webinar for data novices, you'll learn about several ways in which you can visualize your data, understand how plots work and structure a story around them.

Camilo Martinez
무료 계정 만들기
실습 문제하고 트랙하세요.
Google로 계속하기계속 진행하시면 다음 사항에 동의하는 것으로 간주됩니다: 이용약관 및 개인정보 처리방침 그리고 귀하의 데이터가 미국에 저장된다는 점에 동의하는 것으로 간주됩니다.관련

블로그
Telling Effective Data Stories with Data, Narrative, and Visuals
Effective data storytelling enables data practitioners to cross the last mile of analytics, enabling them to drive action with their insights. In a recent webinar, Brent Dykes discussed how data, narrative, and visuals can drive effective data stories.
 DataCamp Team · 5 min

블로그
Seven Tricks for Better Data Storytelling: Part II
In a recent episode of DataFramed, Andy Cotgrave, technical evangelist at Tableau, shared the importance of data storytelling in driving change with analytics. In this two-part blog post, we deep dive into seven concrete tips that Andy provided on data storytelling
 Travis Tang · 4 min
치트 시트
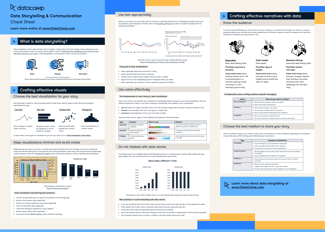
Data Storytelling & Communication Cheat Sheet
In this data storytelling and communication cheat sheet, you'll learn about best practices for crafting data stories.
 Richie Cotton · 6 min






Getting a result from a data analysis is only half the problem. Humans think in stories, not numbers, so you need to learn to tell stories with your data in order to communicate your results.
In this webinar for data novices, you'll learn about several ways in which you can visualize your data, understand how plots work and structure a story around them.
Key Takeaways:
Additional Resources
Slides