Course
Exploratory Data Analysis in R
4 hr
115.1K
Data analytics projects are crucial stepping stones for anyone looking to excel in today's data-centric world. Here’s why they are essential:
In essence, data analytics projects not only sharpen your technical skills but also prepare you for the challenges and demands of the modern workplace.
As a beginner, you need to focus on importing, cleaning, manipulating, and visualizing the data.
In the Exploring the NYC Airbnb Market project, you will apply data importing and cleaning skills to analyze the Airbnb market in New york. You will ingest and combine the data from multiple file types, and clean strings and format dates to extract accurate information.
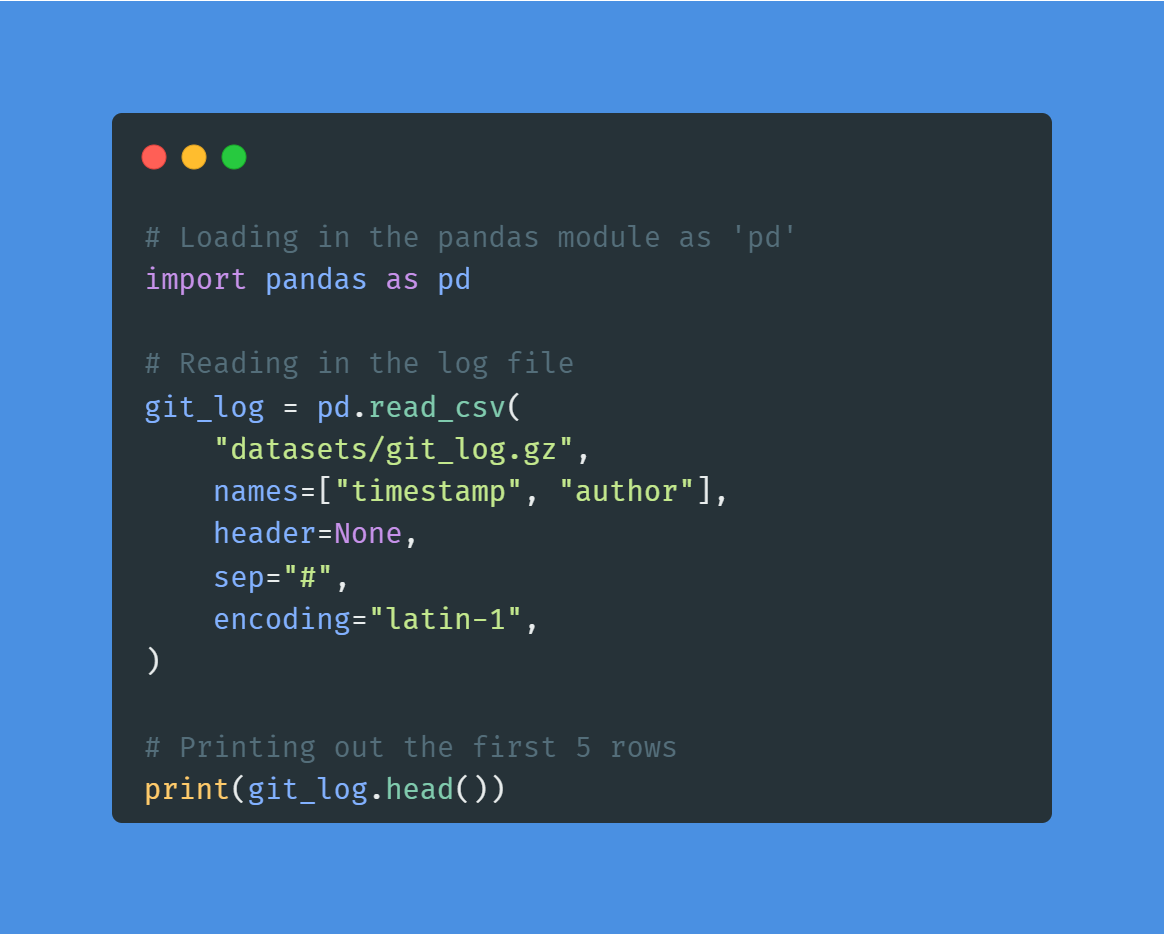
Image by Author | Code from the project
The project is perfect for beginners who want to get data importing and cleaning experience. You can apply similar methods to this Online Ticket Sales dataset to get even better at handling and processing the data.
Learn more about data importing and cleaning by taking short courses:
In the Word Frequency in Classic Novels project, you will use requests and BeautifulSoup to scrape a novel from the Project Gutenberg website. After scraping and cleaning the text data, you will use NLP to find the most frequent words in Moby Dick. The project introduces you to the world of Python web scraping and natural language processing.
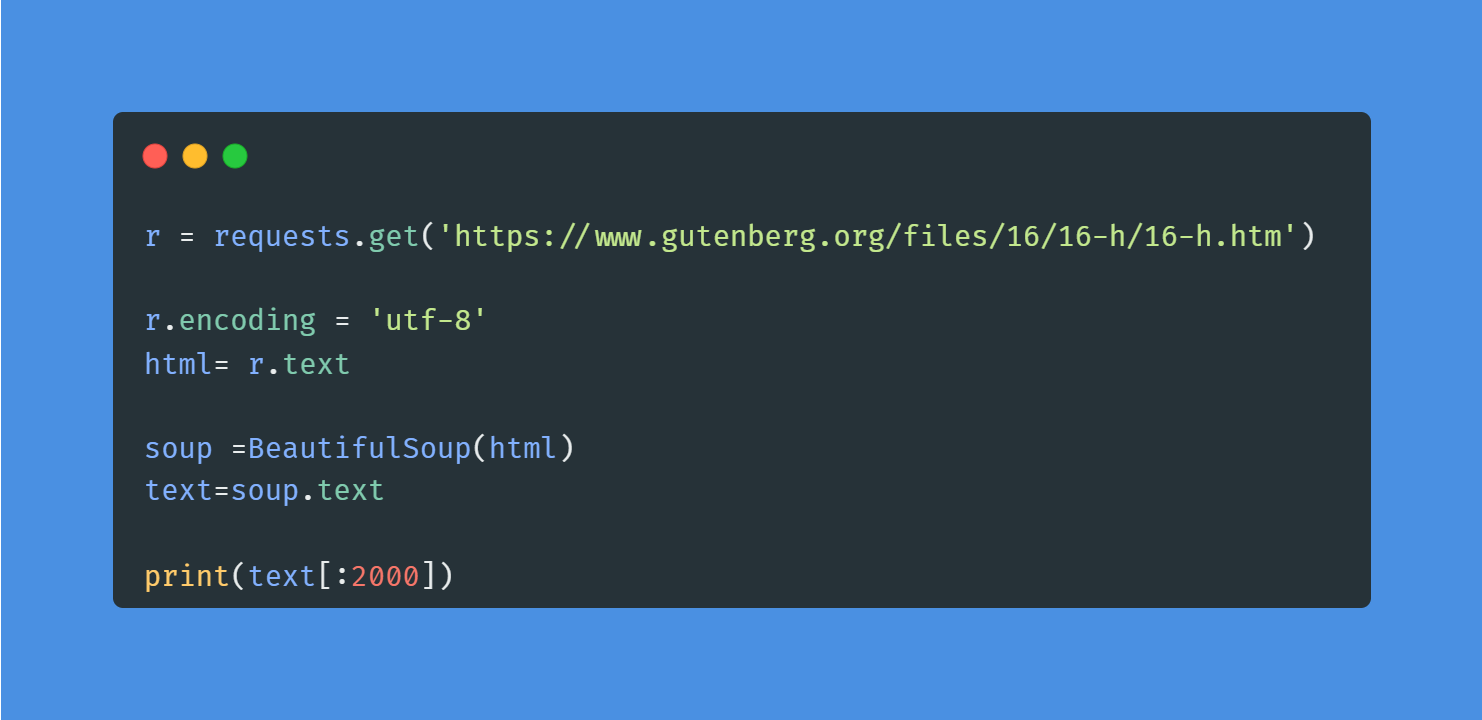
Image by Author | Code from the project
For data analysts and data scientists, web scraping is an essential skill to learn. You can take a short Web Scraping with Python course to understand the tools and components of an HTML web page.
In the Exploring NYC Public School Test Result Scores project, you’ll analyze standardized SAT performance across New York City’s public schools. You’ll clean and summarize columns (Math, Reading, Writing), compare outcomes across boroughs, rank schools by Math scores, and surface the city’s top-ten performers. Along the way, you’ll practice core analyst moves: fixing types, handling missing values, computing group statistics, and turning raw school-level data into clear, decision-ready insights.
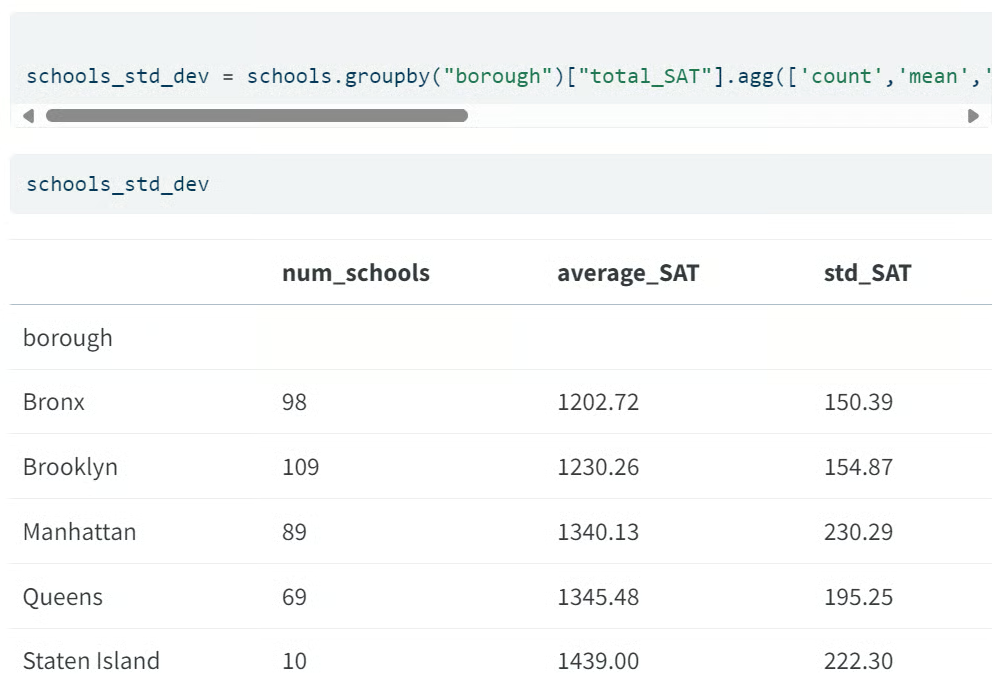
Image by Author | Code from the project
This project is perfect for beginners looking to create a realistic, business-style exploratory data analysis (EDA) involving ranking, benchmarking, and geographic slicing. You can use the same methodology for related datasets, such as "Factors that Fuel Student Performance" or your local district’s open data, to enhance your portfolio with comparable and reproducible analyses.
In the Analyzing Motorcycle Part Sales project, you’ll query a multi-warehouse sales database to uncover revenue patterns across time, product lines, and locations. You’ll calculate net revenue (accounting for discounts/returns where applicable), segment by warehouse and date, rank top-performing product categories, and build comparison slices to spotlight growth vs. decline.
Expect lots of practical SQL: joins, date truncation, conditional aggregation, and window functions to turn raw transactions into clear, executive-ready reports.
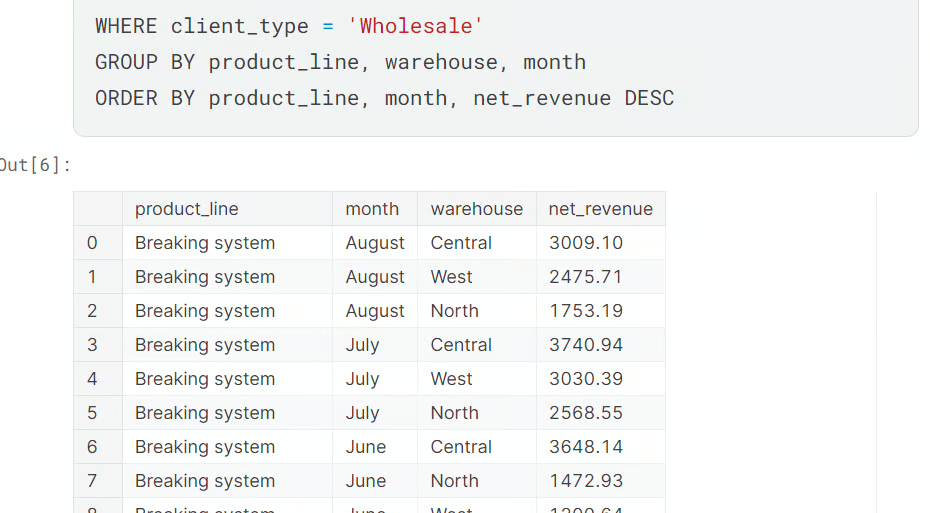
Image by Author | Code from the project
This project is perfect for analysts who want business-facing SQL experience that mirrors real work: KPI definitions, revenue rollups, warehouse benchmarking, and time-based performance tracking you can plug into a dashboard or weekly ops readout.
In the Exploring the Bitcoin Cryptocurrency Market project, you will explore bitcoin and other cryptocurrency data. You will clean the dataset by discarding cryptocurrencies without market capitalization, comparing Bitcoin with other currencies, and preparing data for visualization.
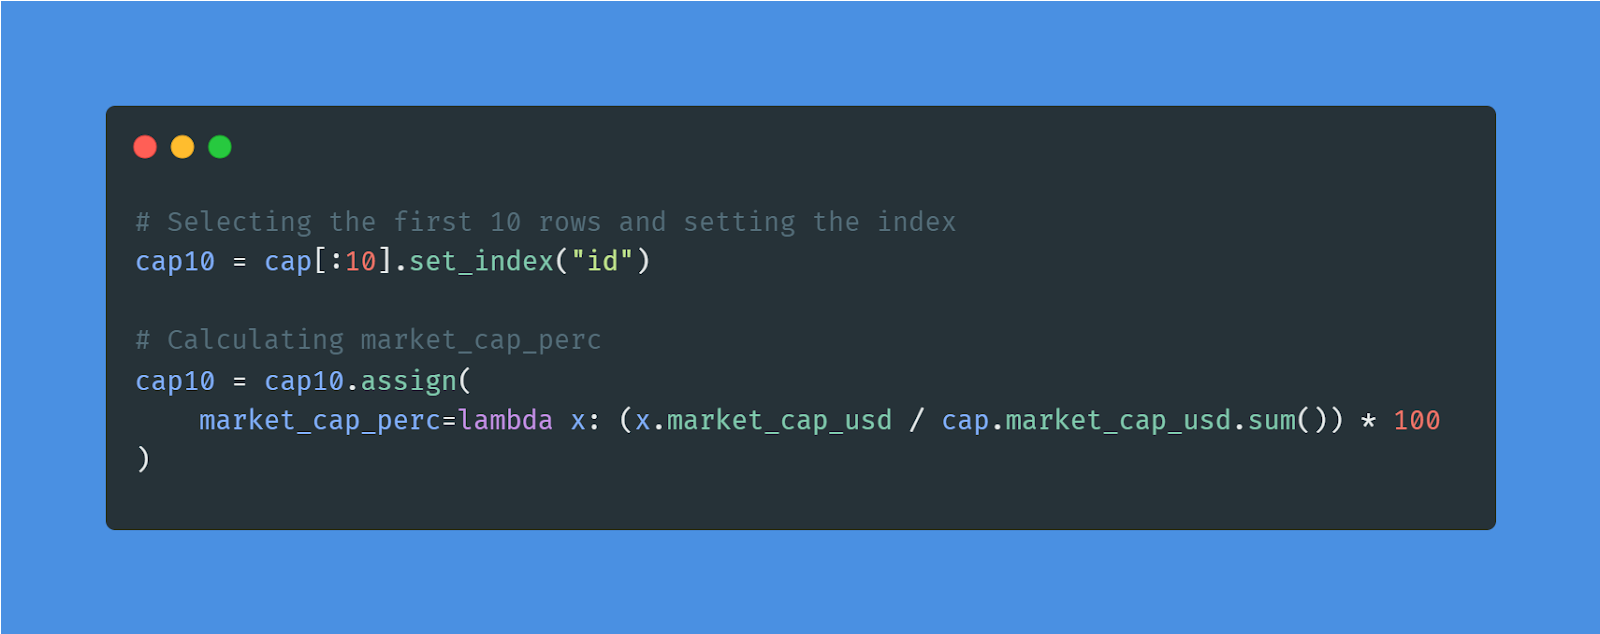 Image by Author | Code from the project
You can apply similar methods to Stock Exchange Data and learn to manipulate the data for data analysis. Furthermore, you can learn data transformation, aggregation, slicing, and indexing by taking Data Manipulation with pandas course.
In the Visualizing the History of Nobel Prize Winners project, you'll examine over a century of Nobel Prize history. Using Python, you'll analyze and visualize data to uncover patterns and potential biases in how prestigious honors are awarded across categories like physics, chemistry, literature, and peace.
You'll apply data manipulation techniques with pandas and craft compelling visualizations with Seaborn to tell a story with the data. This project is perfect for enhancing your data analysis and visualization skills while exploring one of the world's most famous accolades.
In the Exploring Stock Market Trends with Plotly project, you’ll transform raw price data from fast-food giants (e.g., McDonald’s, Starbucks) into interactive charts that surface sector momentum and patterns. You’ll build candlestick and line charts, add moving averages and rolling stats, compare multiple tickers, and annotate key events, focusing on visual storytelling that highlights volatility, seasonality, and relative performance.

This is a visualization-first project, perfect if you want a clean, portfolio-ready dashboard that demonstrates market insight through interactivity (hover, zoom, range sliders) rather than heavy modeling.
In the Visualizing COVID-19 project, you will visualize COVID-19 data using the most popular R library ggplot. You will analyze confirmed cases worldwide, compare China with other countries, learn to annotate the graph, and add a logarithmic scale. The project will teach you skills that are in high demand for R programmers.
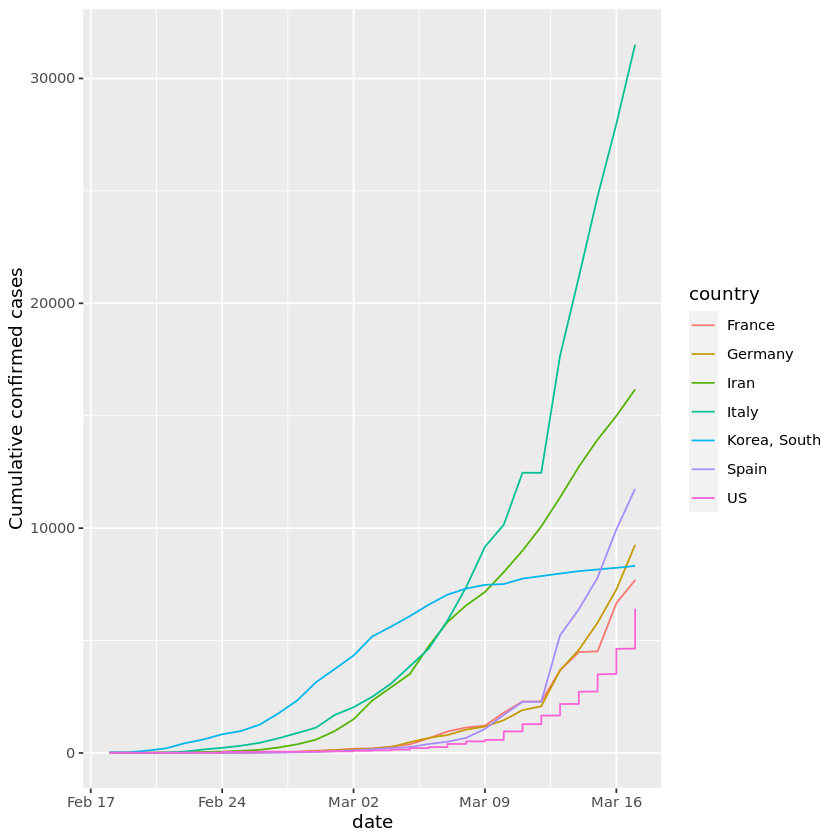
Image from the project
You can apply ggplot methods to Measles Data and gain more experience in data visualization and analysis. Moreover, you can take Intermediate Data Visualization with the ggplot2 course to learn the best data visualization practices.
In the Analyzing Super Bowl Viewership and Advertising project, you’ll explore the drama behind the Super Bowl—from the games and advertisements to the halftime shows. Using R, you’ll manipulate and visualize data to uncover how these elements interact with one another. Perfect for building your skills in data analysis with tools like ggplot2 and dplyr.
Using the code to display interactive data visualization is easy, but understanding and interpreting the data is hard. Take the Understanding Data Visualization course to explain visualization distribution and learn the best data visualization techniques to communicate complex data.
For more advanced data analytics projects, you need command over mathematics, probability, and statistics. Furthermore, you will perform exploratory data and predictive analytics to understand the data in detail.
In the Modeling Car Insurance Claim Outcomes project, you’ll use Python and logistic regression to predict insurance claims. Working with data from On the Road car insurance, you’ll identify key features that lead to the most accurate predictions. This project will help you apply machine learning techniques to real-world business problems in the insurance industry.
In the Hypothesis Testing with Men's and Women's Soccer Matches project, you’ll analyze historical soccer data to test if women’s international matches result in more goals than men’s. With Python, you’ll sharpen your statistical testing skills and uncover patterns in global soccer trends.
If you are interested in learning about the most common statistical techniques, probability, data distribution, correlation, and experimental design, take the Introduction to Statistics in Python course.
In the Analyze International Debt Statistics project, you will write SQL queries to explore and analyze international debt using the World Bank dataset. SQL is the most popular and essential tool for performing data analytics on the go.
In the project, you will be finding the:
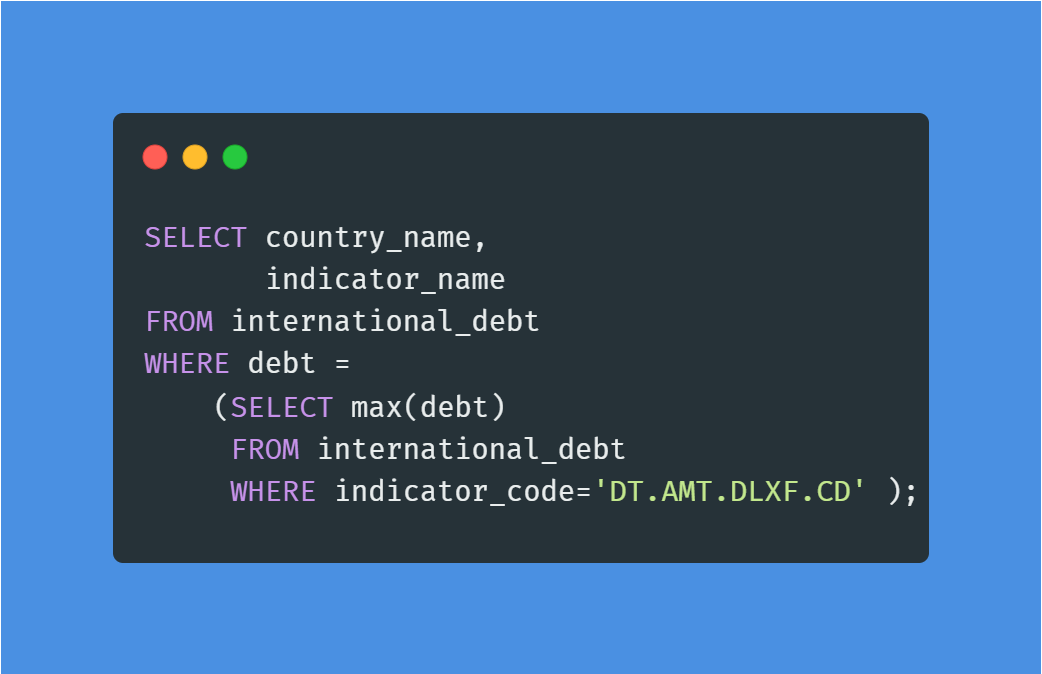
Image by Author | Code from the project
You will connect World Nations MariaDB dataset and apply similar queries to get additional experience in handling and analyzing SQL databases. Additionally, you can Exploratory Data Analysis in SQL course to advance techniques and queries in handling various SQL databases.
In the Analyzing Crime in Los Angeles project, you’ll act as a data detective for the LAPD, cleaning and segmenting incident data to learn when and where crime is most likely to occur and which offense types dominate. You’ll slice by time-of-day, day-of-week, neighborhood, and category; compute hotspot summaries; and build comparison cuts that translate directly into resource-allocation insights.
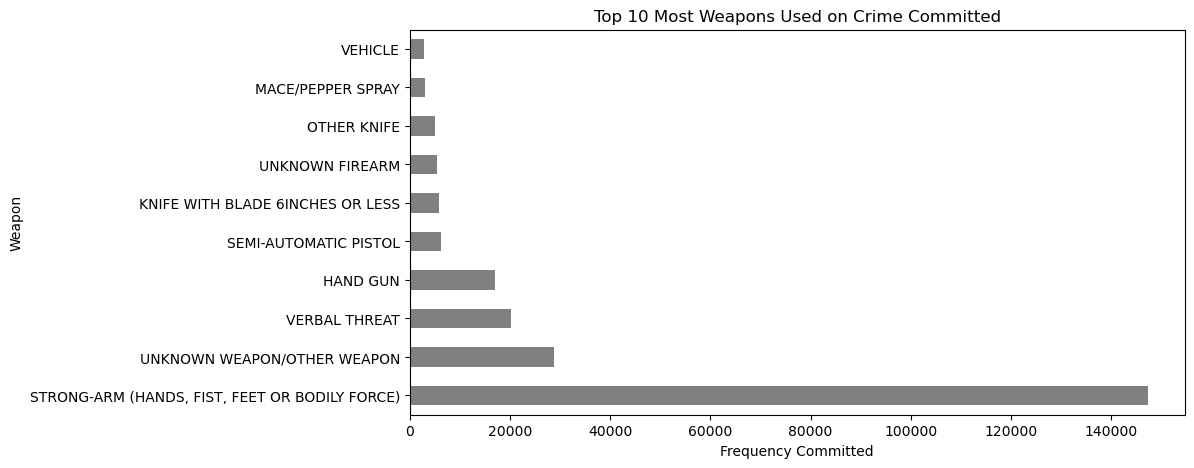
Image from the project
You’ll practice: data cleaning, grouping & aggregation, time-based bucketing, rate normalization (per capita or per time window), ranking top-N neighborhoods/offenses, and building interpretable tables/charts for decision-making.
In the Investigating Netflix Movies and Guest Stars in The Office project, you will use data manipulation and visualization to solve a real-world data science problem. You will perform deep exploratory data analysis and draw conclusions from detailed graphs.
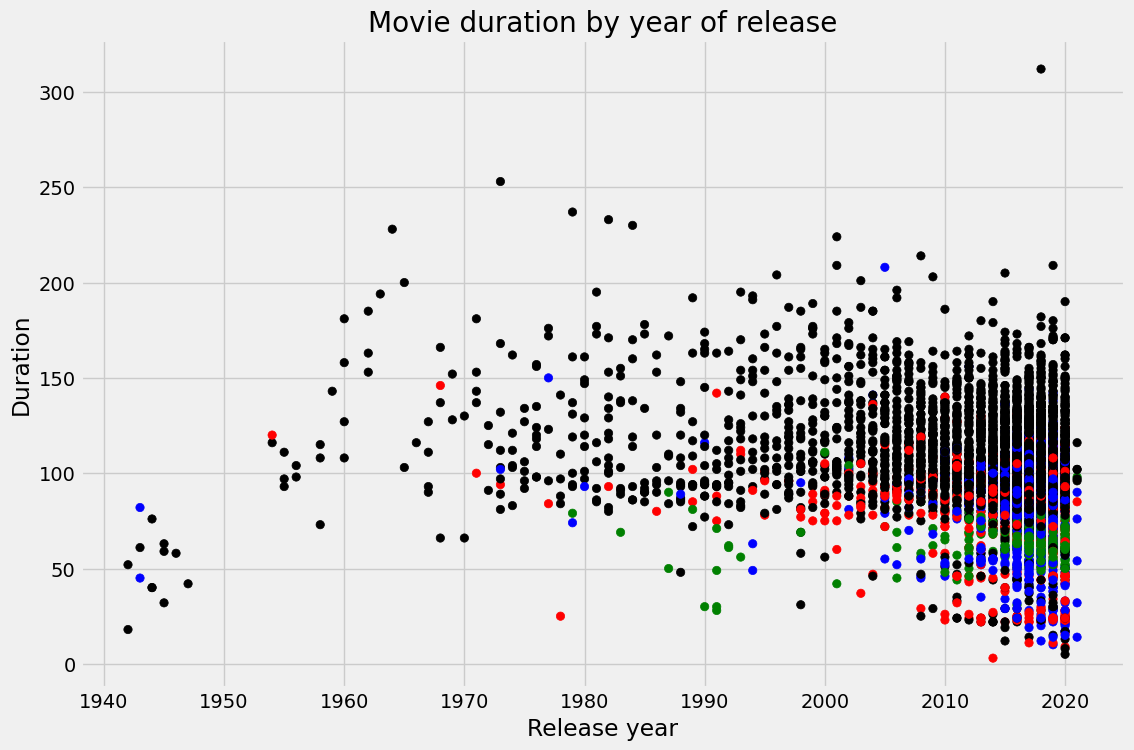
Image from the project
You can work on a portfolio project by applying similar skills to a new dataset: Netflix Movie Data. Furthermore, you can take Exploratory Data Analysis in Python to learn more about data cleaning and validation, understand the relationship and distribution, and explore multivariate relationships.
In the Predict Future Sales of Fast-Food Menu Items project, you’ll help a fast-food chain reduce overspending and rushed orders by building a sales prediction model for top menu items. You’ll frame the business problem, engineer calendar/promotional features, create time-aware splits, fit and compare regression models in R, and quantify impact with RMSE/MAE, turning historical POS data into order plans that are more accurate and cost-effective.
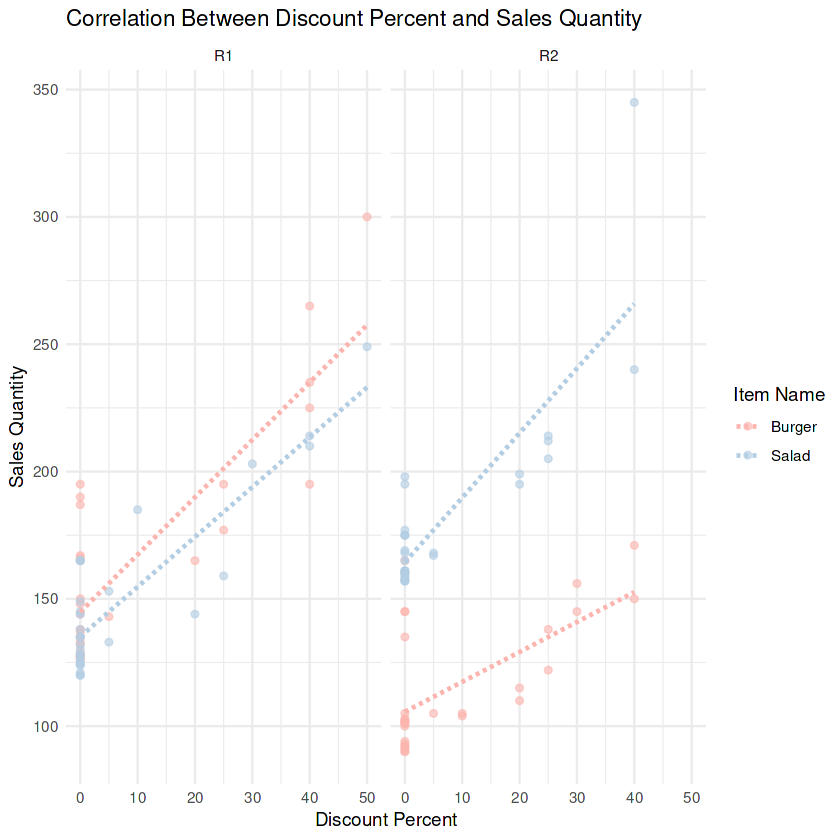
Image from project
You will practice feature engineering, including day-of-week, holidays, and promotions; leakage-safe train/test splits; baseline versus tuned models; cross-validation; RMSE/MAE reporting; simple backtesting; and converting model results into ordering recommendations.
In the Will This Customer Purchase Your Product? project, you’ll analyze customer shopping behaviors using statistics and probability techniques. With Python, you’ll uncover insights into the differences between new and returning customers, helping marketing teams better understand engagement on e-commerce platforms.
In the Predicting Credit Card Approvals project, you will build the best-performing machine learning model for predicting credit card application approvals.
First, you will understand the data and impute missing values. After that, you will preprocess the data and train a logistic regression model on the training set. In the end, you will evaluate the results and improve the model performance using Grid searching.
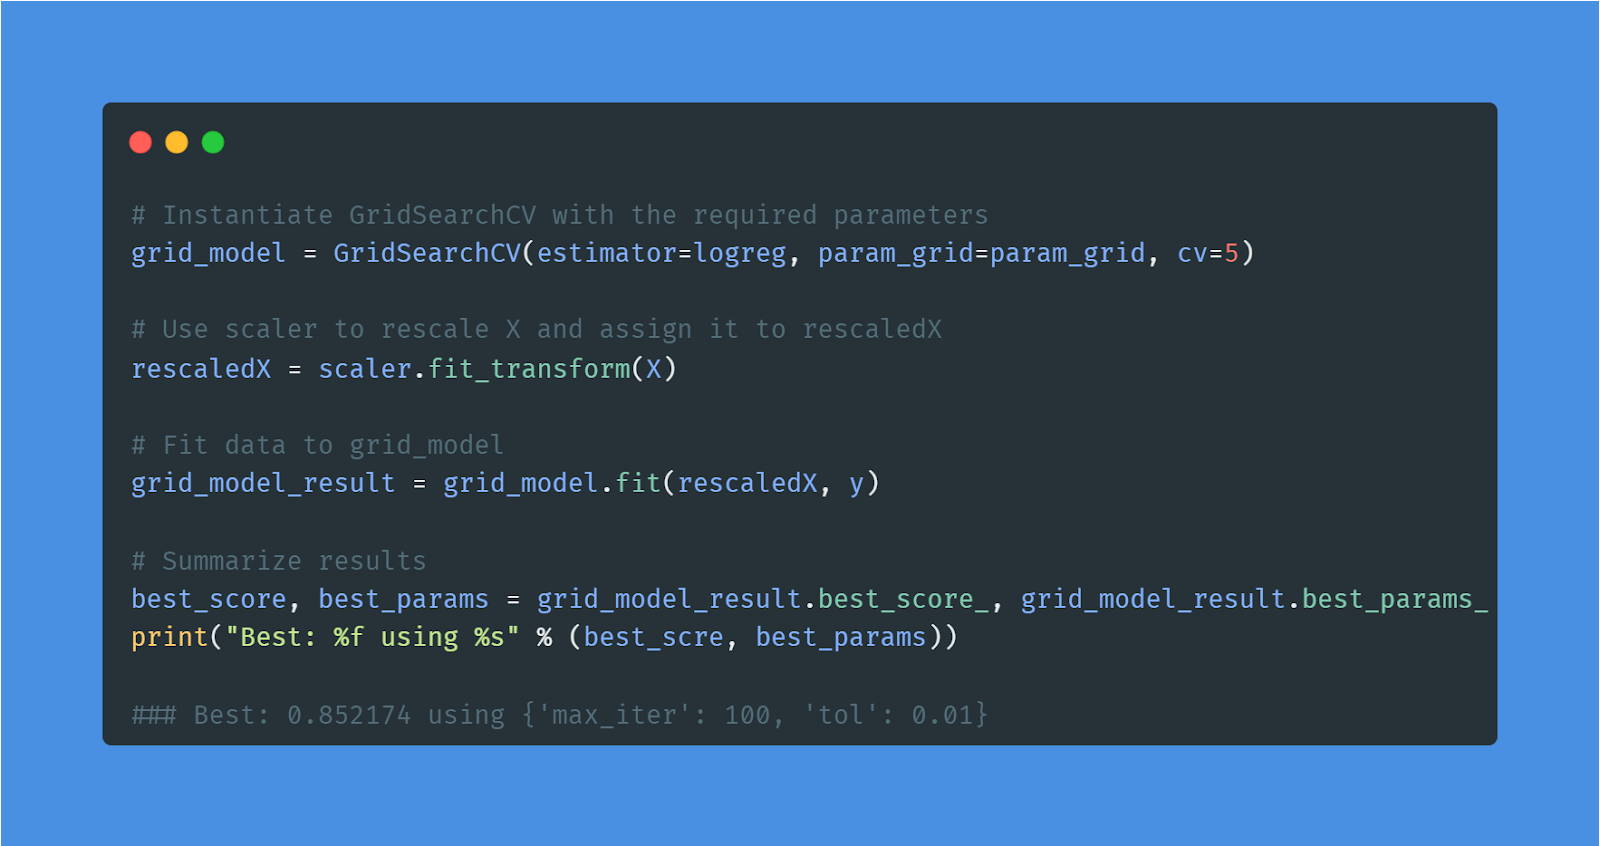
Image by Author | Code from the project
Applying simple machine learning algorithms is an essential part of a data analyst’s life. You can gain more experience by applying similar methods to a new dataset: Bank Marketing.
Learn more about classification, regression, fine-tuning, and preprocessing by taking a short Supervised Learning with the scikit-learn course.
Final year student projects are usually research-based and require at least 2-3 months to complete. You will be working on a specific topic and trying to improve the results using various statistical and probability techniques.
Note: There is a growing trend for machine learning projects for data analytics final-year projects.
In the Exploring London’s Travel Network project, you’ll query a warehouse (Snowflake/Redshift/BigQuery/Databricks) with 12 years of TfL journeys (2010–2022) to understand how Londoners move. You’ll rank the most popular transport modes, pinpoint periods when the London cable car was unusually busy, and identify rare windows when the Underground was quieter than normal, turning raw journeys into operational insights for scheduling and capacity planning.
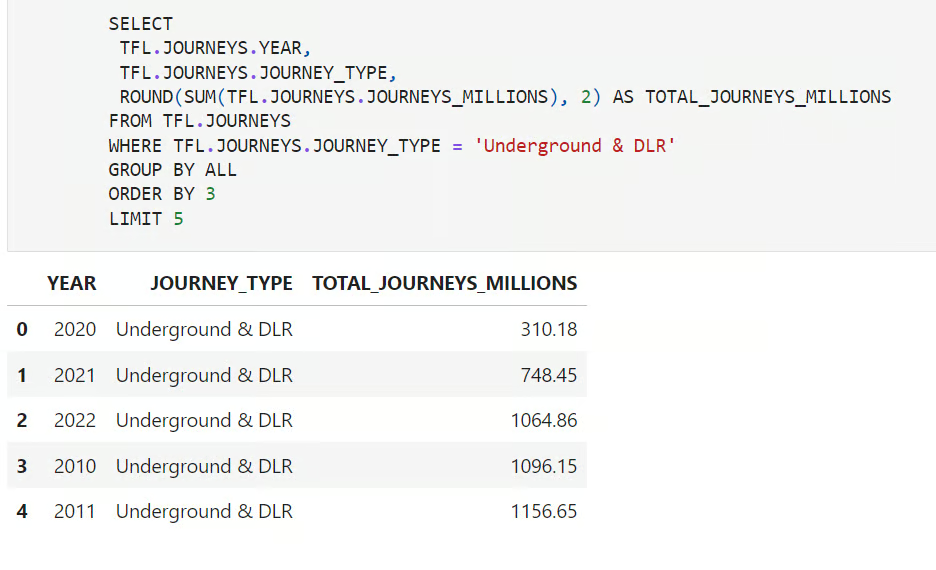
Image from the project
You will practice time bucketing (month/year), window and aggregate functions, conditional aggregation by mode/line, spotting anomalies (unusually busy or quiet periods), checking for seasonality (events/holidays), and building tidy KPI tables for transport operations.
For the Reducing Traffic Mortality in the USA project, you will find a good strategy for reducing traffic-related deaths in the USA. You will be importing, cleaning, manipulating, and visualizing the data. Furthermore, you will perform feature engineering and apply various machine learning models (multivariate linear regression, KMeans clustering) to come up with stately and communicate the results.
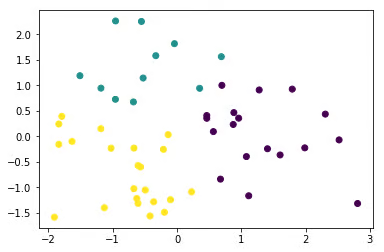
Image from the project
If you want to learn more about unsupervised learning, check out Cluster Analysis in Python course.
In the Assessing the Effectiveness of Medical Treatments project, you’ll explore the fascinating case of Simpson’s Paradox in a kidney stone treatment study. Using R, you’ll apply regression analysis to uncover hidden insights and better understand how outcomes vary across patient groups.
In the Building a Demand Forecasting Model project, you’ll predict e-commerce product demand with PySpark, answering real supply-chain questions like stock planning and replenishment frequency. You’ll engineer temporal features (day-of-week, seasonality, holidays), create time-aware validation splits, train and compare forecasting baselines vs. ML models at scale, and run rolling backtests to quantify stability, turning order history into actionable purchasing plans.
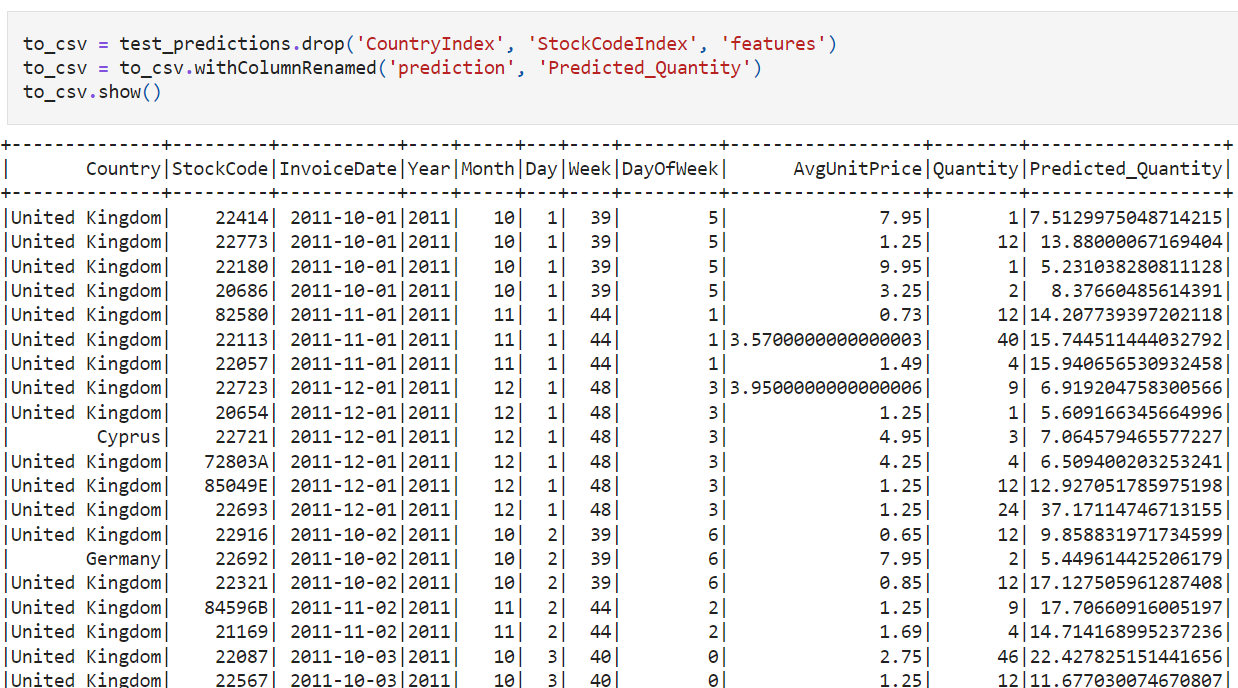
Image from the project
You will practice large-scale feature engineering, Spark joins/window operations, leakage-safe validation, baseline versus tuned models, RMSE/MAE error analysis, rolling/blocked backtests, and scenario analysis, including promotions and seasonality.
In the Social Networks: A Twitter Network Analysis project, you’ll analyze follower data with pandas and NetworkX to uncover influencers, bridges, and community structures. You’ll build reusable functions for loading/cleaning edge lists, construct graphs, compute centrality metrics (degree, betweenness, eigenvector), detect communities, inspect ego-nets, and visualize network topology, turning raw connections into clear, actionable insights.
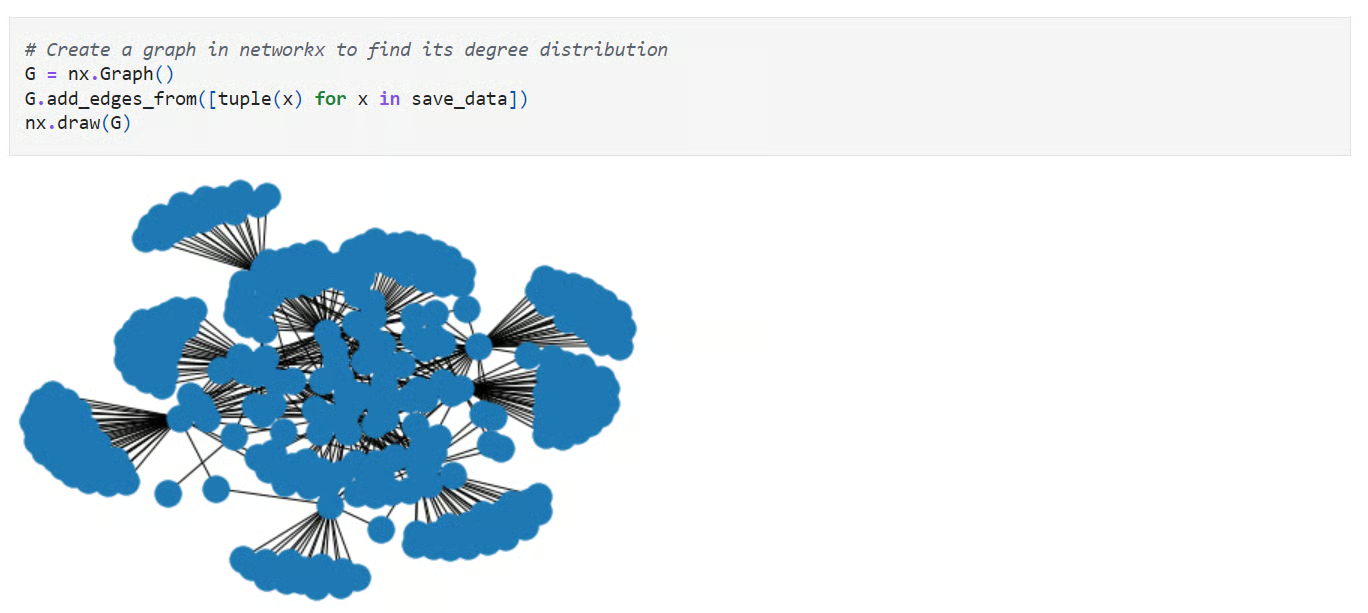
You will practice graph construction from follower data, data cleaning with Pandas, centrality and community detection, ranking influential accounts, ego-net exploration, and creating readable network visualizations with clear takeaways.
The World Population Analysis project is the best example of performing deep exploratory analysis. You will be exploring various columns, visualizing the least and most populated countries, and exploring population density and growth rate. Furthermore, you will display the country rank distribution and correlation map.
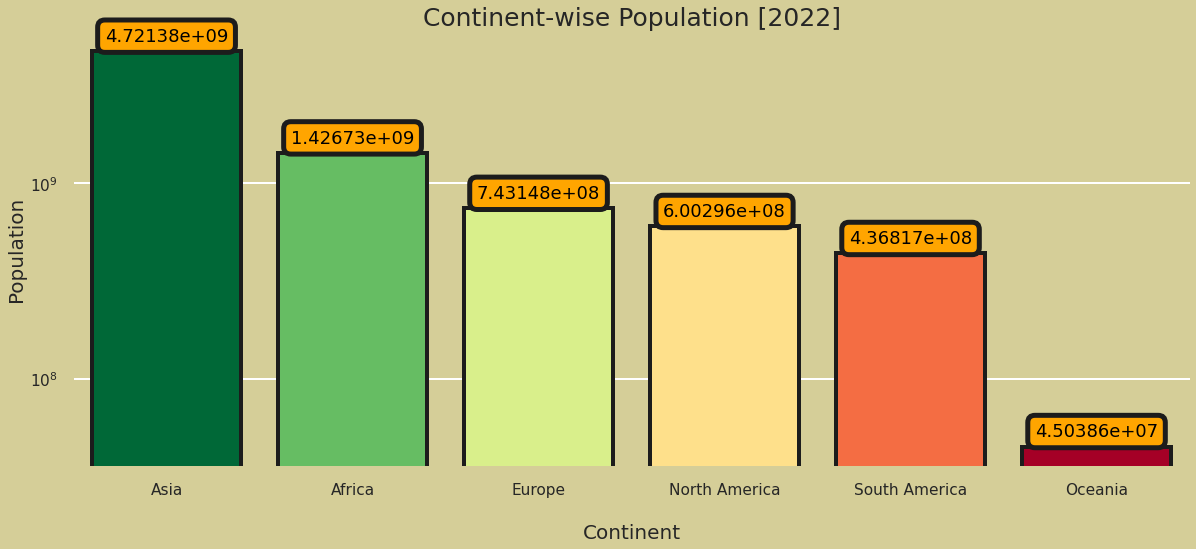
Image from the project
Learn easy ways to plot data visualization in Python by completing Intermediate Data Visualization with Seaborn course.
The Data Science and MLOps Landscape in Industry project is a holy grail for all data manipulation, visualizations, and exploratory and geospatial analysis. You will learn to effectively use box plots, doughnut charts, bar charts, heatmaps, parallel categorical graphs, bubble charts, funnel charts, radar charts, icicle charts, and maps. Furthermore, you will learn to interpret various types of graphs.
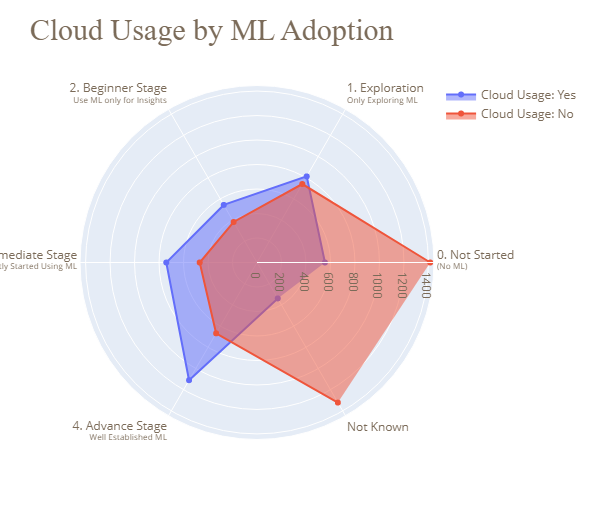
Image from the project
Take Introduction to Data Visualization with Plotly in Python course to learn about advanced Plotly features and customization.
End-to-end projects are great for your resume and understanding of the data analytic project life cycle.
In general, you will be:
In the Analyzing Unicorn Companies project, you’ll use SQL to explore unicorn companies valued at over $1 billion. You’ll analyze which industries have the highest valuations and identify emerging trends, such as the yearly growth of new unicorns between 2019 and 2021.
In the Monitoring a Financial Fraud Detection Model project, you’ll take on the role of a post-deployment data scientist for a major UK bank. Using Python, you’ll monitor the performance of a fraud detection model and investigate why it may not be working as expected, ensuring the safety of customers’ finances.
In the Time Series Analysis and Forecasting project, you will dive deep into analyzing the trends, apply the ARIMA model for forecasting, compare the results, and visualize the results to understand the sales for both furniture and office supplies.
Time-series analysis and forecasting projects are in high demand in financial sectors, and they will help you land a high-paying job. The only thing you need to do is to interpret various trends and accurately forecast the numbers.
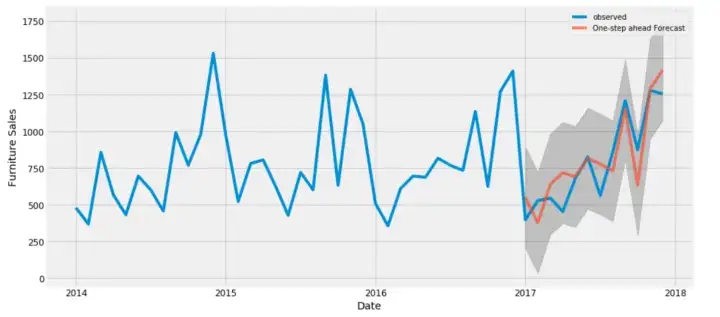
Image from the project
If you are struggling to analyze and forecast, try completing ARIMA Models in Python course to learn about ARMA models, fitting the future, selecting the best models, and training seasonal ARIMA models.
The goal of Build a multi-objective recommender system project is to predict e-commerce clicks, cart additions, and orders. In short, you will be creating a multi-objective recommender system based on previous events in a user session.
Upon completing the project, you will master:
Image from the project
While individual projects are essential for personal skill development, organizations also need to ensure their teams are well-equipped to handle the complexities of data analytics. DataCamp for Business offers tailored solutions that help companies upskill their employees in data science, analytics, and machine learning. With access to a vast library of interactive courses, custom learning tracks, and real-world projects, teams can advance their skills in data ingestion, cleaning, manipulation, visualization, and predictive analytics—all key areas highlighted in this blog.
Whether you're a small startup or a large enterprise, DataCamp for Business provides the tools to upskill, reskill, and create a data-driven culture to stay competitive in today's market. You can request a demo today to learn more.
After learning essential skills, you need to build a strong portfolio to showcase your knowledge. Furthermore, you will be learning new tools, features, and concepts that are beneficial for your professional life.
In this post, we have learned about beginner-friendly projects, advanced projects, final-year student projects, and end-to-end data analytics projects. Moreover, we have covered projects on data ingestion and cleaning, probability and statistics, data manipulation and visualization, and exploratory data and predictive analysis.
So, what’s next? After completing at least 12 projects, try to Get certified as a Professional Data Analyst. It will increase your odds of getting hired. You can also check out our post on how to become a data analyst for more career tips.
Course
Course
blog
Abid Ali Awan
15 min
blog
Kurtis Pykes
14 min
blog
Bekhruz Tuychiev
15 min
blog
Austin Chia
9 min
blog
Jess Ahmet
8 min
blog
Abid Ali Awan
15 min