

Course
Exploratory Data Analysis in R
4 hr
117.8K
In recent years, data analysis has become more critical than ever. While the last decade was defined by the accumulation of 'big data', 2026 is defined by speed and utility. In my opinion, it is no longer enough to merely collect petabytes of information. The competitive advantage now lies in Decision Intelligence: the ability to digitize and automate decision-making using data and AI.
Research from Grand View Research estimates that the Business Intelligence industry will grow from around $36.6 billion in 2024 to over $86.6 billion by 2030. A large part of this is driven by the integration of generative AI into BI tools.
Today, organizations are using data analysis to solve complex challenges in real-time:
Data analysis is the engine that turns the raw fuel of unstructured data (video, text, IoT signals) into the refined product of business strategy.
The process of data analysis is a systematic approach that involves several stages. Here, we'll walk you through each step, from defining objectives to data storytelling. You can learn more about how businesses analyze data in a separate guide.
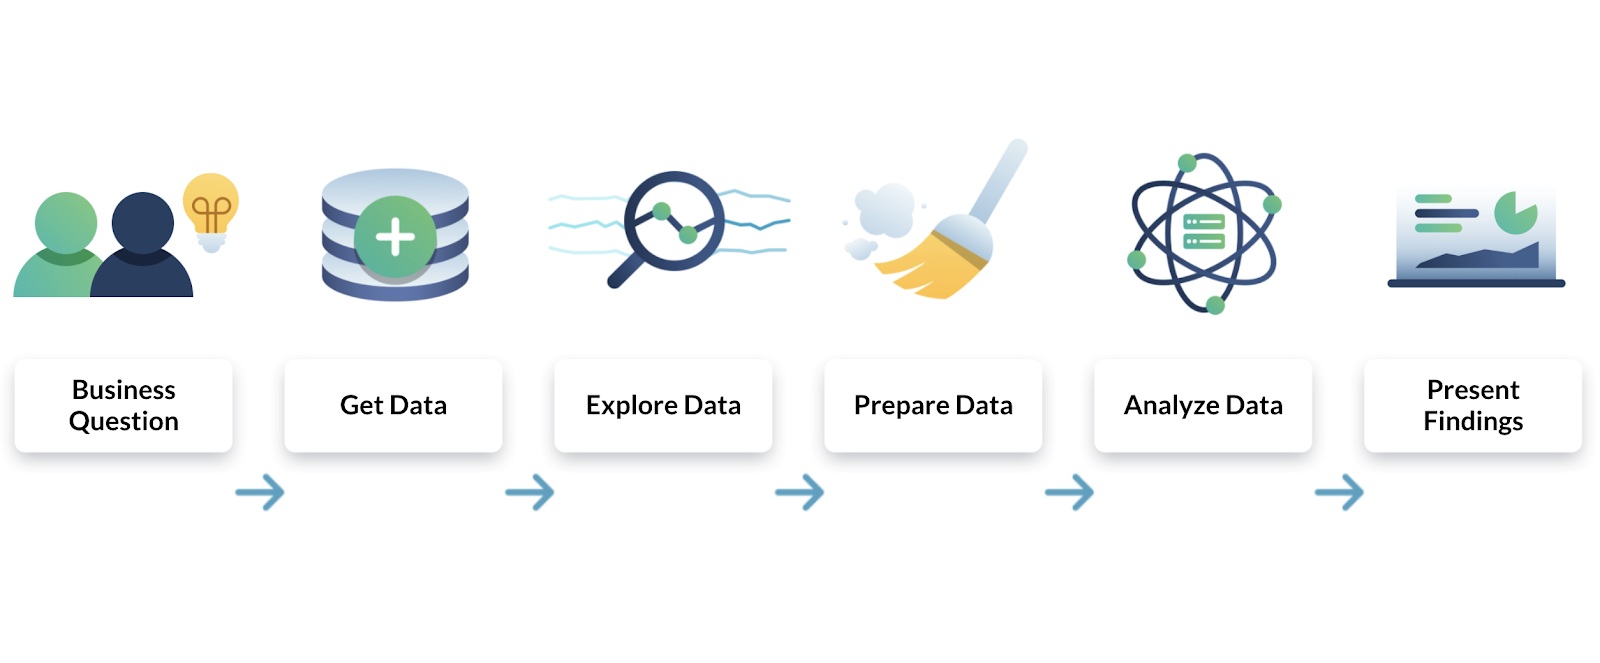
The data analysis process in a nutshell
The first step in the data analysis process is to define the objectives and formulate clear, specific questions that your analysis aims to answer. This step is crucial as it sets the direction for the entire process. It involves understanding the problem or situation at hand, identifying the data needed to address it, and defining the metrics or indicators to measure the outcomes.
Once the objectives and questions are defined, the next step is to collect the relevant data. This can be done through various methods such as surveys, interviews, observations, or extracting from existing databases. The data collected can be quantitative (numerical) or qualitative (non-numerical), depending on the nature of the problem and the questions being asked.
Data cleaning, also known as data cleansing, is a critical step in the data analysis process. It involves checking the data for errors and inconsistencies, and correcting or removing them. This step ensures the quality and reliability of the data, which is crucial for obtaining accurate and meaningful results from the analysis.
Once the data is cleaned, it's time for the actual analysis. This involves applying statistical or mathematical techniques to the data to discover patterns, relationships, or trends. There are various tools and software available for this purpose, such as Python, R, Excel, and specialized software like SPSS and SAS.
After the data is analyzed, the next step is to interpret the results and visualize them in a way that is easy to understand. This could involve creating charts, graphs, or other visual representations of the data. Data visualization helps to make complex data more understandable and provides a clear picture of the findings.
The final step in the data analysis process is data storytelling. This involves presenting the findings of the analysis in a narrative form that is engaging and easy to understand. Data storytelling is crucial for communicating the results to non-technical audiences and for making data-driven decisions.
Data analysis can be categorized into four main types, each serving a unique purpose and providing different insights. These are descriptive, diagnostic, predictive, and prescriptive analyses.
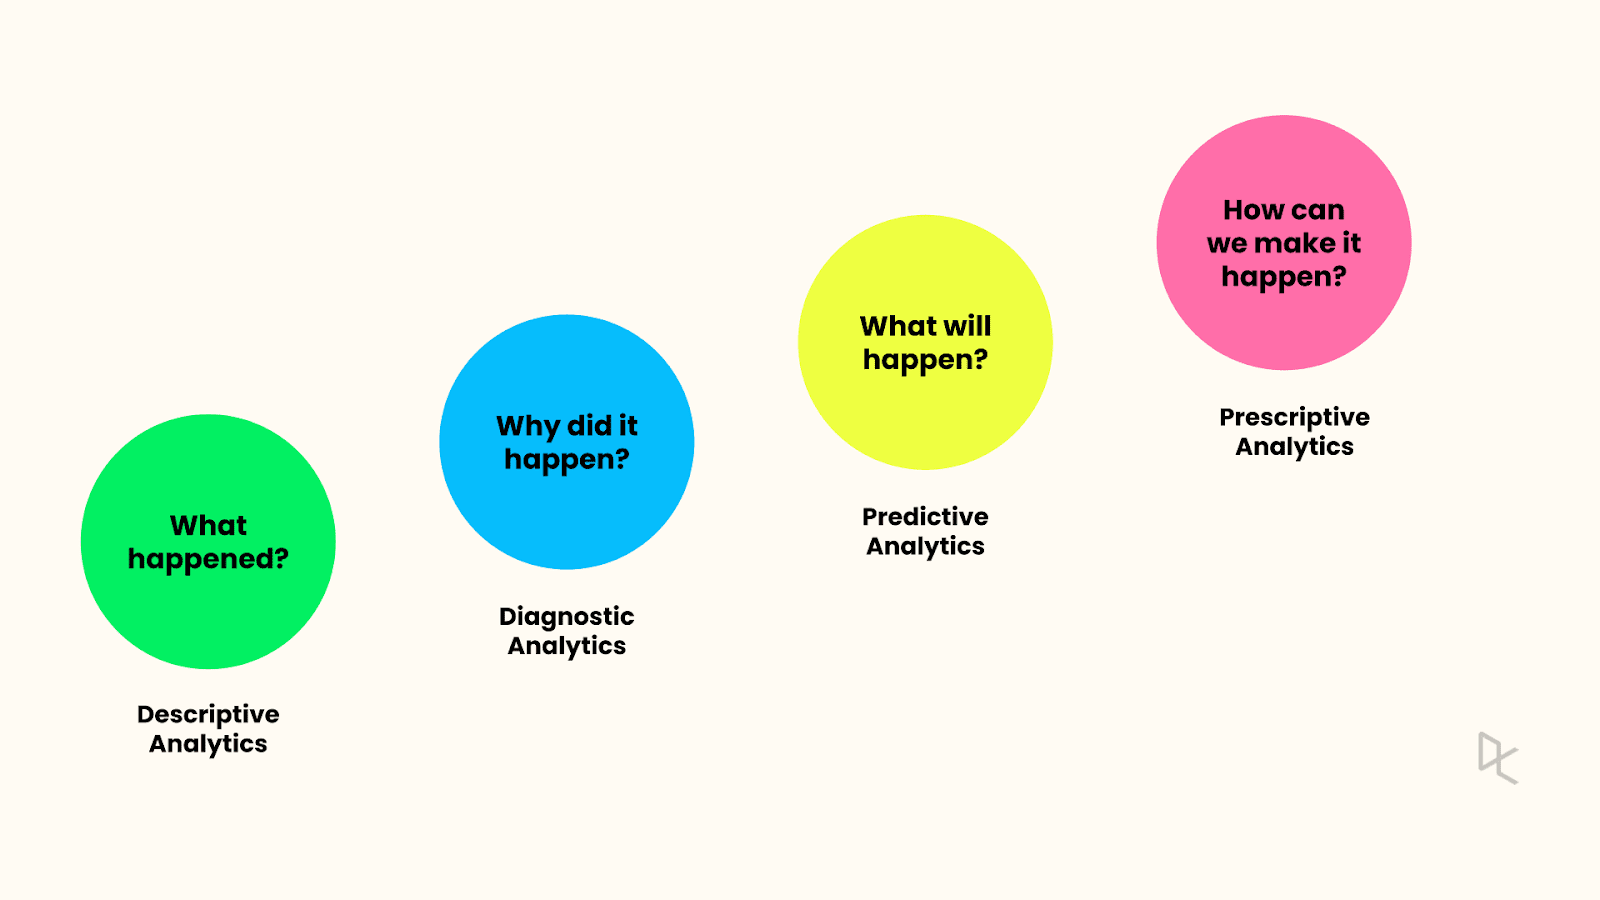
Descriptive analysis, as the name suggests, describes or summarizes raw data and makes it interpretable. It involves analyzing historical data to understand what has happened in the past. This type of analysis is used to identify patterns and trends over time.
For example, a business might use descriptive analysis to understand the average monthly sales for the past year.
Diagnostic analysis goes a step further than descriptive analysis by determining why something happened. It involves more detailed data exploration and comparing different data sets to understand the cause of a particular outcome.
For instance, if a company's sales dropped in a particular month, diagnostic analysis could be used to find out why.
Predictive analysis uses statistical models and forecasting techniques to understand the future. It involves using data from the past to predict what could happen in the future. This type of analysis is often used in risk assessment, marketing, and sales forecasting.
For example, a company might use predictive analysis to forecast the next quarter's sales based on historical data.
Prescriptive analysis is the most advanced type of data analysis. It not only predicts future outcomes but also suggests actions to benefit from these predictions. It uses sophisticated tools and technologies like machine learning and artificial intelligence to make recommendations.
For example, a prescriptive analysis might suggest the best marketing strategies to increase future sales.
In the table below, you can see a comparison of the different types of data analysis:
| Type of Analysis | Key Question | Focus | Methodology | Business Example |
|---|---|---|---|---|
| Descriptive | What happened? | Hindsight (The Past) | Data Aggregation, Summary Statistics | A dashboard showing that monthly sales dropped by 15% in Q3. |
| Diagnostic | Why did it happen? | Insight (The Cause) | Drill-down, Discovery, Correlation | Identifying that the Q3 drop was caused by a competitor's price cut in a specific region. |
| Predictive | What is likely to happen? | Foresight (The Future) | Regression Analysis, Forecasting Models | Forecasting that sales will drop another 5% in Q4 if no action is taken. |
| Prescriptive | What should we do? | Optimization (The Action) | Machine Learning, Simulation, AI Recommendation | An AI system automatically suggesting a 10% discount to loyal customers to recover the lost revenue. |
There are numerous techniques used in data analysis, each with its unique purpose and application. Here, we will discuss some of the most commonly used techniques, including exploratory analysis, regression analysis, factor analysis, and others.
Exploratory analysis is used to understand the main characteristics of a data set. It is often used at the beginning of a data analysis process to summarize the main aspects of the data, check for missing data, and test assumptions. This technique involves visual methods such as scatter plots, histograms, and box plots.
You can learn more about exploratory data analysis with our course, covering how to explore, visualize, and extract insights from data using Python.
Regression analysis is a statistical method used to understand the relationship between a dependent variable and one or more independent variables. It is commonly used for forecasting, time series modeling, and finding the causal effect relationships between variables.
We have some helpful tutorials, such as simple linear regression, as well as technology-specific ones: Essentials of Linear Regression in Python and How to Do Linear Regression in R. Linear regression is worth knowing in detail because it is one of the most widely used techniques for understanding relationships and making predictions.
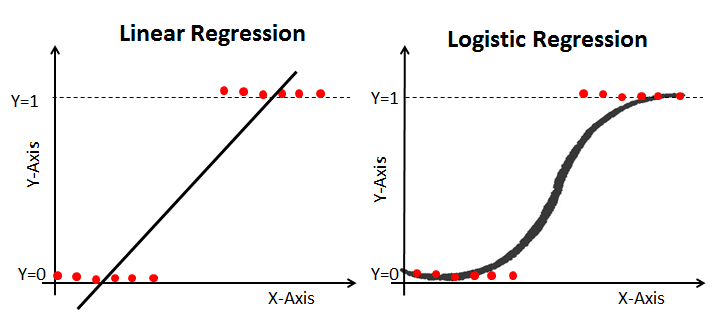
Linear and logistic regression
Factor analysis is a technique used to reduce a large number of variables into fewer factors. The factors are constructed in such a way that they capture the maximum possible information from the original variables. This technique is often used in market research, customer segmentation, and image recognition.
Learn more about factor analysis in R with our course, which explores latent variables, such as personality, using exploratory and confirmatory factor analyses.
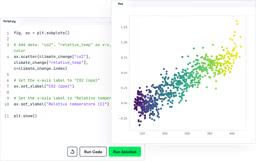
Monte Carlo simulation is a technique that uses probability distributions and random sampling to estimate numerical results. It is often used in risk analysis and decision-making where there is significant uncertainty.
We have a tutorial that explores Monte Carlo methods in R, as well as a course on Monte Carlo simulations in Python, which can estimate a range of outcomes for uncertain events.
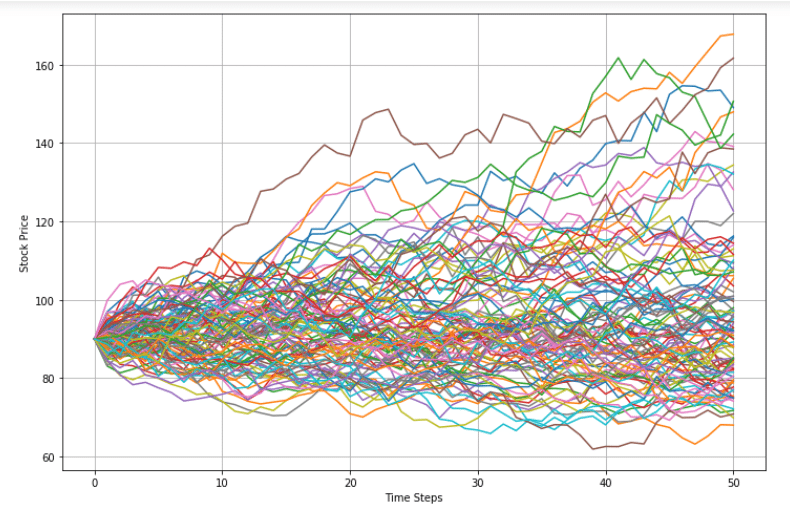
Example of a Monte Carlo simulation
Cluster analysis is a technique used to group a set of objects in such a way that objects in the same group (called a cluster) are more similar to each other than to those in other groups. It is often used in market segmentation, image segmentation, and recommendation systems.
You can explore a range of clustering techniques, including hierarchical clustering and k-means clustering, in our Cluster Analysis in R course.
Cohort analysis is a subset of behavioral analytics that takes data from a given dataset and groups it into related groups for analysis. These related groups, or cohorts, usually share common characteristics within a defined time span. This technique is often used in marketing, user engagement, and customer lifecycle analysis.
Our course, Customer Segmentation in Python, explores a range of techniques for segmenting and analyzing customer data, including cohort analysis.
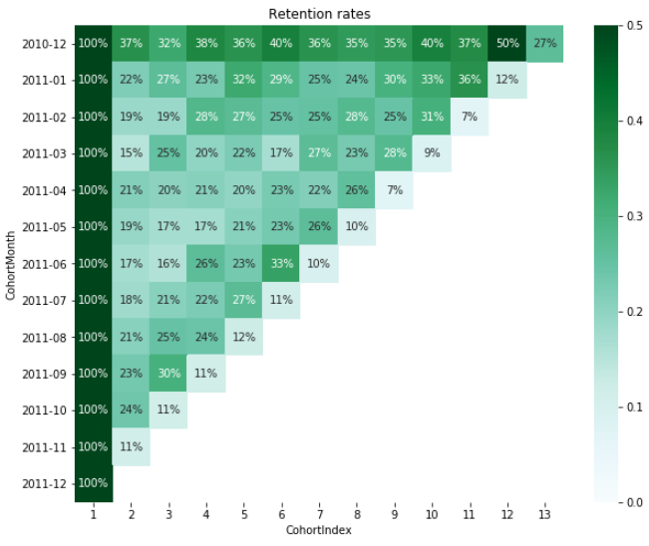
Graph showing an example of cohort analysis
Time series analysis is a statistical technique that deals with time series data, or trend analysis. It is used to analyze the sequence of data points to extract meaningful statistics and other characteristics of the data. This technique is often used in sales forecasting, economic forecasting, and weather forecasting.
Our Time Series with Python skill track and Forecasting in R course takes you through how to manipulate and analyze time series data, working with a variety of different libraries.
Sentiment analysis, also known as opinion mining, uses natural language processing, text analysis, and computational linguistics to identify and extract subjective information from source materials. It is often used in social media monitoring, brand monitoring, and understanding customer feedback.
To get familiar with sentiment analysis in Python, you can take our online course, which will teach you how to perform an end-to-end sentiment analysis.
In 2026, AutoML has become a standard "copilot" for data professionals. It automates the time-consuming process of selecting algorithms and tuning hyperparameters. Analysts now use AutoML to generate high-quality baseline models rapidly, allowing them to focus their manual efforts on feature engineering and strategic refinement.
Modern analysis extends far beyond spreadsheets. This technique involves extracting insights from non-tabular data like images, video feeds, and audio recordings using Deep Learning and Computer Vision. It is essential for tasks like brand monitoring in video content or medical imaging diagnosis.
Generative AI and large language models (LLMs) are transforming how analysts interact with data in 2026. Analysts routinely use AI assistants to write SQL queries from natural language prompts, generate Python code for data transformations, and create visualizations automatically. Platform-native AI copilots in Power BI, Tableau, and Databricks allow analysts to focus on interpreting results and making strategic decisions rather than writing boilerplate code.
However, responsible use of AI in analysis requires validating all AI-generated outputs, understanding the underlying methodology, and maintaining data governance practices. AI accelerates the workflow but does not replace the analyst's judgment and domain expertise.
To learn best practices on how to use AI in data analysis workflows, make sure to check out our guides on Using ChatGPT for Data Science Projects and Prompt Engineering.
In the realm of data analysis, various tools are available that meet different needs, complexities, and levels of expertise. They range from programming languages like Python and R to visualization software like Power BI and Tableau. Let's take a closer look at some of these tools.
| Tool | Category | Best For | Skill Level |
|---|---|---|---|
| Python | Programming | Custom analysis, machine learning, automation | Intermediate |
| R | Programming | Statistical computing, academic research | Intermediate |
| SQL | Query language | Database querying, data extraction | Beginner |
| Power BI | BI & Visualization | Business dashboards, Microsoft ecosystem | Beginner |
| Tableau | BI & Visualization | Advanced visualization, large datasets | Beginner |
| Excel | Spreadsheet | Quick analysis, ad-hoc reporting, prototyping | Beginner |
Comparison of popular data analysis tools
Python is a high-level, general-purpose programming language that has become a favorite among data analysts and data scientists. Its simplicity and readability, coupled with a wide range of libraries like pandas, NumPy, Matplotlib, and Polars, make it an excellent tool for data analysis and data visualization. Modern Python workflows now rely heavily on AI Coding Assistants to generate boilerplate code and debug complex scripts instantly.
R is a programming language and free software environment specifically designed for statistical computing and graphics. It is widely used among statisticians and data miners for developing statistical software and data analysis. R provides a wide variety of statistical and graphical techniques, including linear and nonlinear modeling, classical statistical tests, time-series analysis, and more.
SQL (Structured Query Language) is a standard language for managing and manipulating databases. It is used to retrieve and manipulate data stored in relational databases. SQL is essential for tasks that involve data management or manipulation within databases.
Power BI is a business analytics tool developed by Microsoft. It provides interactive visualizations with self-service business intelligence capabilities. Power BI is used to transform raw data into meaningful insights through easy-to-understand dashboards and reports.
Tableau is a powerful data visualization tool used in the Business Intelligence industry. It allows you to create interactive and shareable dashboards, which depict trends, variations, and density of the data in the form of charts and graphs.
Microsoft Excel is one of the most widely used tools for data analysis. It offers a range of features for data manipulation, statistical analysis, and visualization. Excel's simplicity and versatility make it a great tool for both simple and complex data analysis tasks.
Data analysis, whether on a small or large scale, can have a profound impact on business performance. It can drive significant changes, leading to improved efficiency, increased profitability, and a deeper understanding of market trends and customer behavior.
Data analysis allows businesses to make informed decisions based on facts, figures, and trends, rather than relying on guesswork or intuition. It provides a solid foundation for strategic planning and policy-making, ensuring that resources are allocated effectively and that efforts are directed towards areas that will yield the most benefit.
For small businesses, even simple data analysis can lead to significant improvements. For example, analyzing sales data can help identify which products are performing well and which are not. This information can then be used to adjust marketing strategies, pricing, and inventory management, leading to increased sales and profitability.
For larger businesses, the impact of data analysis can be even more profound. Big data analysis can uncover complex patterns and trends that would be impossible to detect otherwise. This can lead to breakthrough insights, driving innovation and giving the business a competitive edge.
For example, a large retailer might use data analysis to optimize its supply chain, reducing costs and improving efficiency. Or a tech company might use data analysis to understand user behavior, leading to improved product design and better user engagement.
In today's data-driven world, the ability to analyze and interpret data is a critical skill. Businesses that can harness the power of data analysis are better positioned to adapt to changing market conditions, meet customer needs, and drive growth and profitability.
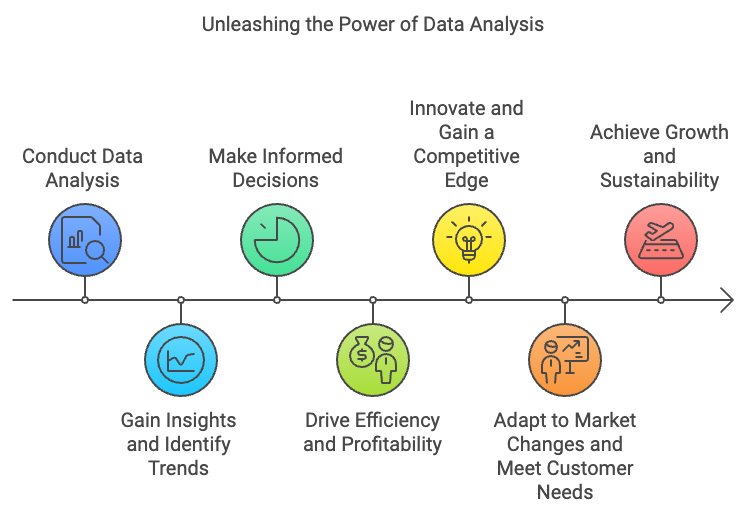
Created using Napkin.AI
Build a data-driven workforce with DataCamp for business
To thrive in data analysis, you must build a strong foundation of knowledge, sharpen practical skills, and accumulate valuable experience. Start with statistics, mathematics, and programming and tackle real-world projects. Then, gain domain expertise, and connect with professionals in the field. Combine expertise, skills, and experience for a successful data analysis career.
Richie Cotton, Data Evangelist at DataCamp
Top Data Analysis Courses
Course
Course
Course
blog
Joleen Bothma
9 min
blog
Javier Canales Luna
14 min
blog
Matt Crabtree
15 min
blog
Matt Crabtree
15 min
blog
Matt Crabtree
9 min
blog
Joleen Bothma
10 min