Analyzing European Championship Soccer Data in Power BI
Join Iason, a Curriculum Manager at DataCamp, in creating a Power BI dashboard of historical information from the UEFA European Football Championship.

Iason Prassides
無料アカウントを作成する
練習とトラックであなたの進捗を記録しましょう。
Googleで登録続行すると、次に同意したものとみなされます: 利用規約、 プライバシーポリシー 、およびデータが米国内に保管されることに同意したものとみなされます。関連

ブログ
Sports Analytics: How I Predicted the EURO 2024 Final
This article explores the application of sports analytics and machine learning to predict EURO 2024 match outcomes, delving into the challenges and methodologies.
 Tom Farnschläder · 15 min
ブログ
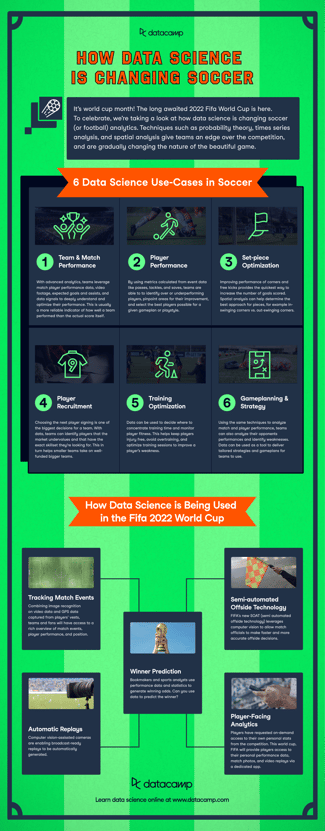
How Data Science is Changing Soccer
With the Fifa 2022 World Cup upon us, learn about the most widely used data science use-cases in soccer.
 Richie Cotton · 3 min

チュートリアル
Data Visualization with Power BI
Learn how to analyze and display data using Power BI and make better, more data-driven decisions.
 Parul Pandey · 12 min





Euro 2024 is one of the biggest soccer events of the year, and it's always filled with drama about which teams will progress to the final. By analyzing historical data, we might be able to find patterns and trends in how nations perform.
In this session, you'll join Iason, a Curriculum Manager at DataCamp, in creating a Power BI dashboard of historical information from the UEFA European Football Championship. You'll learn principles of good dashboard design, Power BI tips and tricks, and some footballing insights.
Key Takeaways:
Resources (including code along datasets)