一緒にコーディング:
コードアロング ↗Get Started Analyzing Survey Data with SQL & Python
In this introductory session, you'll explore a survey on business innovation. The focus will be on principles of analyzing survey data, and you'll write some simple SQL for calculations and simple Python for data visualizations.

Richie Cotton
無料アカウントを作成する
練習とトラックであなたの進捗を記録しましょう。
Googleで登録続行すると、次に同意したものとみなされます: 利用規約、 プライバシーポリシー 、およびデータが米国内に保管されることに同意したものとみなされます。関連

コードアロング
Getting Started with Data Analysis in Snowflake using Python and SQL
In this code-along session, you will learn how to use Snowpark Python and SQL to perform data analysis in the Snowflake Data Cloud.
 Vino Duraisamy
コードアロング
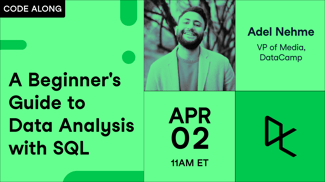
A Beginner's Guide to Data Analysis with SQL
In this session, DataCamp's VP of Media Adel Nehme & co-host of the DataFramed podcast, shows you how to get started with SQL.
 Adel Nehme
コードアロング
Exploratory Data Analysis in SQL for Absolute Beginners
Learn the basics of exploring new datasets using SQL.
 Jasmin Ludolf



Surveys provide a powerful and cost-effective way to gauge opinions and collect feedback from your users or the public. Surveys are so common that every data analyst needs to be able to work with the data from them.
In this introductory session, you'll explore a survey on business innovation. The focus will be on principles of analyzing survey data, and you'll write some simple SQL for calculations and simple Python for data visualizations.
Key Takeaways: