함께 코드 따라하기
코드 따라하기 ↗Analyzing Credit Scores with tidymodels in R
In this live training, you'll find out how to motivate the benefits of dimensionality reduction while exploring predictors of credit scores.

Matt Pickard
무료 계정 만들기
실습 문제하고 트랙하세요.
Google로 계속하기계속 진행하시면 다음 사항에 동의하는 것으로 간주됩니다: 이용약관 및 개인정보 처리방침 그리고 귀하의 데이터가 미국에 저장된다는 점에 동의하는 것으로 간주됩니다.관련
치트 시트
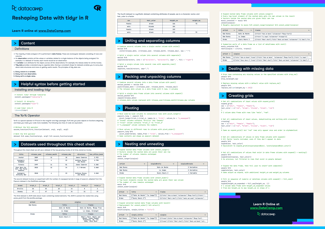
Reshaping Data with tidyr in R
In this cheat sheet, you will learn how to reshape data with tidyr. From separating and combining columns, to dealing with missing data, you'll get the download on how to manipulate data in R.
 Richie Cotton · 6 min

튜토리얼
Getting Started with the Tidyverse: Tutorial
Start analyzing titanic data with R and the tidyverse: learn how to filter, arrange, summarise, mutate and visualize your data with dplyr and ggplot2!
 Hugo Bowne-Anderson · 8 min

튜토리얼
Factor Levels in R
This tutorial takes course material from DataCamp's free Intro to R course and allows you to practice Factors.
 Ryan Sheehy · 6 min




In this live training, you'll find out how to motivate the benefits of dimensionality reduction while exploring predictors of credit scores. Using ggplot2, you’ll see how UMAP can extract information-rich features that help to group credit scores. Then, you'll see how to build UMAP into a tidymodels workflow that fits a decision tree model to predict credit scores. Finally, you'll find out how to evaluate the performance of models with and without UMAP dimensionality reduction.
What will I learn?
Additional Resources
Slides