Programa con nosotros en
Code Along ↗Analyzing Credit Scores with tidymodels in R
In this live training, you'll find out how to motivate the benefits of dimensionality reduction while exploring predictors of credit scores.

Matt Pickard
Crea tu cuenta gratuita
Practica y programa tu progreso.
Continuar con GoogleAl continuar, aceptas nuestra Términos de uso, nuestros Política de privacidad y que tus datos se almacenen en EE. UU.Relacionado
hoja de trucos
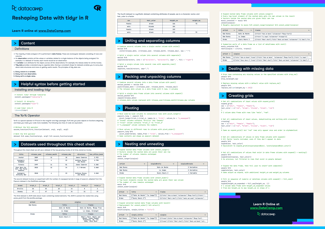
Reshaping Data with tidyr in R
In this cheat sheet, you will learn how to reshape data with tidyr. From separating and combining columns, to dealing with missing data, you'll get the download on how to manipulate data in R.
 Richie Cotton• 6 min

Tutorial
Getting Started with the Tidyverse: Tutorial
Start analyzing titanic data with R and the tidyverse: learn how to filter, arrange, summarise, mutate and visualize your data with dplyr and ggplot2!
 Hugo Bowne-Anderson• 8 min

Tutorial
Factor Levels in R
This tutorial takes course material from DataCamp's free Intro to R course and allows you to practice Factors.
 Ryan Sheehy• 6 min




In this live training, you'll find out how to motivate the benefits of dimensionality reduction while exploring predictors of credit scores. Using ggplot2, you’ll see how UMAP can extract information-rich features that help to group credit scores. Then, you'll see how to build UMAP into a tidymodels workflow that fits a decision tree model to predict credit scores. Finally, you'll find out how to evaluate the performance of models with and without UMAP dimensionality reduction.
What will I learn?
Additional Resources
Slides