함께 코드 따라하기
코드 따라하기 ↗Data Visualization in Python for Absolute Beginners
Learn the basics of how to create an interactive plot using Plotly.

Justin Saddlemyer
무료 계정 만들기
실습 문제하고 트랙하세요.
Google로 계속하기계속 진행하시면 다음 사항에 동의하는 것으로 간주됩니다: 이용약관 및 개인정보 처리방침 그리고 귀하의 데이터가 미국에 저장된다는 점에 동의하는 것으로 간주됩니다.관련
치트 시트
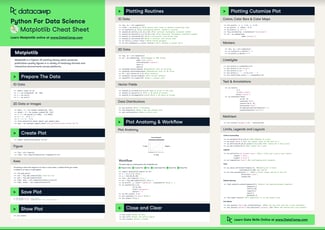
Matplotlib Cheat Sheet: Plotting in Python
This Matplotlib cheat sheet introduces you to the basics that you need to plot your data with Python and includes code samples.
 Karlijn Willems · 6 min

튜토리얼
How to Create a Histogram with Plotly
Learn how to implement histograms in Python using the Plotly data visualization library.
 Kurtis Pykes · 12 min

튜토리얼
Python Plotly Express Tutorial: Unlock Beautiful Visualizations
Learn how to create highly interactive and visually appealing charts with Python Plotly Express.
 Bexruz (Bex) Tuychiev · 10 min




In this live training, you will learn the basics of how to create an interactive plot using Plotly. We will cover different plot types and how to add customizations such as color and labels.
We will end with a geographic visualization of meteorite landings as a capstone project. Justin will provide a template workbook for you so that you can easily follow along as he’s coding.
Key takeaways
Create different plot types in Python using Plotly
Customize your plot with colors and labels
Create more advanced visualizations from tabular data