与我们一起编写代码,平台:
跟写代码 ↗Data Visualization in Python for Absolute Beginners
Learn the basics of how to create an interactive plot using Plotly.

Justin Saddlemyer
相关
速查表
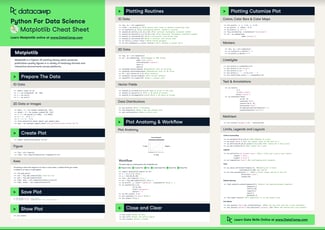
Matplotlib Cheat Sheet: Plotting in Python
This Matplotlib cheat sheet introduces you to the basics that you need to plot your data with Python and includes code samples.
 Karlijn Willems · 6 min

教程
How to Create a Histogram with Plotly
Learn how to implement histograms in Python using the Plotly data visualization library.
 Kurtis Pykes · 12 min

教程
Python Plotly Express Tutorial: Unlock Beautiful Visualizations
Learn how to create highly interactive and visually appealing charts with Python Plotly Express.
 Bexruz (Bex) Tuychiev · 10 min




In this live training, you will learn the basics of how to create an interactive plot using Plotly. We will cover different plot types and how to add customizations such as color and labels.
We will end with a geographic visualization of meteorite landings as a capstone project. Justin will provide a template workbook for you so that you can easily follow along as he’s coding.
Key takeaways
Create different plot types in Python using Plotly
Customize your plot with colors and labels
Create more advanced visualizations from tabular data