Data Visualization in Python for Absolute Beginners
Learn the basics of how to create an interactive plot using Plotly.
Feb 2023
RelatedSee MoreSee More
cheat-sheet
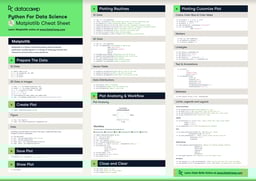
Matplotlib Cheat Sheet: Plotting in Python
This Matplotlib cheat sheet introduces you to the basics that you need to plot your data with Python and includes code samples.
Karlijn Willems
6 min
tutorial
How to Create a Histogram with Plotly
Learn how to implement histograms in Python using the Plotly data visualization library.
Kurtis Pykes
12 min
tutorial
Python Plotly Express Tutorial: Unlock Beautiful Visualizations
Learn how to create highly interactive and visually appealing charts with Python Plotly Express.
Bekhruz Tuychiev
10 min
tutorial
Introduction to Plotting with Matplotlib in Python
This tutorial demonstrates how to use Matplotlib, a powerful data visualization library in Python, to create line, bar, and scatter plots with stock market data.
Kevin Babitz
25 min
tutorial
Python Seaborn Tutorial For Beginners: Start Visualizing Data
This Seaborn tutorial introduces you to the basics of statistical data visualization
Moez Ali
20 min
code-along
Exploratory Data Analysis in Python for Absolute Beginners
In this live codealong, you will learn the basics of exploring new datasets
Filip Schouwenaars