Building Dashboards with Plotly and Dash
Adam Schroeder, a Community Manager at Plotly, guides you through the process of building data apps with Plotly and Dash.

Adam Schroeder
Maak je gratis account aan
Oefen en volg je voortgang.
Ga verder met GoogleDoor verder te gaan, accepteer je ons Gebruiksvoorwaarden, onze Privacybeleid en dat je gegevens in de VS worden opgeslagen.Gerelateerd
kort overzicht
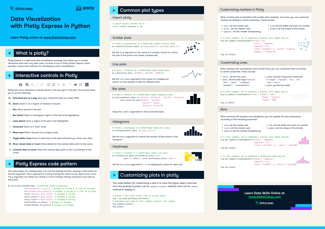
Plotly Express Cheat Sheet
Plotly is one of the most widely used data visualization packages in Python. Learn more about it in this cheat sheet.
 Richie Cotton · 0 min


Tutorial
Python Plotly Express Tutorial: Unlock Beautiful Visualizations
Learn how to create highly interactive and visually appealing charts with Python Plotly Express.
 Bexruz (Bex) Tuychiev · 10 min



Creating interactive dashboards and data applications with Plotly and Dash empowers data leaders to visualize and share insights effectively. Combining Python’s flexibility with Dash’s powerful data app framework, you can build interactive, customizable dashboards that bring your data to life. Understanding how to design these dashboards with best practices ensures they deliver maximum impact.
In this hands-on code-along session, Adam Schroeder, a Community Manager at Plotly, guides you through the process of building data apps with Plotly and Dash. You’ll learn how to create data visualizations with Python, design interactive dashboards, and implement best practices for impactful dashboard creation. This session is ideal for data leaders looking to enhance their skills in building dynamic, user-friendly dashboards.
Key Takeaways:
Session Resources