
随时掌握这份速查表
下载 PDFHelpful syntax to know
Installing and loading dplyr
# Install dplyr through tidyverse
install.packages(“tidyverse”)
# Install it directly
install.packages(“dplyr”)
# Load dplyr into R
library(dplyr)The %>% operator
%>% is a special operator in R found in the magrittr and dplyr packages. %>% lets you pass objects to functions elegantly, and helps you make your code more readable. Consider this example of choosing columns a and b from the dataframe df
# Without the %>% operator
select(df, a, b)
# By using the %>% operator
df %>% select(a, b)Dataset used throughout this cheat sheet
Throughout this cheat sheet, we will be using this example dataset called airbnb_listings, containing Airbnb listings with data on their location, year listed, number of rooms, and more.
| airbnb_listings | ||||
| listing_id | city | country | number_of_rooms | year_listed |
| 1 | Paris | France | 5 | 2018 |
| 2 | Tokyo | Japan | 2 | 2017 |
| 3 | New York | USA | 2 | 2022 |
Transforming data with dplyr
Basic column operations with dplyr
# Select one or more columns with select()
airbnb_listings %>%
select(listing_id, city)
# Select columns based on start characters
airbnb_listings %>%
select(starts_with(“c”))
# Select columns based on end characters
airbnb_listings %>%
select(ends_with(“s”))
# Select all but one column (e.g., listing_id)
airbnb_listings %>%
select(-listing_id)
# Select all columns within a range
airbnb_listings %>%
select(country : year_listed)
# Reorder columns using relocate()
airbnb_listings %>%
relocate(city, country)
# Rename a column using rename()
airbnb_listings %>%
rename(year = year_listed)
# Select columns matching a regular expression
airbnb_listings %>%
select(matches(“(.n.) | (n.)”))Creating new columns with dplyr
# Create a time_on_market column using the difference of today’s year and the year_listed
airbnb_listings %>%
mutate(time_on_market = 2022 - year_listed)
# Create a full_address column by combining city and country
airbnb_listings %>%
transmute(full_address = paste(city, country))
# Add the number of observations for a column (e.g., number of listings per city)
airbnb_listings %>%
add_count(city)
Working with rows
# Filter rows on one condition (e.g., country)
airbnb_listings %>%
filter(country == "France")
# Filter on two OR more conditions (country OR number_of_rooms)
airbnb_listings %>%
filter(country == "France" | number_of_rooms > 3)
# Filter on two AND more conditions (country AND number_of_rooms)
airbnb_listings %>%
filter(country == "France" & number_of_rooms > 3)
# Filter by checking if a value exists in another set of values
airbnb_listings %>%
filter(country %in% c( "Japan", "France"))
# Filter rows based on index of rows (e.g., first 3 rows)
Airbnb_listings %>%
slice(1:3)
# Sort rows by values in a column in ascending order
airbnb_listings %>%
arrange(number_of_rooms)
# Sort rows by values in a column in descending order
airbnb_listings %>%
arrange(desc(city))
# Remove duplicate rows in all the dataset
airbnb_listings %>%
distinct()
# Find unique values in the country column
airbnb_listings %>%
distinct(country)
# Select rows based on top-n values of a column (e.g., top 3 listings with the highest amount of rooms)
airbnb_listings %>%
top_n(3, number_of_rooms)Aggregating data with dplyr
# Count groups within a column (e.g., count number of cities in airbnb_listings)
airbnb_listings %>%
count(city)
# Count groups within a column and return sorted
airbnb_listings %>%
count(country, sort = TRUE)
# Return the total sum of values for a column (e.g., total number of rooms)
airbnb_listings %>%
summarise(total_rooms=sum(number_of_rooms))
# Return the average of values for a column (e.g, average number of rooms in a given listing)
airbnb_listings %>%
summarise(avg_room = mean(number_of_rooms))
# Return a custom summary statistic (e.g., average amount of time a listing stays on)
airbnb_listings %>%
summarise(average_listing_duration = 2022 - mean(year_listed))
# Group by a variable and return counts of each group (e.g., number of listings by country)
airbnb_listings %>%
group_by(country) %>%
summarise(n = n())
# Group by a variable and return the average value per group (e.g., average number of rooms in listings per city)
airbnb_listings %>%
group_by(city) %>%
summarise(avg_rooms = mean(number_of_rooms))Combining tables in dplyr
df_1
| x1 | x2 |
| 1 | 2 |
| 3 | 6 |
| 5 | 4 |
df_2
| x1 | x2 |
| 1 | 2 |
| 4 | 6 |
| 2 | 5 |
# Appending a table to the right side (horizontal) of another
bind_cols(df_1, df_2)
# Appending a table to the bottom (vertical) of another
bind_rows(df_1, df_2)
# Combining rows that exist in both tables and dropping duplicates
union(df_1, df_2)
# Finding identical columns in both tables
intersect(df_1, df_2)
# Finding rows that don’t exist in another table
setdiff(df_1, df_2)
Joining tables with dplyr
To showcase joins in dplyr, we’ll use an additional dataset containing details on *host_listings* for airbnb listings
| airbnb_listings | ||||
| listing_id | city | country | number_of_rooms | year_listed |
| 1 | Paris | France | 5 | 2018 |
| 2 | Tokyo | Japan | 2 | 2017 |
| 3 | New York | USA | 2 | 2022 |
| host_listings | |||
| host_id | name | listing_id | number_of_reviews |
| 1 | Jen Bricker | 1 | 34 |
| 2 | Richie Cotton | 2 | 12 |
| 3 | Raven Todd Dasilva | 3 | 55 |
Joining tables with dplyr
Inner Join
# Returns only records where a joining field finds a match in both tables.
airbnb_listings %>%
inner_join(host_listings, by = "listing_id")Left Join
# Returns rows in left table and missing values for any columns from the right table where joining field did not find a match
host_listings %>%
left_join(airbnb_listings, by = "listing_id")Right Join
# Returns rows in right table and missing values for any columns from the left table where joining field did not find a match
host_listings %>%
right_join(airbnb_listings, by = "listing_id")
Full Join
# Returns all records from both table, irrespective of whether there is a match on the joining field
host_listings %>%
full_join(airbnb_listings, by = "listing_id")
Anti Join
# Returns records in the first table and excludes matching values from the second table
airbnb_listings %>%
anti_join(host_listings, by = "listing_id")

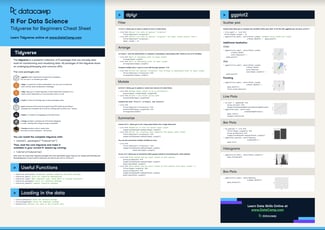
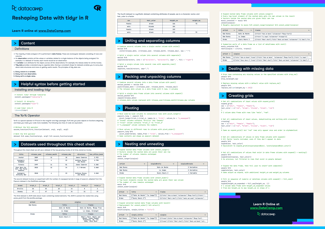


Dplyr is one of the most widely used tools in data analysis in R. Part of the tidyverse, it provides practitioners with a host of tools and functions to manipulate data, transform columns and rows, calculate aggregations, and join different datasets together.
In this cheat sheet, you'll find a handy list of functions covering dplyr functions —all collected from our Data Manipulation with dplyr course.