courses
개발자를 위한 AI 보조 코딩
1 시 30 분
9.7K
GPT-5.6 is OpenAI's latest model family, available in three tiers: Sol for deep reasoning, Terra for balanced everyday work, and Luna for fast, lightweight tasks.
Alongside it, OpenAI has released ChatGPT Work, a project workspace inside ChatGPT built for multi-step, file-driven workflows.
ChatGPT Work lets you upload files, maintain context across prompts, and generate code, visualizations, and interactive tools, all in your browser with no local setup needed.
In this guide, I will show you how to build a complete bank customer churn prediction project entirely inside ChatGPT Work.
We will upload a real-world dataset, audit and clean the data, and explore it with visualizations.
Then we will train and compare multiple machine learning models, evaluate the best performer, and deploy an interactive web interface for real-time churn predictions.
By the end, you will have a full project package with cleaned data, charts, model results, and a working demo, all created without ever leaving your browser.
ChatGPT Work is a dedicated agent inside ChatGPT designed for ambitious, multi-step tasks that go far beyond simple Q&A.
It can gather information across your apps and workflows, create finished materials like spreadsheets, slides, documents, and web apps, and stay with complex projects for hours by breaking them into smaller steps and completing them independently.
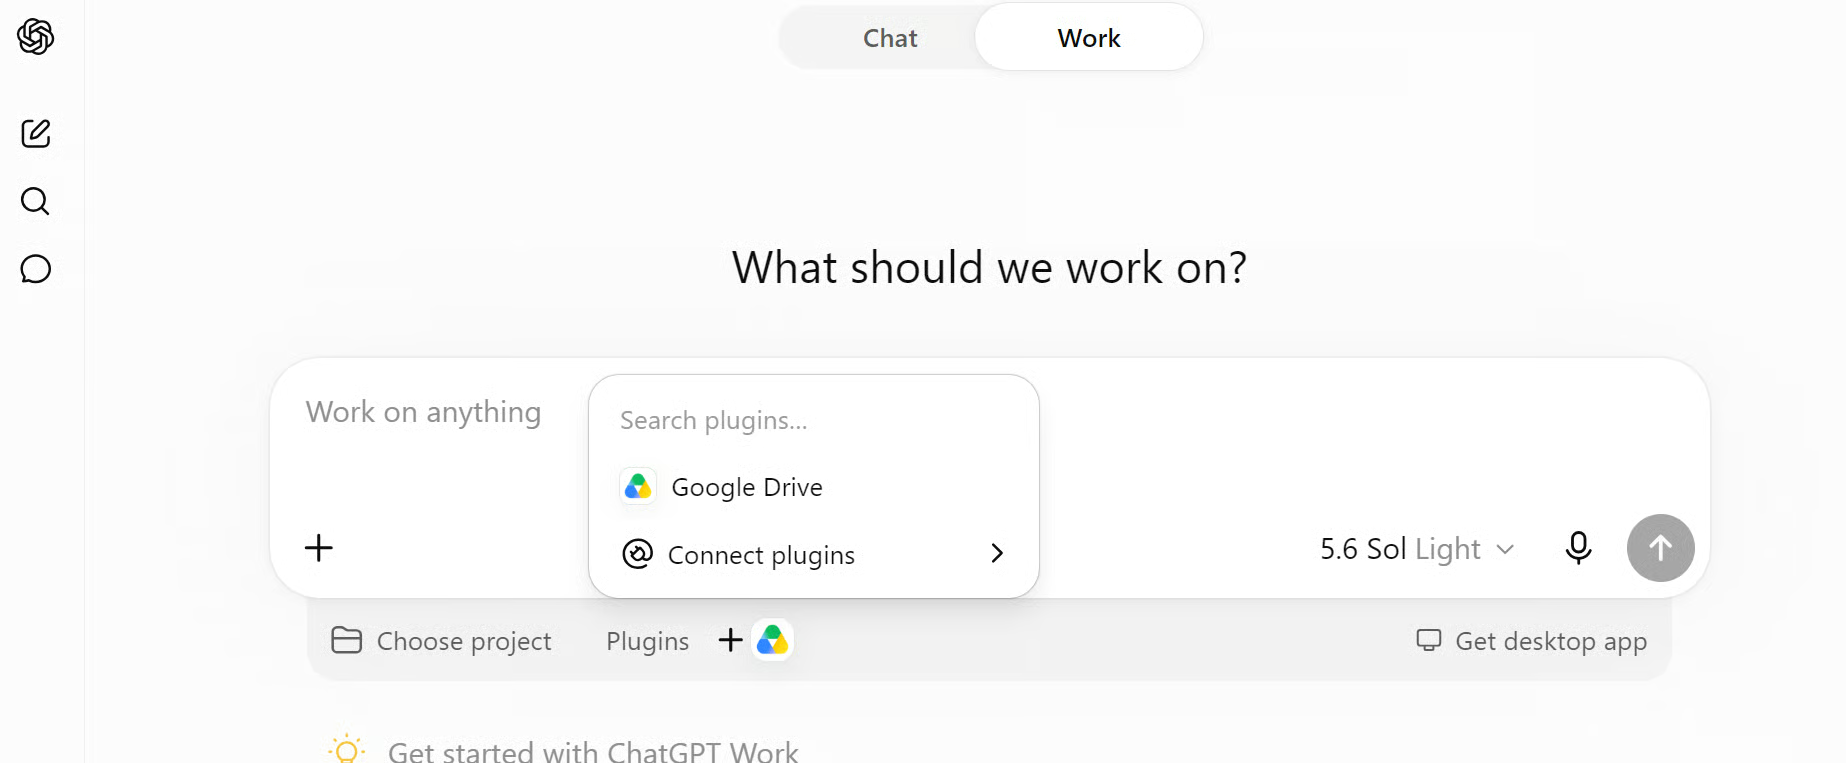
With Codex technology built in, ChatGPT Work moves beyond answering questions to getting real work done across web, mobile, and desktop.
You can follow its progress, answer questions, change direction, and approve important actions as it works.
ChatGPT Work is powered by GPT-5.6, which makes it state-of-the-art at reasoning through multi-step tasks and creating materials that follow your templates and reference files.
It also supports Scheduled Tasks, so it can keep projects moving forward even when you are away, such as turning new messages from Teams or Slack into updated documents and sharing changes with your team.
Every data science project starts with data. In this step, we will create a dedicated workspace in ChatGPT Work and bring in the bank customer churn dataset so we can begin working with it.
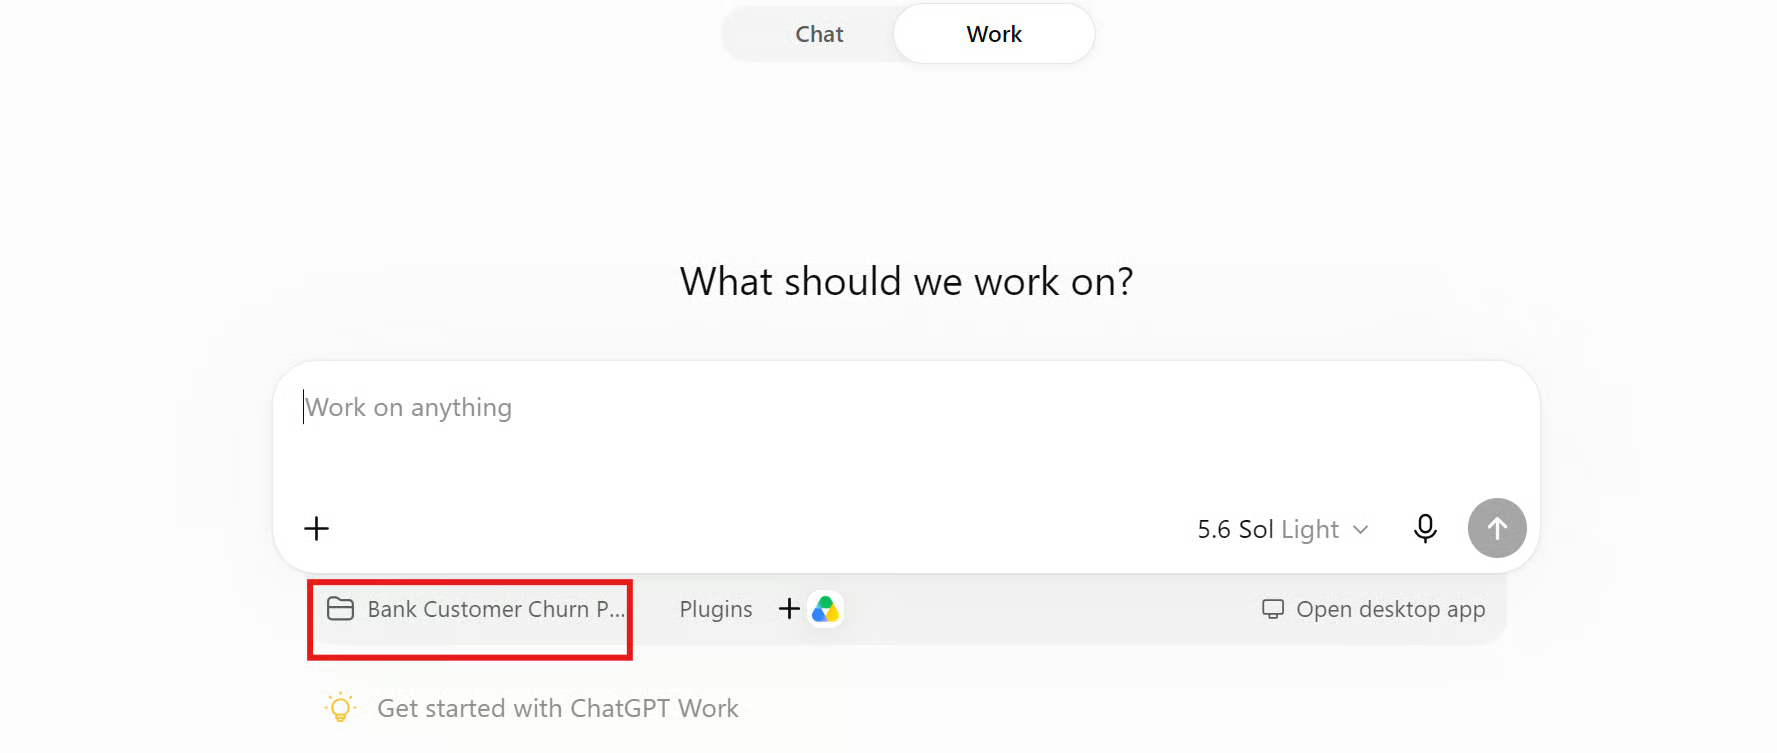
Open ChatGPT in your browser and click the Work tab. Then click Choose Project at the bottom-left of the chat, select New project, name it Bank Customer Churn Prediction.
Also, make sure GPT 5.6 Sol Light is selected, as this is a simple task and we do not need high reasoning.
The interface should show the Work tab active, your project name at the bottom of the chat, and the model dropdown set to 5.6 Sol Light.
Next, download Churn_Modelling.csv from Kaggle.
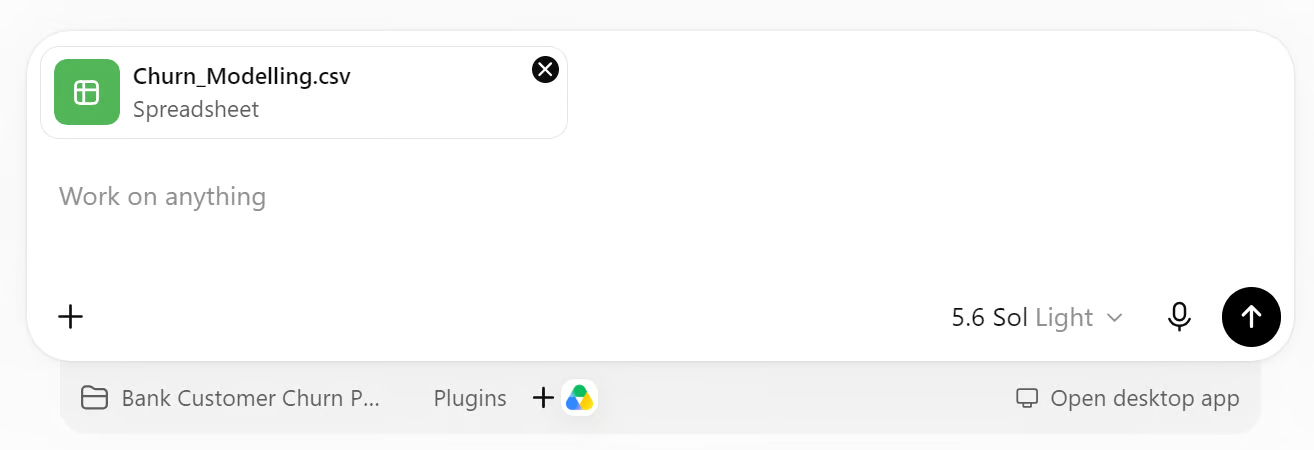
To upload it, click the plus (+) icon in the message input area, select the file from your computer, and attach it to the conversation. The file should appear as a spreadsheet card above the input field, ready to send.
Raw data is rarely perfect. Before we build any models, we need to understand what we are working with and fix any issues that could skew our results.
Paste this prompt in the input box and press enter:
Audit and prepare the dataset for analysis.
Check the number of rows and columns, data types, missing values, duplicate records, invalid values, target distribution, and possible data leakage.
Use Exited as the target variable. Exclude RowNumber, CustomerId, and Surname from the model because they are identifiers.
Treat Geography and Gender as categorical variables.
Preserve the original dataset and explain every cleaning decision.
After sending the prompt, ChatGPT Work will use its built-in skills and tools to read the dataset, understand its structure, and provide a structured audit summary.
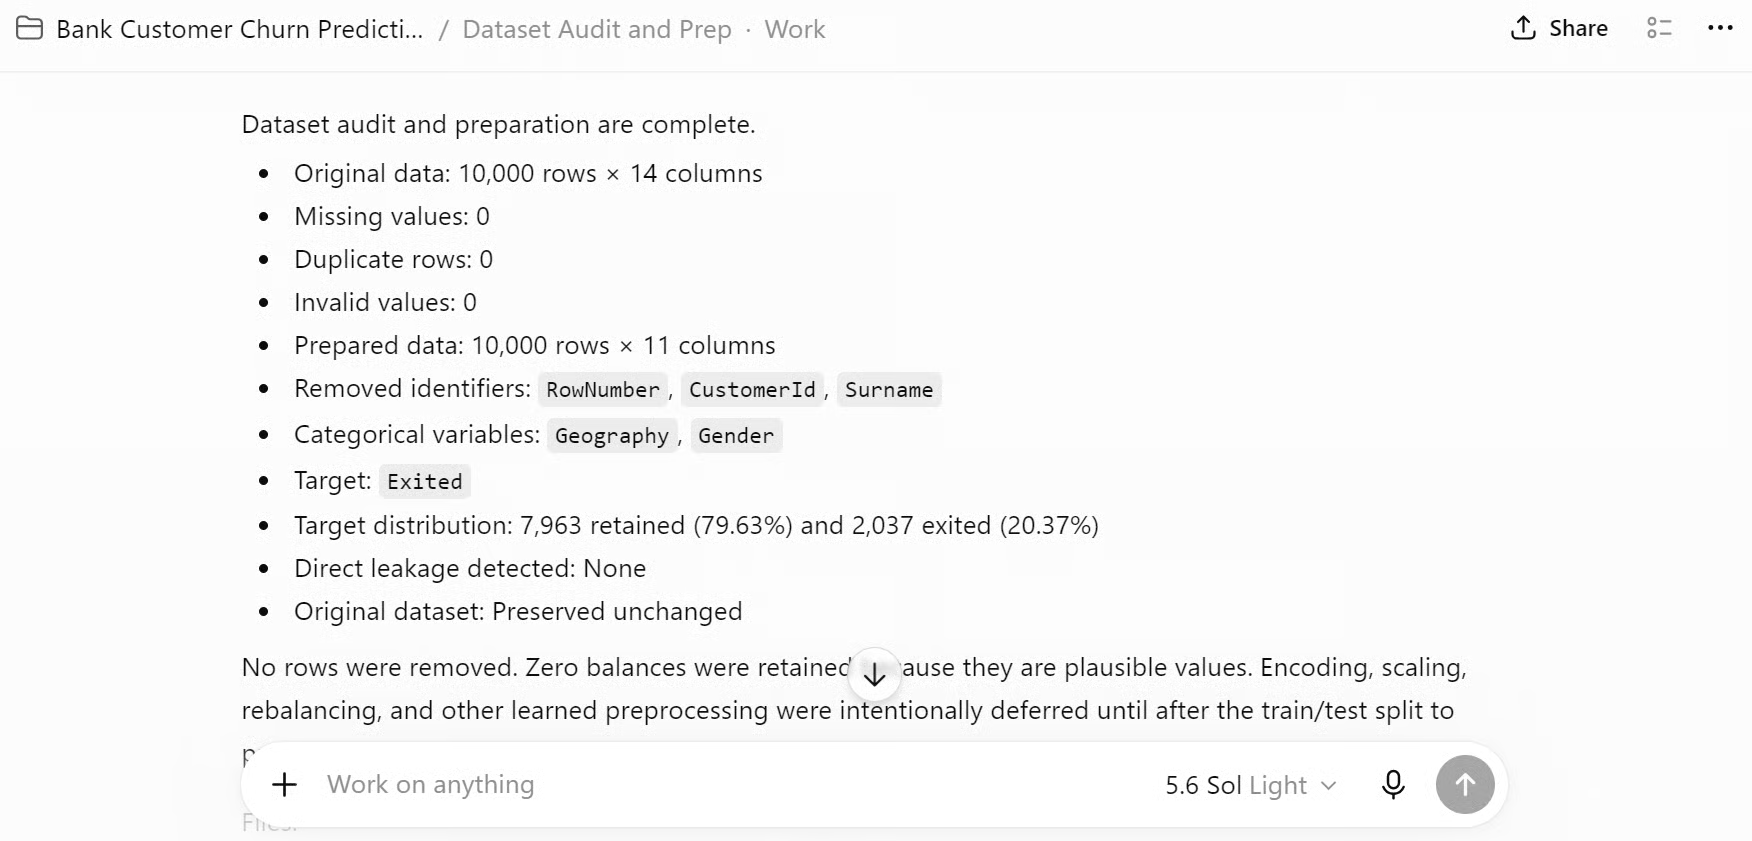
You can also explore the various steps ChatGPT Work took to come up with this audit summary.
These steps are visible in the conversation thread and show how the model analyzed the data, applied validation rules, and reached each conclusion.
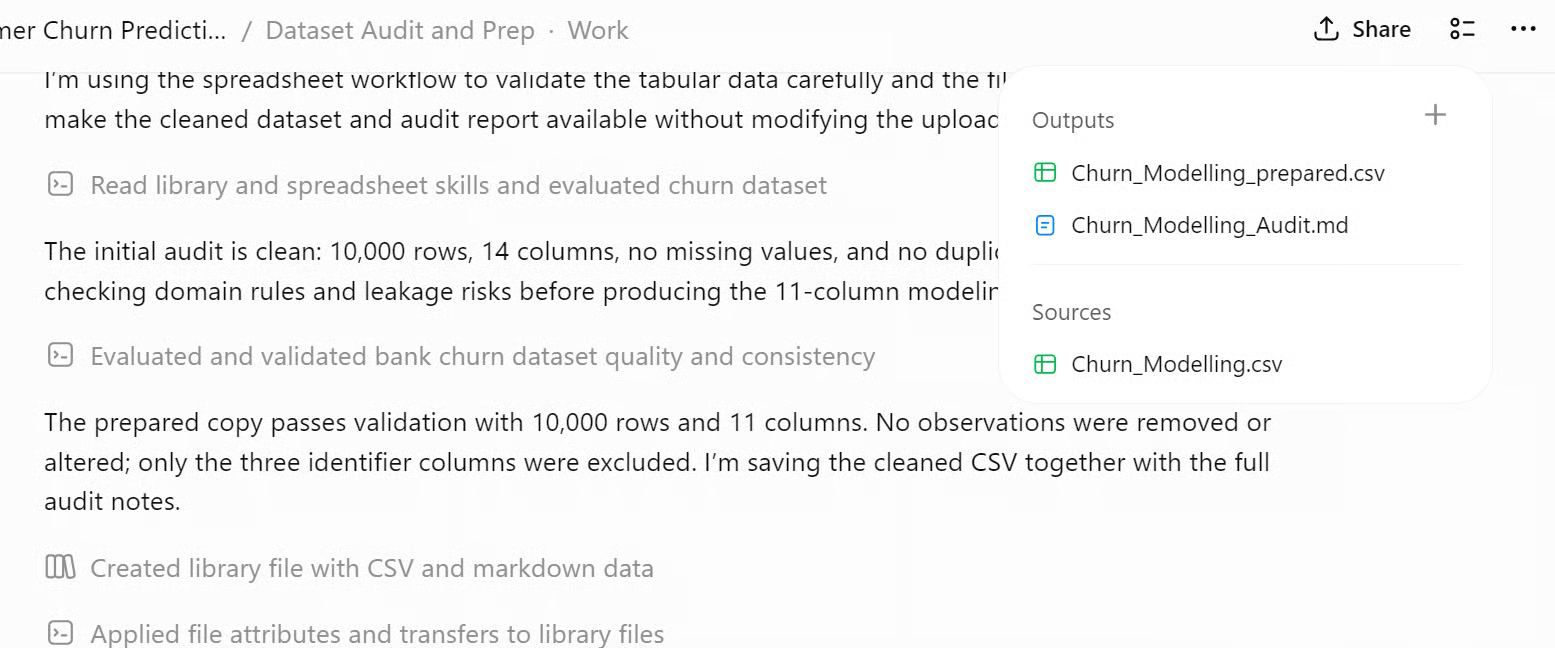
On the top right of the chat, click the bullet point button to open the Outputs panel.
This panel will show two generated files: a cleaned CSV file and a full audit report in markdown format.
Numbers alone do not tell the full story. In this step, we will turn the cleaned data into charts and graphs that reveal patterns in customer churn.
We will create a series of visualizations that show overall churn distribution, break down churn rates by different customer segments, and compare numerical features between customers who stayed and those who exited.
We will also generate a correlation heat map to see how numerical variables relate to each other.
Paste this prompt:
Perform exploratory data analysis and create clear visualizations focused on customer churn.
Begin with a bar chart showing the overall distribution of customers who stayed and customers who exited.
Then visualize churn rates by geography, gender, number of products, credit-card ownership, and active-member status.
Create suitable histograms or box plots to compare age, credit score, account balance, tenure, and estimated salary between customers who stayed and customers who exited.
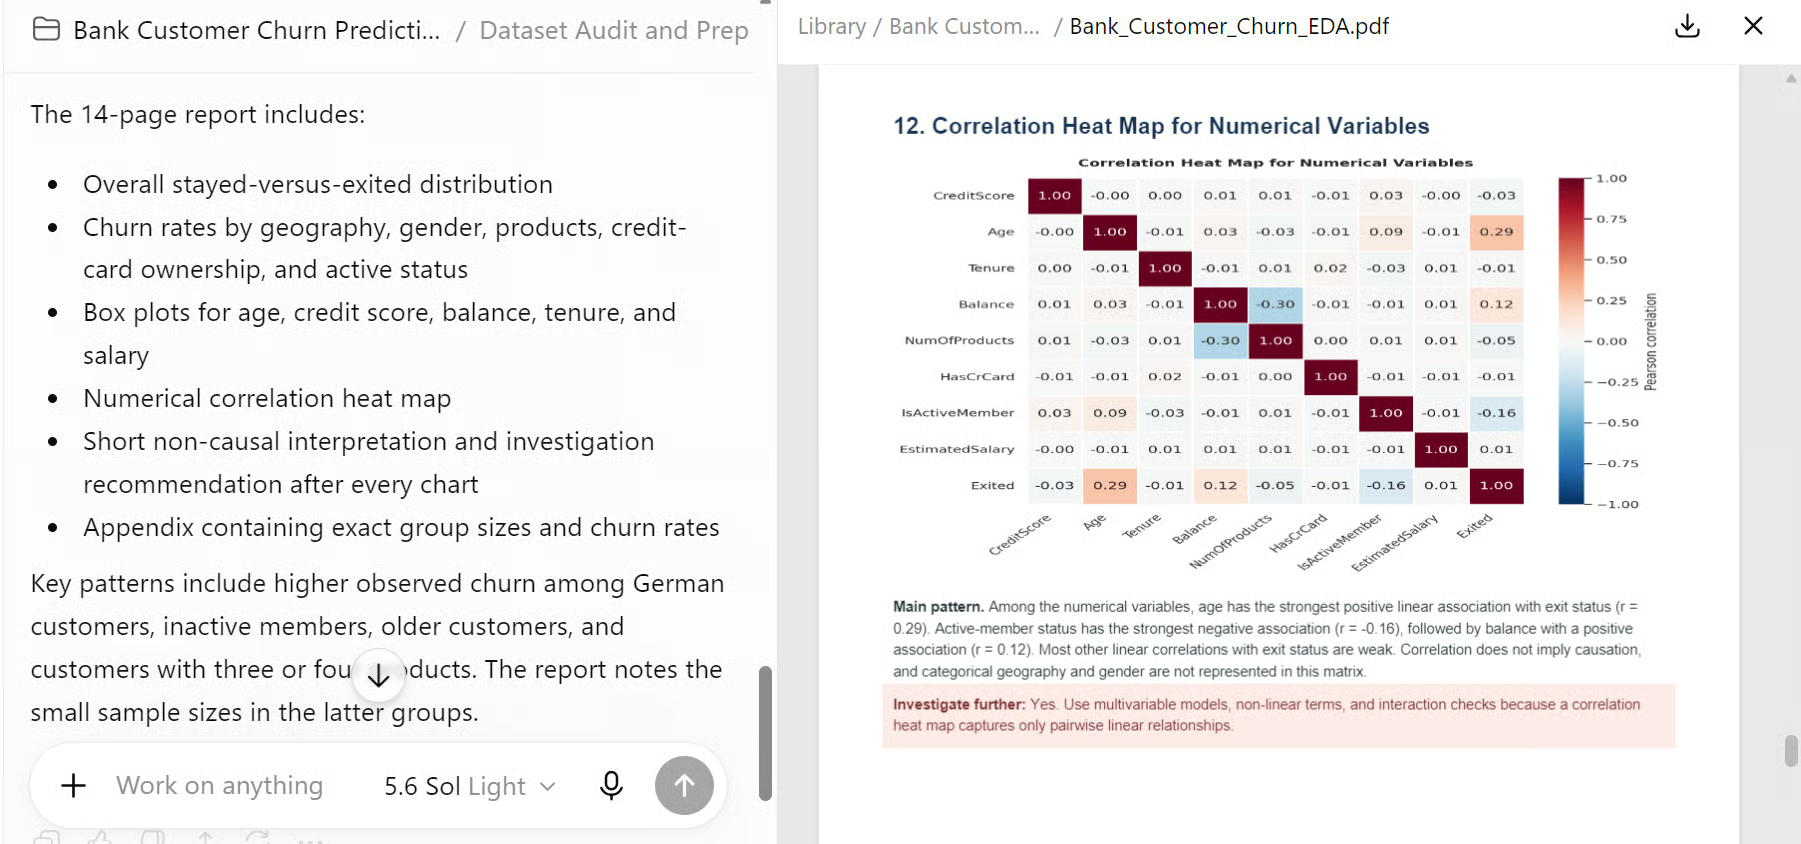
Also, create a correlation heat map for the numerical variables.
Use descriptive chart titles, clearly labeled axes, readable legends, and appropriate chart types.
Report churn rates rather than only customer counts.
After each chart, provide a short explanation of the main pattern and state whether the finding should be investigated further.
Do not describe any relationship as causal.
As a result, ChatGPT Work will generate Python code to perform the analysis and create all the visualizations. It will then compile everything into a professional PDF report. The report will include each chart with its explanation, plus a summary of the key findings.
You can explore the generated files directly within ChatGPT Work or download them to review locally.
The Outputs panel will list the PDF report along with any individual chart files or code notebooks that were created during the process.
Now that we understand the data, it is time to train models that can predict which customers are likely to leave.
We will build a proper machine learning pipeline, compare several algorithms, and pick the best one based on solid metrics.
Paste this prompt:
Build a machine learning pipeline for predicting customer churn.
Use a stratified train-test split and keep the test set untouched during model selection.
Fit all preprocessing steps only on the training data, one-hot encode categorical variables, scale numerical variables where required, and use a fixed random seed.
Compare a dummy classifier, logistic regression, random forest, and gradient boosting model.
Evaluate each model using accuracy, precision, recall, F1 score, ROC-AUC, and PR-AUC.
Present the results in a comparison table and recommend the strongest model.
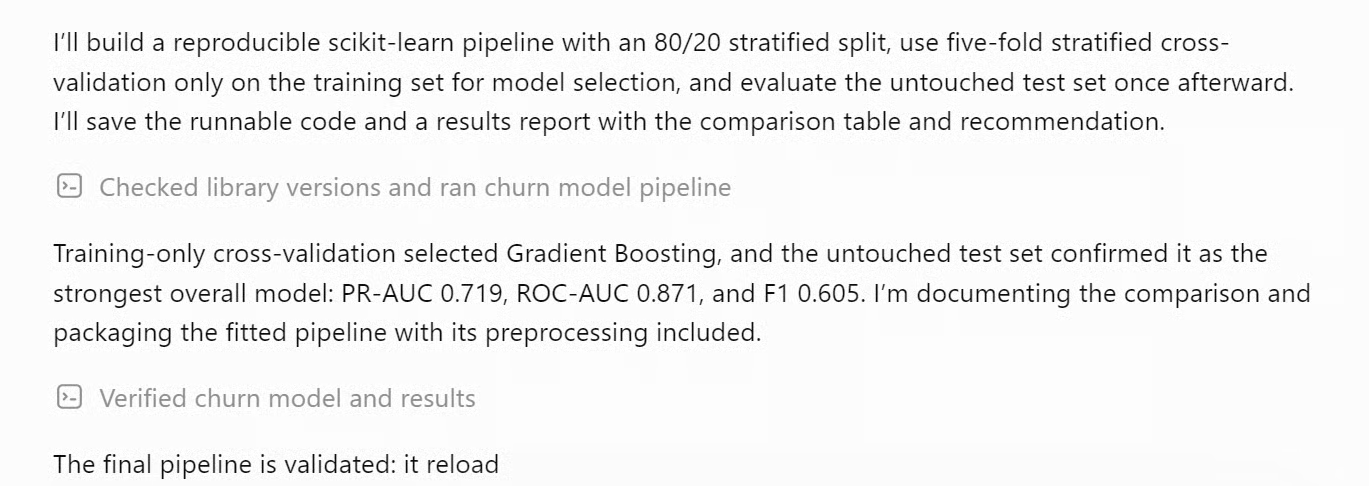
After sending the prompt, ChatGPT Work will generate a reproducible scikit-learn pipeline script and run it.
You will see progress updates in the conversation thread showing each stage: checking libraries, running the pipeline, performing cross-validation on the training set only, and verifying the final results.
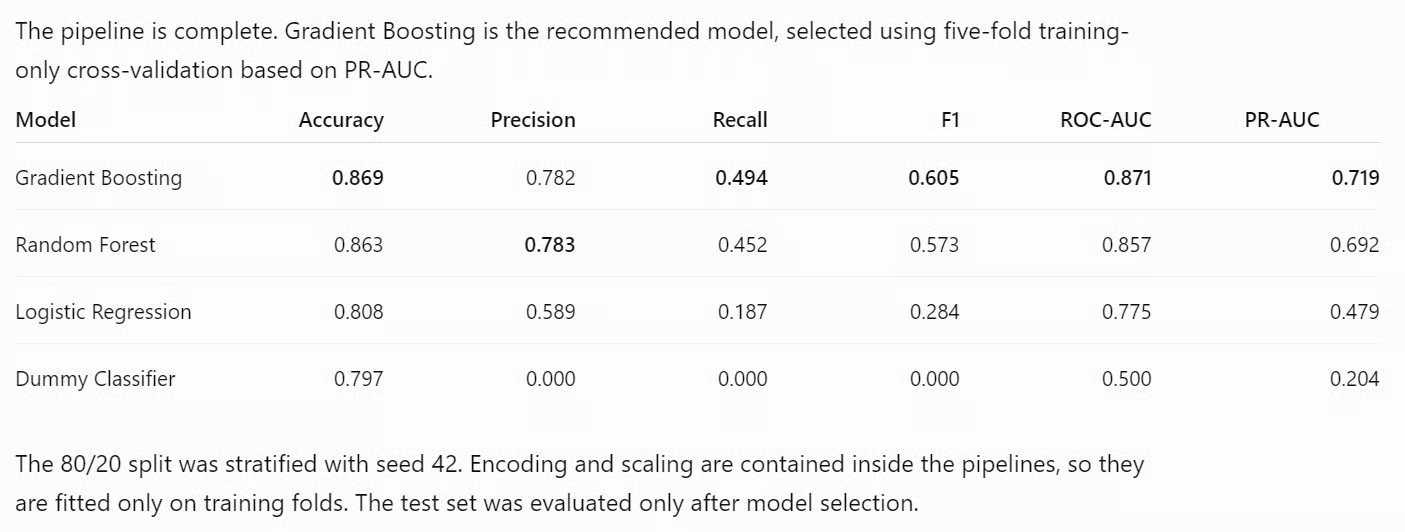
Once complete, you will see a clean comparison table with all four models ranked by their metrics.
The table includes accuracy, precision, recall, F1, ROC-AUC, and PR-AUC for each model.
In this project, the Gradient Boosting model emerges as the strongest performer, leading on PR-AUC and ROC-AUC.
With the best model selected, we now need to see how well it performs on data it has never seen before.
We will run a full evaluation on the untouched test set and create visualizations that make the results easy to understand.
Paste this prompt:
Evaluate the selected model on the untouched test set.
Report the confusion matrix, accuracy, precision, recall, F1 score, ROC-AUC, PR-AUC, false positives, and false negatives.
Create a confusion-matrix heat map, ROC curve, precision-recall curve, and feature-importance chart.
Explain what each visualization means in simple language and identify the most important predictive factors.
Do not claim that any feature causes customer churn.
After sending the prompt, ChatGPT Work will evaluate the Gradient Boosting model on the held-out test set and generate a comprehensive PDF report.
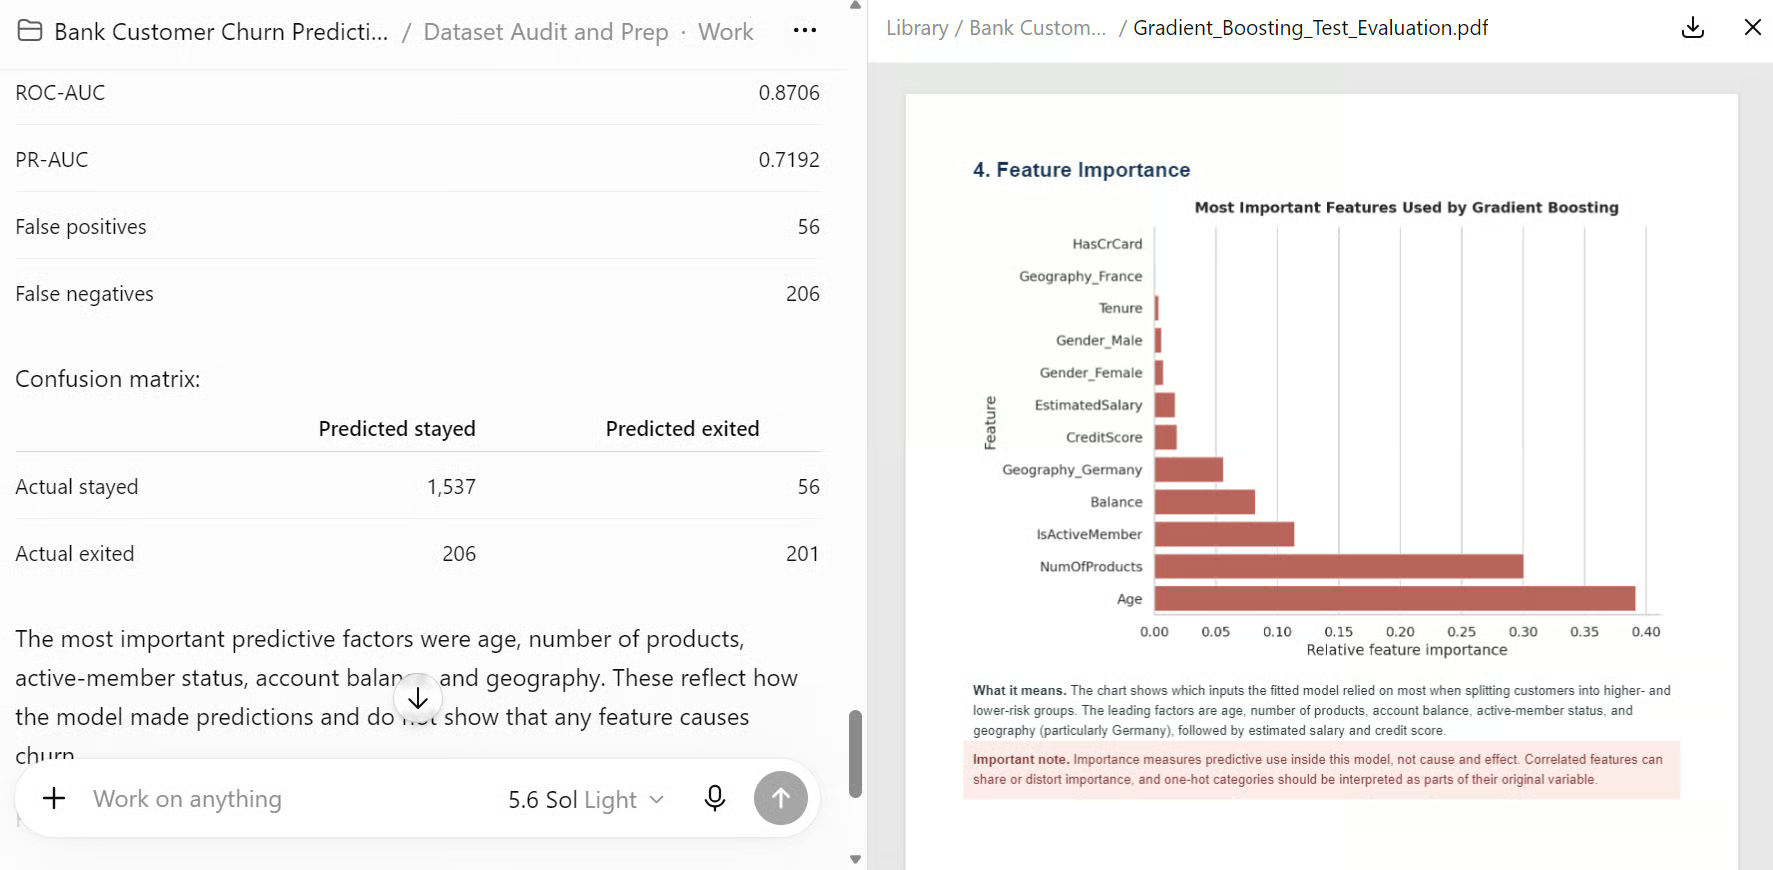
The report will include four visualizations.
A model that only lives in a report is hard to share. In this step, we will turn our trained churn predictor into a live, interactive web application that anyone can open and test.
Paste this prompt:
Create a simple interactive web interface inside ChatGPT Work to test the selected customer churn model.
Include input fields for all customer features and display whether the customer is predicted to stay or exit, along with the churn probability.
Add input validation and a reset button, and ensure the interface uses the same preprocessing pipeline and model evaluated on the test set.
ChatGPT Work comes with a feature called Sites, which lets you build and deploy web applications directly from your project.
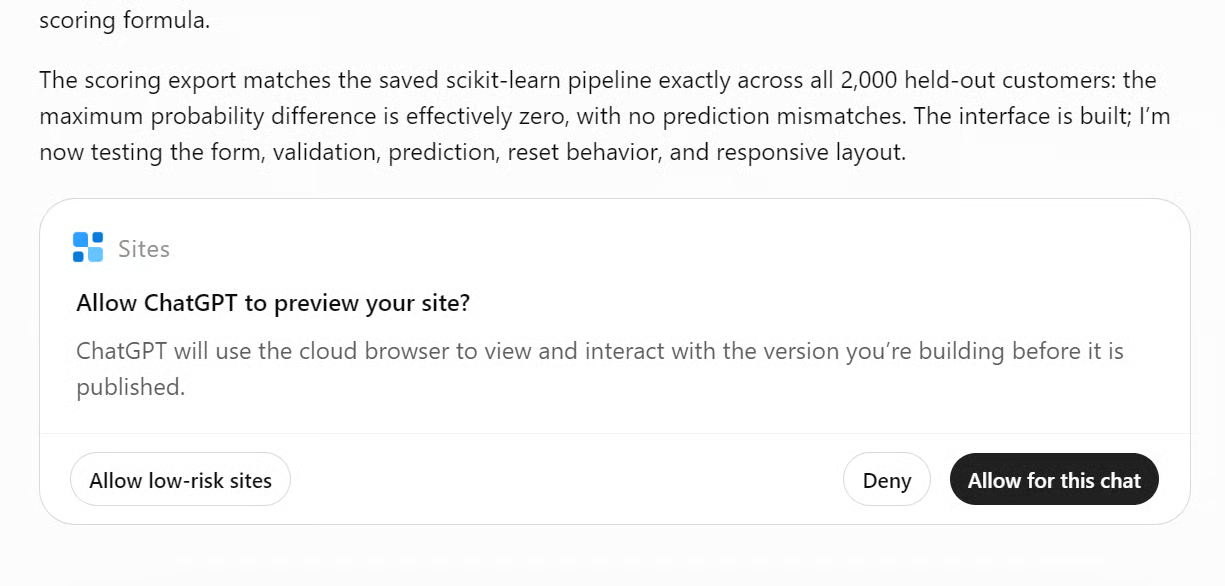
When you send this prompt, ChatGPT Work will first align the model output with the UI requirements, then use HTML, JavaScript, and CSS to create the application.
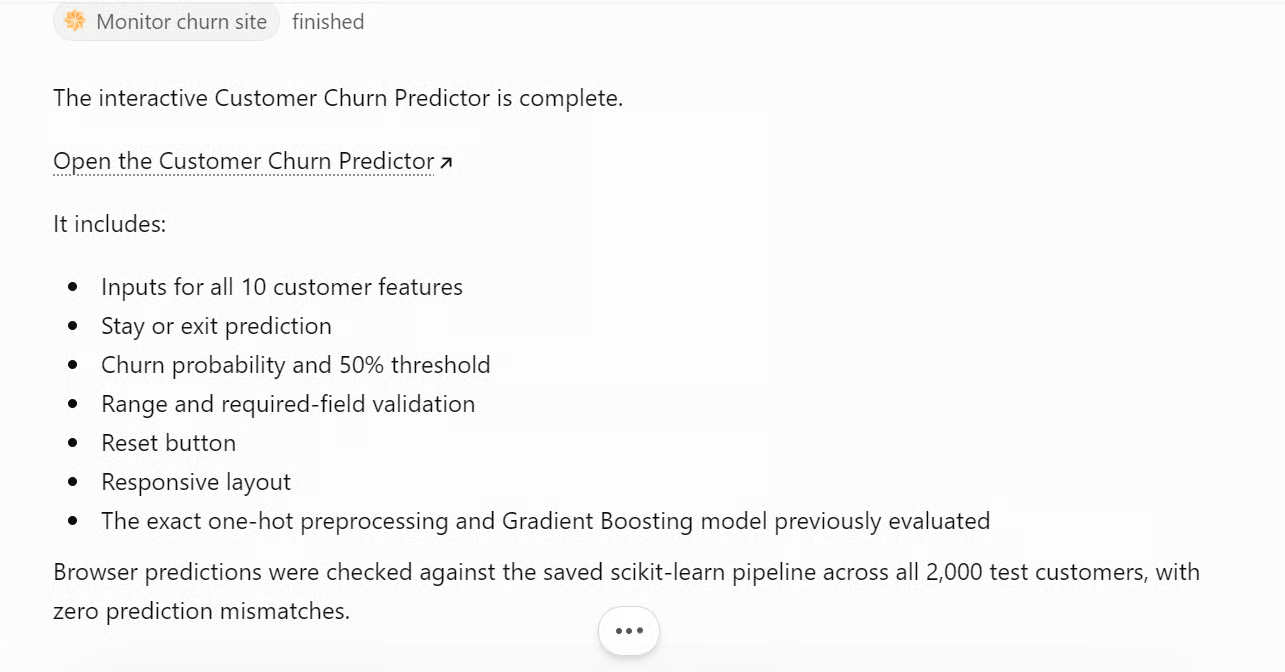
It will also provide you with a link to test it. This step takes the longest, as it involves wiring the model predictions into a polished interface that responds instantly to user input.
When you click the link, the web application will open within the ChatGPT interface. You will see input fields for all customer features, such as age, tenure, account balance, and salary.
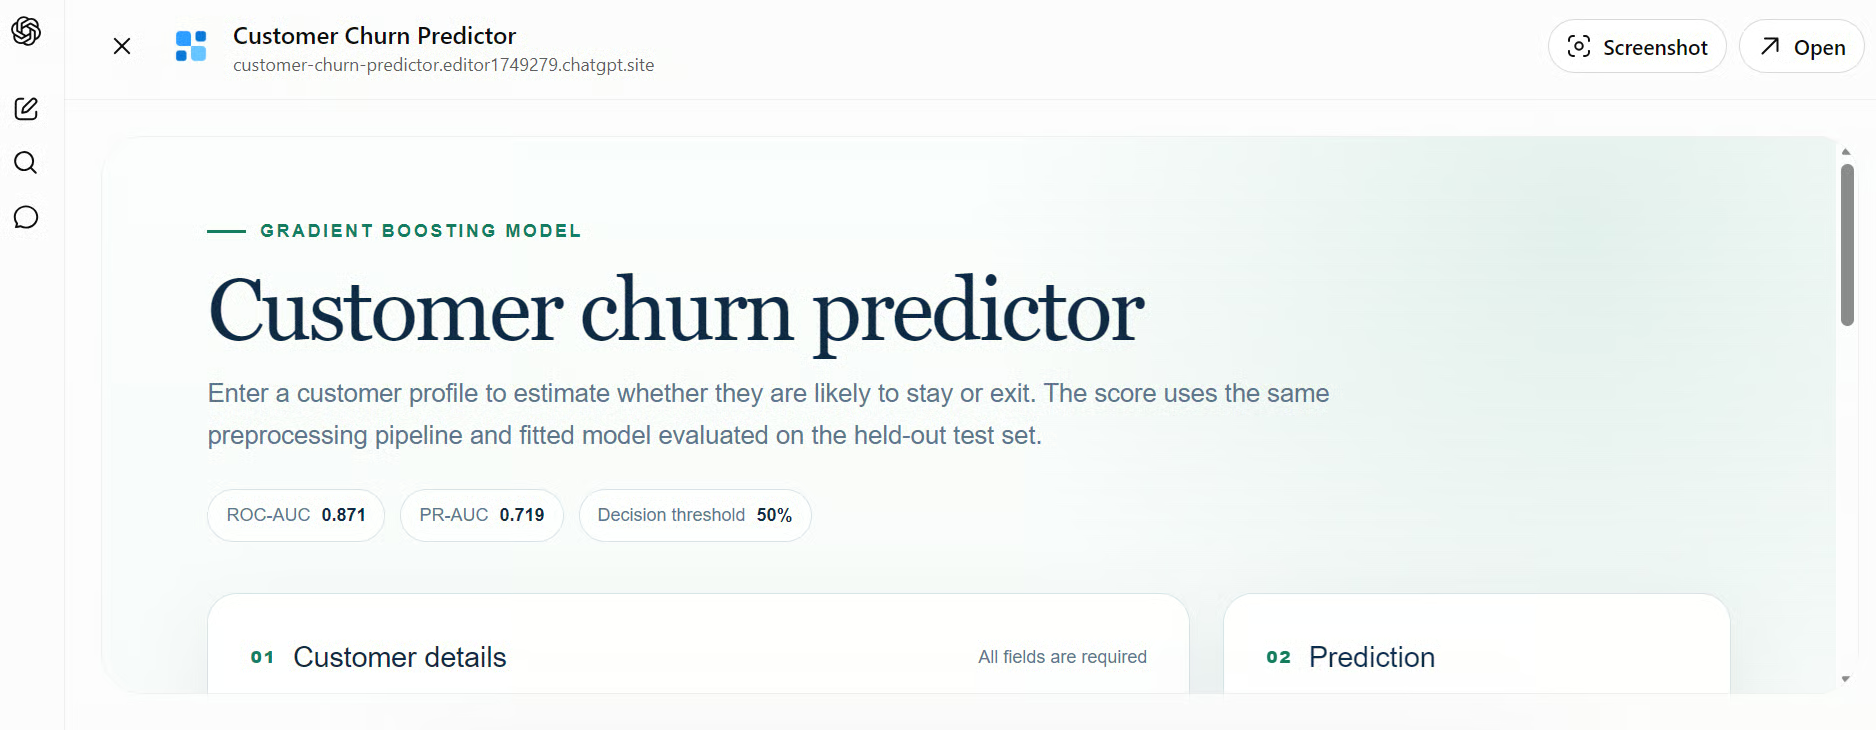
You can test it by entering different values, and within milliseconds, you will get the prediction result showing whether the customer is likely to stay or exit, along with the churn probability.
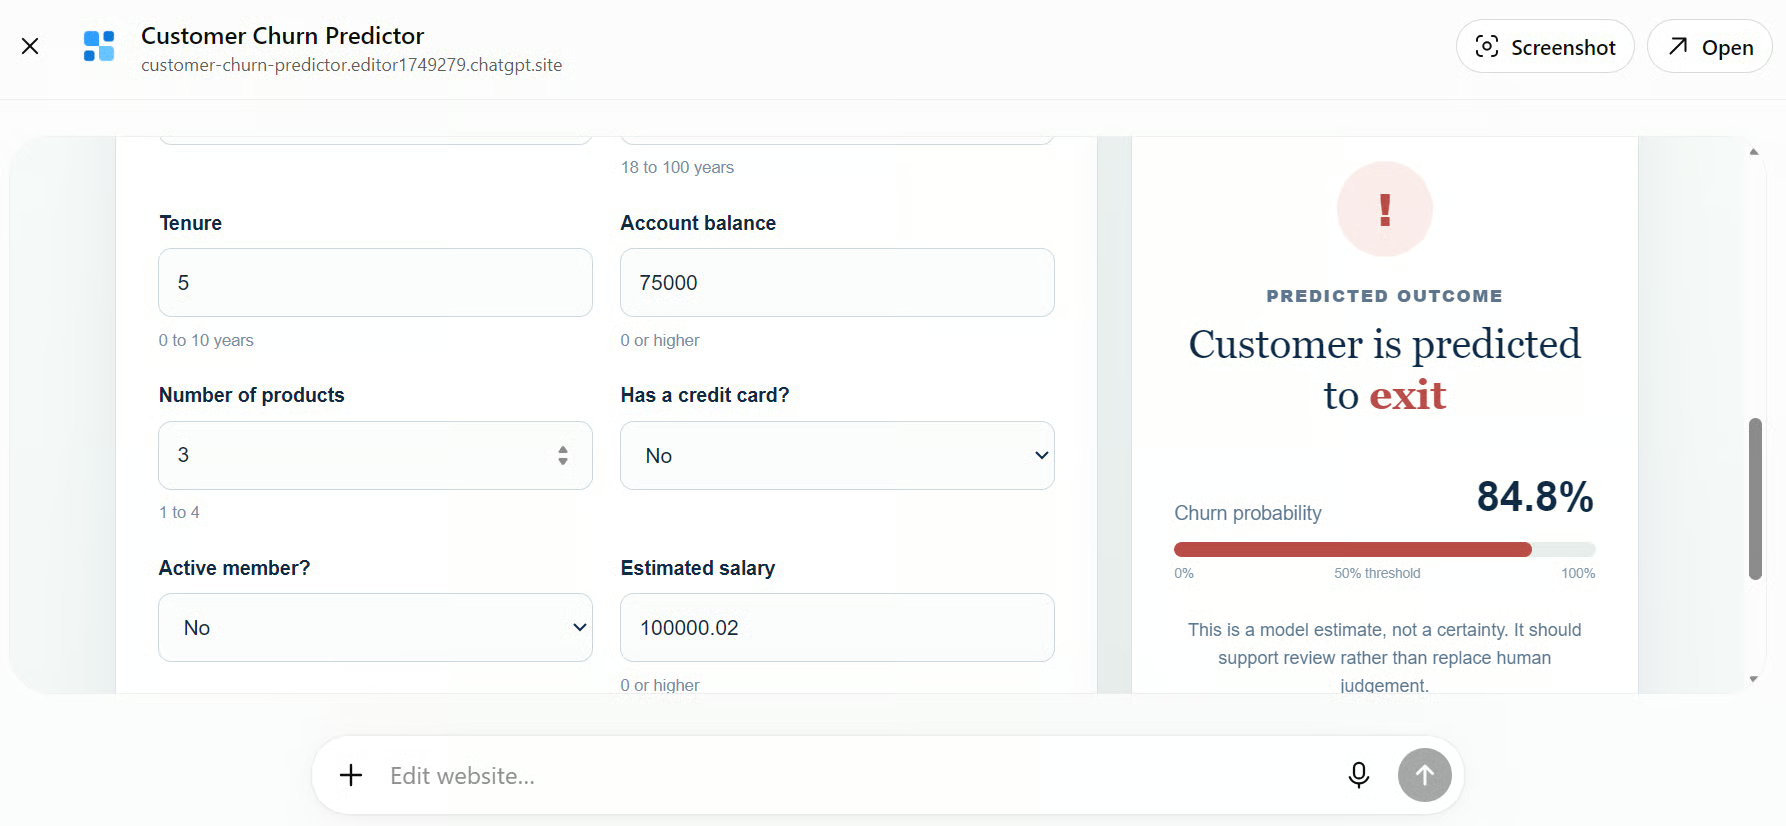
The response is accurate and fast, giving you a real feel for how the model performs with actual user data.
This way, you can validate your model for real users without writing a single line of backend code or setting up any servers.
Every solid project deserves a clean summary. In this step, we will pull together everything we have built into one professional document that tells the full story from raw data to live predictions.
Paste this prompt:
Create a final project report covering the initial data analysis, data visualizations, model training, model comparison, final evaluation, and key findings.
Include screenshots of the customer churn web interface, explain how to use it, and demonstrate that the prediction demo works with example customer profiles.
Present the report in a clear, professional structure with concise explanations.
After sending the prompt, ChatGPT Work will combine the full project into a single PDF.
You will see progress updates showing how it gathers the verified analysis, model results, evaluation charts, and live web interface screenshots.
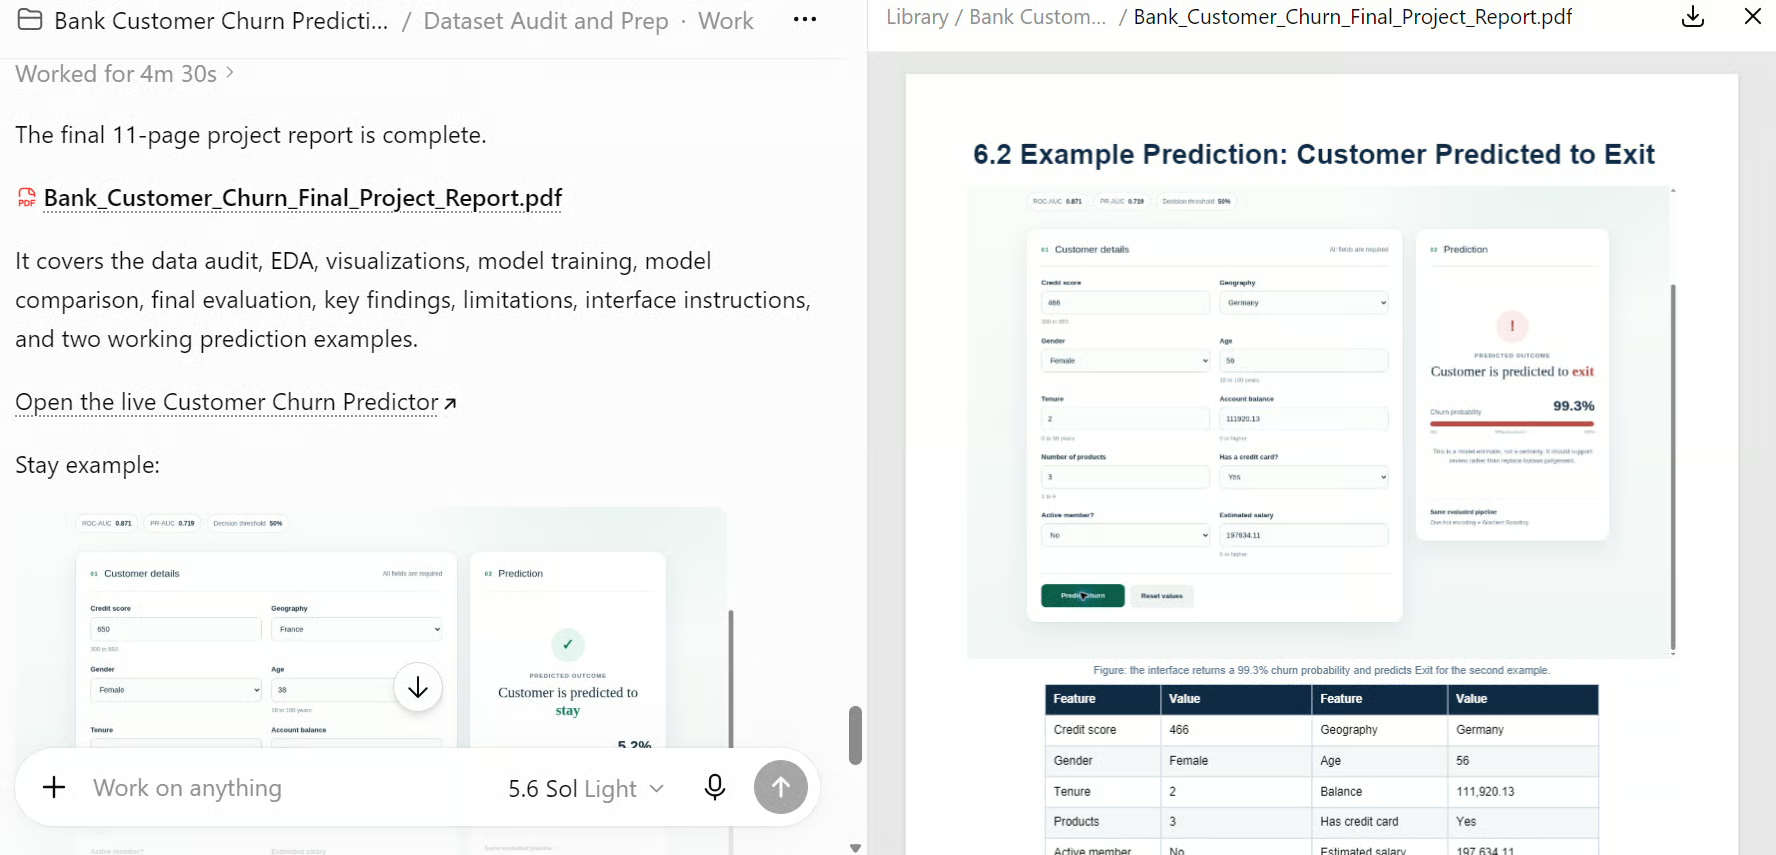
It will also generate two example customer profiles, one showing a stay prediction and one showing an exit prediction, to prove the demo works.
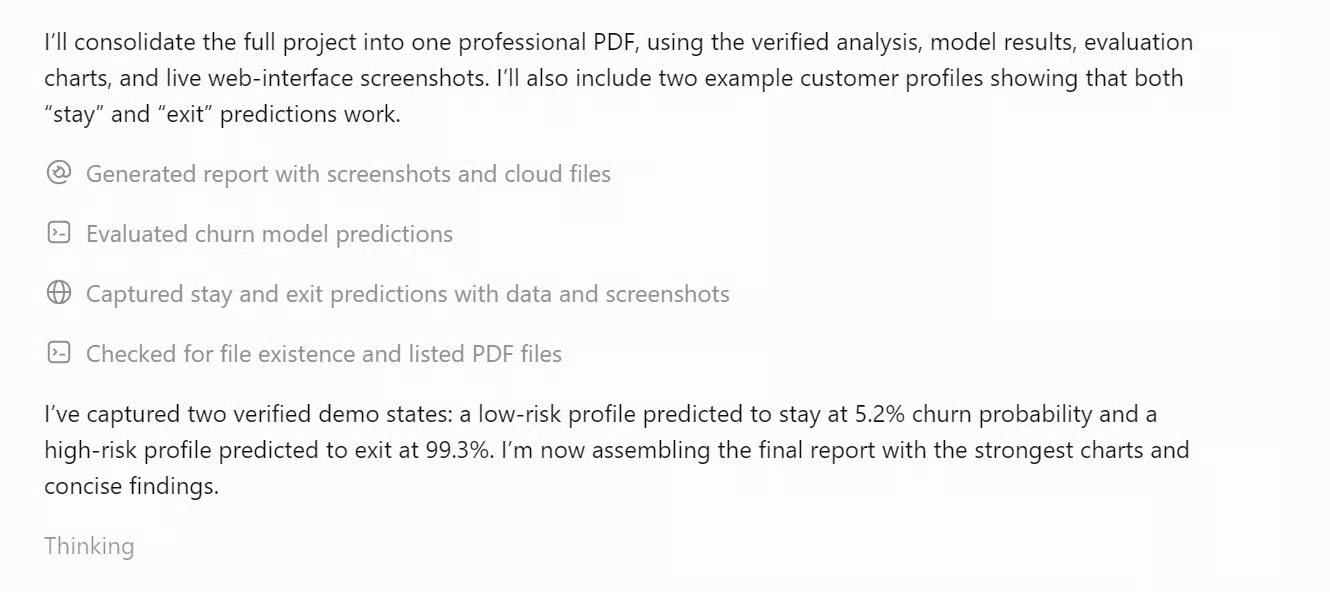
Once complete, the Outputs panel will list the final report PDF.
The report covers the data audit, exploratory analysis, visualizations, model training, model comparison, final evaluation, key findings, limitations, interface instructions, and the two working prediction examples.
You can open it directly in ChatGPT Work or download it to share with others.
ChatGPT Work keeps all your project files in the Outputs panel, but downloading them one by one can be tedious.
The easiest way to get everything at once is to ask ChatGPT Work to bundle it all into a single ZIP file with proper folders.
Paste the prompt:
Create a ZIP file containing all project outputs, including the cleaned dataset, visualizations, model comparison table, evaluation results, final report, web interface files, and screenshots.
Organize the files into clearly named folders and provide the completed ZIP file for download.
After sending the prompt, ChatGPT Work will gather every generated file and organize them into folders such as data, visualizations, reports, modeling, evaluation, and web_interface.
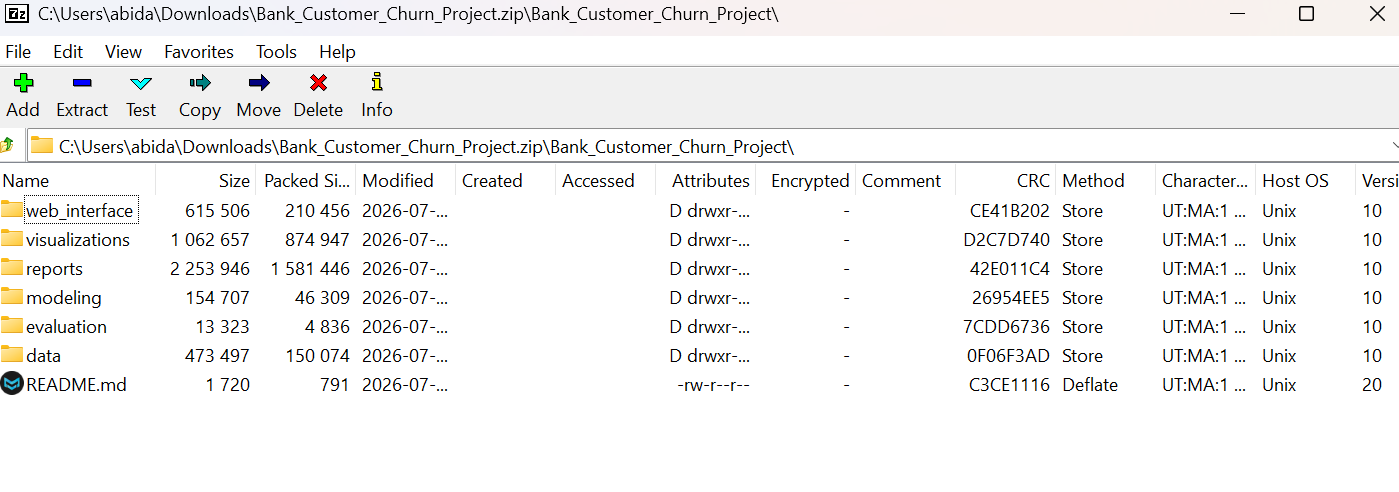
Once downloaded, you can extract it locally and browse through every artifact from the project, from the original cleaned dataset to the final live prediction app.
I think ChatGPT Work changes how data science gets done.
Everything happens in your browser, without installations, environment setup, or dependency headaches.
You upload a file, send a prompt, and watch it clean data, build charts, train models, and deploy a live app all in one flow.
It feels similar to tools like Claude Code, but the difference is speed and simplicity. You do not have to configure anything. There are no packages to manage. You do not wait for kernels to start.
You just talk to it, and it builds.
The model analyzes your data, trains itself, evaluates itself, and then serves itself through a web interface you can share or test instantly.
Compared to local setups with VS Code, extensions, and scattered notebooks, I feel like this is a different world. There is no disk space eaten by environments. No version conflicts. No context switching between ten different tools. You stay in one place, and the project grows around you.
For anyone who wants to go from raw data to a working prediction demo without touching a terminal, ChatGPT Work with GPT-5.6 is the fastest path there.
Top DataCamp Courses
courses
courses
courses
blogs
Aashi Dutt
7분
podcasts
Richie Cotton
48분
cheat-sheet
tutorials
Abid Ali Awan
11분
code-along
Adel Nehme
code-along
Richie Cotton