

在 Matplotlib 中创建基础折线图
我们先创建一个基础折线图,然后再进行美化和信息增补,使图表更美观、更有信息量。
使用 plt.plot() 创建折线图
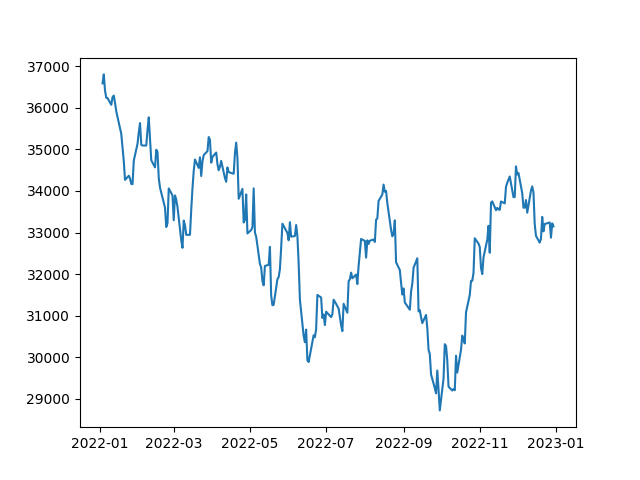
创建折线图时,我们使用 plt.plot() 函数。该函数接收两个参数:x 轴取值与 y 轴取值。在这里,日期列将作为 x 轴,收盘价列作为 y 轴。示例代码如下:
# Extract the date and close price columns
dates = df['Date']
closing_price = df['Close']
# Create a line plot
plt.plot(dates, closing_price)
# Show the plot
plt.show()运行上述代码后,您将看到 DJIA 股价的基础折线图。
自定义折线图
Matplotlib 提供了丰富的自定义选项,您可以按需灵活调整。
设置线条颜色
默认情况下,plt.plot() 绘制的是蓝色线条。您可以通过传入 color 参数更改颜色。color 参数可以接收颜色名字符串或十六进制颜色代码。
示例如下:
# Plot in Red colour
plt.plot(dates, closing_price, color='red')
# Show the plot
plt.show()这段代码会将默认的蓝色线条改为红色,如下图所示:
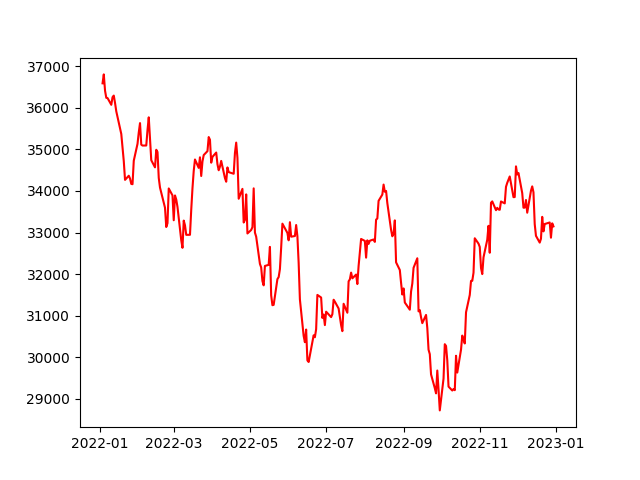
红色的基础折线图
设置线条宽度
您还可以通过向 plt.plot() 传入 linewidth 参数来更改线宽。linewidth 参数接收浮点数,表示线条的宽度。
示例如下:
# Increasing the linewidth
plt.plot(dates, closing_price, linewidth=3)
# Show the plot
plt.show()这段代码会将线宽设置为 3,高于默认值,如下图所示:
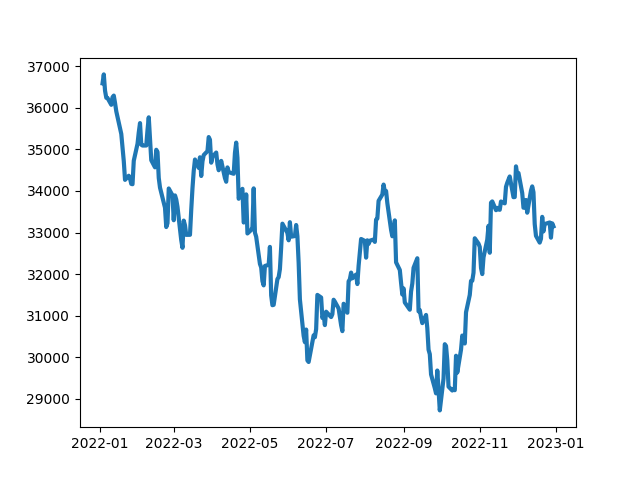
更高的 linewidth 带来更粗的线条
设置线条样式
您可以通过向 plt.plot() 传入 linestyle 参数来更改线型。linestyle 接收表示线型的字符串。Matplotlib 文档提供了详尽的可用样式列表。
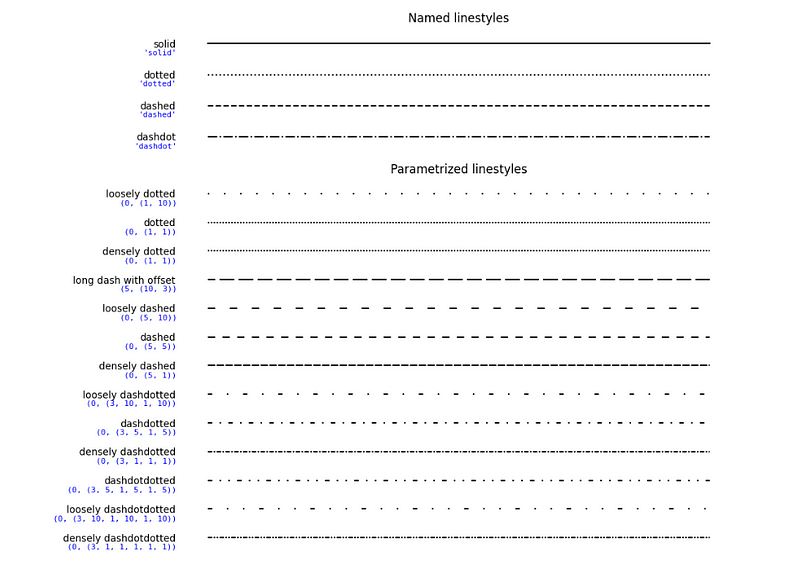
以下是这些样式在代码中的用法:
# Individually plot lines in solid, dotted, dashed and dashdot
plt.plot(dates, closing_price, linestyle='solid') # Default line style
plt.plot(dates, closing_price, linestyle='dotted')
plt.plot(dates, closing_price, linestyle='dashed')
plt.plot(dates, closing_price, linestyle='dashdot')
# Show the plot
plt.show()为折线图添加标记
标记可用于突出显示折线图中的特定点。可以使用多种符号作为标记,完整列表参见Matplotlib 文档。
以下是在折线图中使用标记的示例:
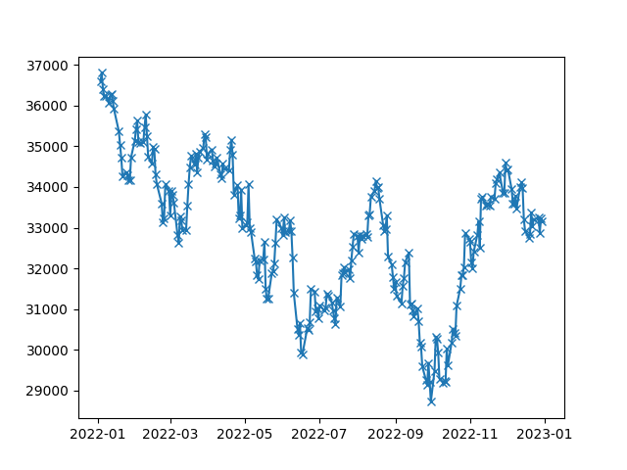
# Add a cross marker for each point
plt.plot(df['Date'], df['Close'], marker='x')
# Show the plot
plt.show()在上述代码中,我们使用叉号(x)标记来突出显示 DJIA 的 Close 价格,如下图所示:
添加坐标轴标签和标题
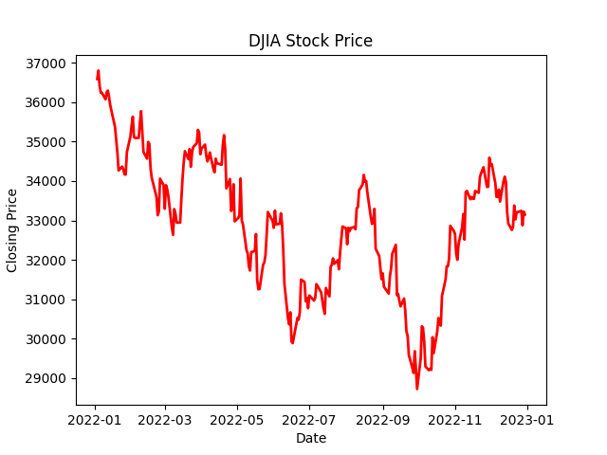
为了让图表更具信息性,我们可以添加坐标轴标签与标题。分别使用 plt.xlabel()、plt.ylabel() 和 plt.title() 即可实现。
示例如下:
plt.plot(dates, closing_price, color='red', linewidth=2)
plt.xlabel('Date')
plt.ylabel('Closing Price')
plt.title('DJIA Stock Price')
# Show the plot
plt.show()这段代码会绘制一条线宽为 2 的红色折线,同时为 x 轴添加“Date”、y 轴添加“Closing Price”,并设置标题为“DJIA Stock Price”。
添加网格线
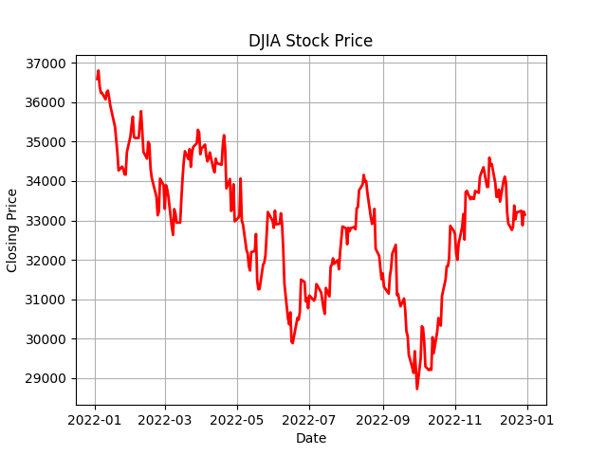
我们也可以为图表添加网格线以提升可读性。使用 plt.grid() 函数即可。该函数接收布尔值,用于控制是否显示网格。
示例如下:
plt.plot(dates, closing_price, color='red', linewidth=2)
plt.xlabel('Date')
plt.ylabel('Closing Price')
plt.title('DJIA Stock Price')
# Add the grid
plt.grid(True)
# Show the plot
plt.show()您会看到图表中增加了网格:
包含多条线的 Matplotlib 折线图
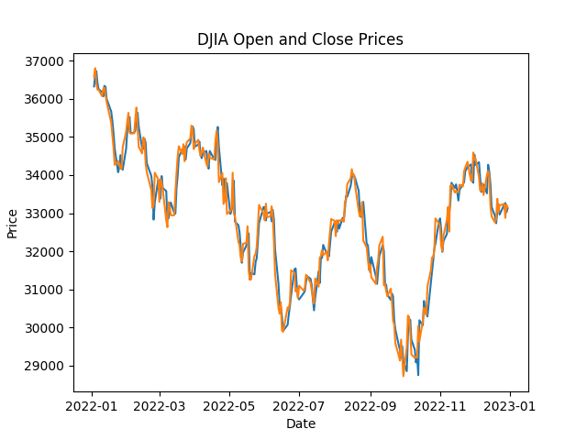
在某些情况下,您可能希望在同一张图上绘制多条折线。此时可以多次调用 plt.plot(),每次传入不同的数据。示例如下:
# Line plot of Open and Close prices
plt.plot(df['Date'], df['Open'])
plt.plot(df['Date'], df['Close'])
plt.title('DJIA Open and Close Prices')
plt.xlabel('Date')
plt.ylabel('Price')
plt.show()在上述代码中,我们在同一图中绘制了 DJIA 的 Open 与 Close 价格。
带双坐标轴的 Matplotlib 折线图
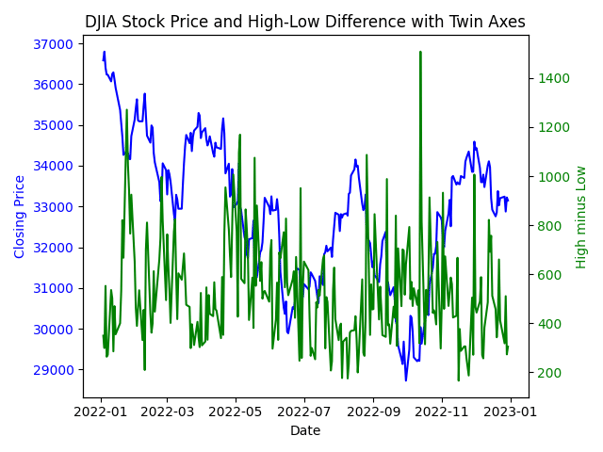
有时您需要在同一张图中展示两个量纲不同的变量。此类场景下,使用双坐标轴可以在不牺牲各自刻度清晰度的前提下,直观展现二者之间的关系。
要创建带双坐标轴的折线图,我们需要使用 twinx() 函数。该函数会创建一个与原图共享 x 轴的新 y 轴。
示例如下:
# Create a new variable for demonstration purposes
df['High_minus_Low'] = df['High'] - df['Low']
# Create a basic line plot for the Close prices
fig, ax1 = plt.subplots()
ax1.plot(df['Date'], df['Close'], color='blue', label='Close Price')
ax1.set_xlabel('Date')
ax1.set_ylabel('Closing Price', color='blue')
ax1.tick_params(axis='y', labelcolor='blue')
# Create a twin axis for the High_minus_Low variable
ax2 = ax1.twinx()
ax2.plot(df['Date'], df['High_minus_Low'], color='green', label='High - Low')
ax2.set_ylabel('High minus Low', color='green')
ax2.tick_params(axis='y', labelcolor='green')
# Add a title and show the plot
plt.title('DJIA Stock Price and High-Low Difference with Twin Axes')
plt.show()生成的双坐标轴图如下:
在 Matplotlib 折线图中添加统计信息
除了用来展示数据的趋势和模式,折线图还可以叠加统计信息,如回归线与误差线。
添加 Matplotlib 回归线
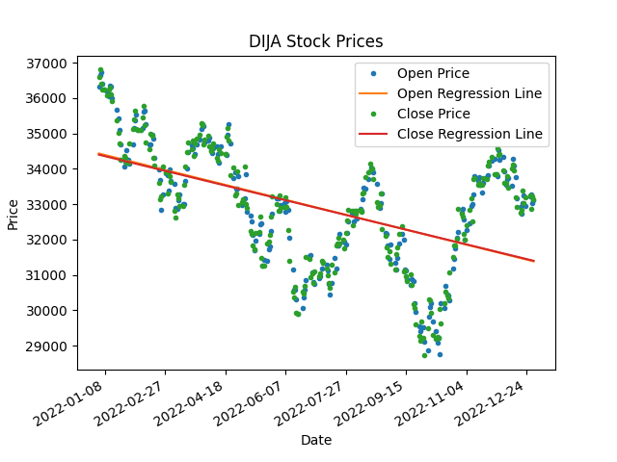
回归线是在图中最能拟合数据点的直线,可用于建模与预测未来值。我们可以使用 NumPy 的 polyfit() 函数将多项式回归线拟合到数据点上,并将其添加到折线图中。
import matplotlib.dates as mdates
# Convert Date column to numeric value
df['Date'] = mdates.date2num(df['Date'])
# Add regression line to plot
coefficients_open = np.polyfit(df['Date'], df['Open'], 1)
p_open = np.poly1d(coefficients_open)
coefficients_close = np.polyfit(df['Date'], df['Close'], 1)
p_close = np.poly1d(coefficients_close)
fig, ax = plt.subplots()
ax.plot(df['Date'], df['Open'], '.', label='Open Price')
ax.plot(df['Date'], p_open(df['Date']), '-', label='Open Regression Line')
ax.plot(df['Date'], df['Close'], '.', label='Close Price')
ax.plot(df['Date'], p_close(df['Date']), '-', label='Close Regression Line')
ax.set_title('DIJA Stock Prices')
ax.set_xlabel('Date')
ax.set_ylabel('Price')
ax.legend()
# Format x-axis labels as dates
date_form = mdates.DateFormatter("%Y-%m-%d")
ax.xaxis.set_major_formatter(date_form)
plt.gcf().autofmt_xdate()
plt.show()在这段代码中,我们首先使用 date2num() 函数将日期转换为数值,然后使用 polyfit() 函数求得回归线的系数。接着用 poly1d() 函数构造回归线并进行绘制。原始数据点以散点表示,回归线以实线表示。
添加误差线
误差线是对数据变异性的图形化表征,可用于表示测量中的不确定性。
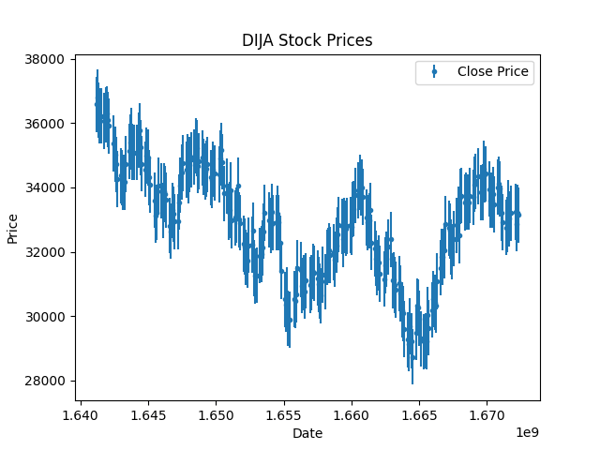
当您预计数据采集过程中会有误差时(如气温数据、空气质量数据等),这尤其有用。尽管股价数据相对确定,这里我们假设存在一个标准差量级的潜在误差,并使用 Matplotlib 的 errorbar 函数将其绘制出来。
# Calculate standard deviation of data
std = df['Close'].std()
# Add error bars to plot
plt.errorbar(df['Date'], df['Close'], yerr=std/2, fmt='.', label='Close Price')
plt.title('DIJA Stock Prices')
plt.xlabel('Date')
plt.ylabel('Price')
plt.legend()
plt.show()在这段代码中,我们首先计算数据集中 Close 价格的标准差。随后使用 errorbar() 函数为折线图添加误差线,误差大小设为标准差的一半。
通过这些技巧,我们可以在折线图中加入统计信息,从而更深入地洞察数据。
结语
折线图是可视化数据趋势与模式的有力工具,而 Matplotlib 提供了易用的接口来创建这类图表。
下一步,您可以继续学习我们的Intermediate Python 课程,在其中把学到的内容应用到黑客统计学的案例研究中。
我们希望本教程能帮助您顺利上手在 Matplotlib 中创建折线图。我们还在另一篇教程中对其他Matplotlib 图表进行了系统讲解,能帮助您快速了解 Matplotlib 的更多用法。
继续探索与尝试,打造精彩的可视化,并从数据中发掘更多洞见!
数据可视化与叙事对数据科学家至关重要,它们能将复杂的数据洞见转化为清晰易懂、便于沟通的故事。尽管不断有更新、更炫的可视化库问世,Matplotlib 仍是最受欢迎的绘图库之一,也是许多新库的基础。
本教程聚焦于 Matplotlib 中最常见的图表之一:折线图。折线图非常适合展示随时间变化的趋势与波动,把数据点“连成线”,生动呈现变化轨迹。
我们将从创建简单折线图的基础开始,随后逐步深入到更高级的技巧,例如为图表添加统计信息。学完本教程,您将全面掌握如何在 Matplotlib 中创建不同类型的折线图,并能有效地用它们来传达数据洞见。
准备好提升您的数据可视化技能了吗?让我们开始吧!
库、数据与预处理
在使用 Matplotlib 创建折线图之前,我们需要先完成环境配置。这包括安装 Matplotlib、导入所需库,以及对将在示例中使用的数据集进行预处理。
安装 Matplotlib
要安装 Matplotlib,您可以使用 Python 的包管理器 pip。打开终端或命令提示符并输入:
这将会在您的机器上安装最新版的 Matplotlib。
导入所需库
安装完成后,我们需要与其他常用库一起导入 Matplotlib,比如 NumPy 和 Pandas。NumPy 用于数组运算,Pandas 用于数据处理与分析。
导入方法如下:
读取与预处理数据
在本教程中,我们将使用一个包含道琼斯工业平均指数(DJIA)日度价格的数据集。该数据集包含五列:
在加载数据集后,我们会进行一些基础预处理,例如重命名列、将日期转换为
datetime类型,并按日期升序排序。上述步骤的代码如下:
现在我们已经完成环境配置并加载了数据集,可以开始使用 Matplotlib 创建折线图了。