{count, plural, other {แทร็ก}}
พื้นฐานของ AI Agent
{hours} ชม.
GLM-5.3-Flash มอบสมดุลที่น่าประทับใจระหว่างประสิทธิภาพ ประสิทธิผล และราคา สำหรับภาพรวมแบบครบถ้วน โปรดอ่าน คู่มือ GLM-5.3-Flash และ บทเปรียบเทียบกับ Qwen3.8-Flash-Next ของเรา
บนดัชนี Artificial Analysis Intelligence โมเดลนี้ได้คะแนน57 จัดอยู่ในกลุ่มโมเดลชั้นนำและสามารถแข่งขันกับโมเดลแนวหน้าหลายตัวที่มีราคาแพงกว่ามาก ตัวอย่างเช่น:
GPT-5.6 Sol ก็ได้ 57 (พร้อมความพยายามให้เหตุผลระดับ high) แต่มีค่าบริการโทเค็นขาเข้าแพงกว่าเกิน 25 เท่า และขาออกแพงกว่าเกิน 40 เท่า
Claude Sonnet 5 ได้คะแนนต่ำกว่าเล็กน้อยที่ 55 เมื่อใช้ความพยายามให้เหตุผลระดับ max และมีค่าบริการโทเค็นขาเข้า/ขาออกแพงกว่า GLM-5.3-Flash ราว 20x/30x
โมเดลมีพารามิเตอร์รวม 320B แต่มีพารามิเตอร์ที่ทำงานต่อโทเค็นเพียงราว 18B ทำให้ให้ประสิทธิภาพที่แข็งแรงพร้อมยังคงใช้คอมพิวต์ได้คุ้มค่า
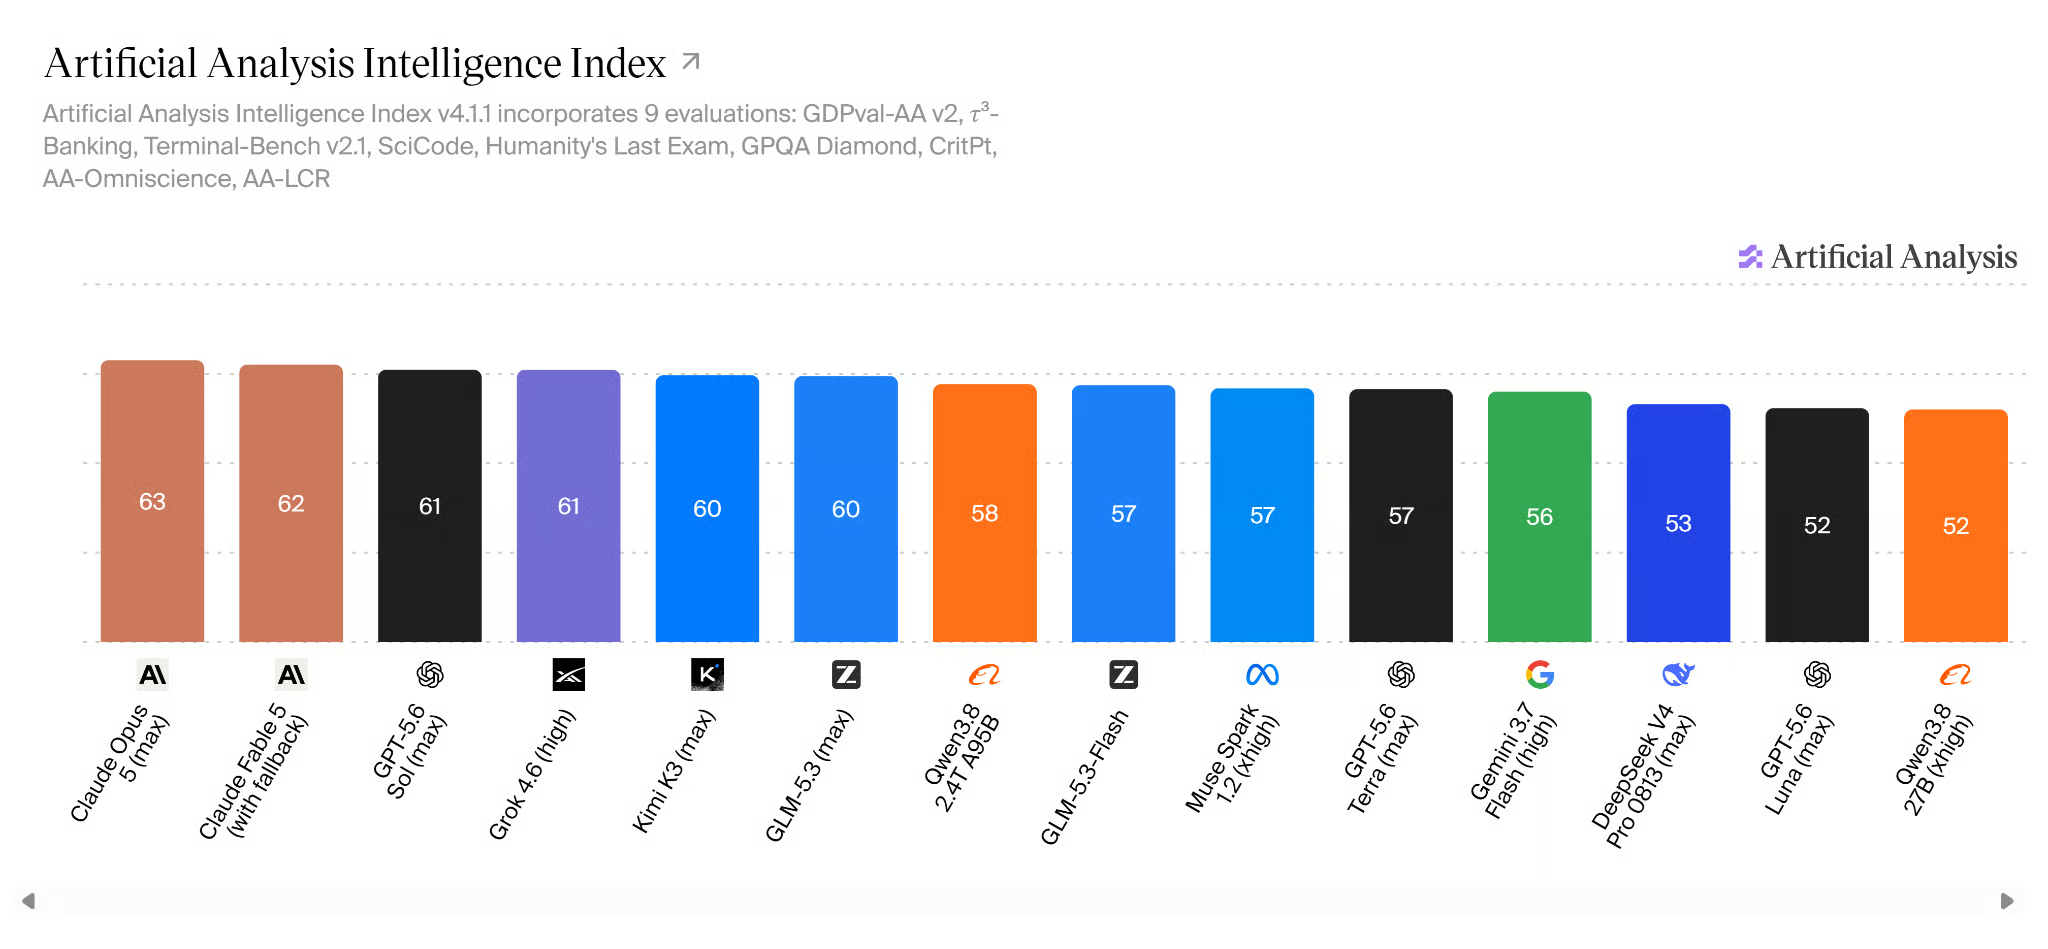
ที่มา: AI Model & API Providers Analysis | Artificial Analysis
อย่างที่กล่าวไว้แล้ว ประสิทธิภาพนี้มาพร้อมราคาผ่าน API ที่ต่ำกว่าโดยเปรียบเทียบ ณ เวลาที่เขียน OpenRouter เสนอ GLM-5.3-Flash ลด 50% ที่ $0.075 ต่อโทเค็นขาเข้าล้านโทเค็น และ $0.25 ต่อโทเค็นขาออกล้านโทเค็น
แม้ที่ราคาปกติ $0.15/$0.50 ก็ยังถูกกว่ารุ่นอย่าง GPT-5.6 Luna ของ OpenAI ที่ $0.20/$1.20 (ได้ 52 บน AA Intelligence Index ที่ max reasoning) นี่ทำให้เหมาะทั้งสำหรับทดลองและสำหรับแอปพลิเคชันตัวแทนระดับโปรดักชันที่ใหญ่ขึ้นด้วย
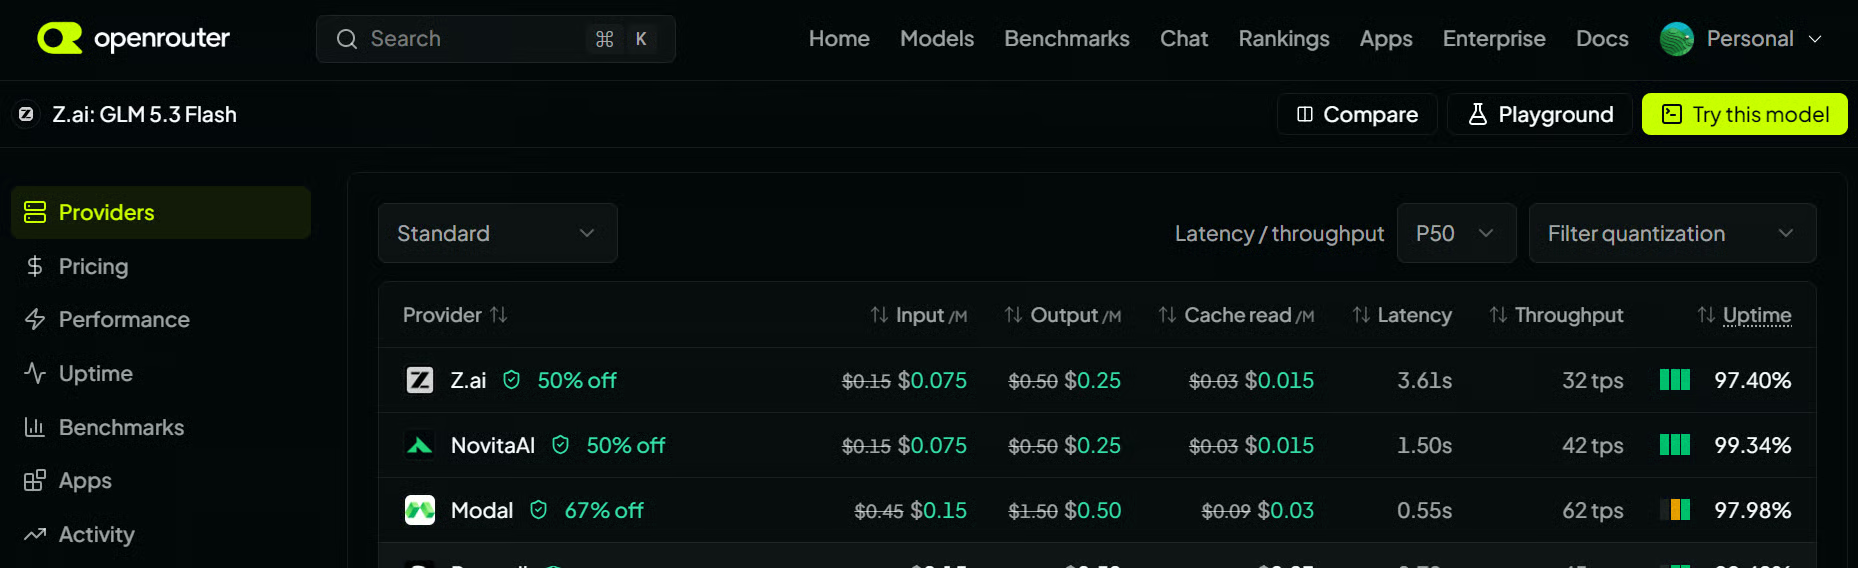
ที่มา: GLM 5.3 Flash - API Pricing & Benchmarks | OpenRouter
ประเด็นนี้ยิ่งสำคัญเมื่อสร้างระบบหลายตัวแทน เพราะคำขอของผู้ใช้หนึ่งครั้งอาจกระตุ้นการเรียก LLM จำนวนมากเบื้องหลัง ตัวแทน LLM หนึ่งตัวอาจเรียกโมเดลหลายครั้งสำหรับการให้เหตุผล เลือกเครื่องมือ ประมวลผลผลลัพธ์เครื่องมือ และสร้างคำตอบสุดท้าย หากตัวแทนหนึ่งตัวเรียก LLM ราวเจ็ดครั้ง และเวิร์กโฟลว์ใช้ห้าตัวแทน คำขอเดียวอาจก่อให้เกิดการเรียก LLM ได้ 35 ครั้งหรือมากกว่า
จำนวนที่แน่นอนขึ้นกับการออกแบบระบบ แต่ประเด็นง่าย ๆ คือ เวิร์กโฟลว์แบบตัวแทนอัจฉริยะมีค่าใช้จ่ายพุ่งเร็ว การใช้โมเดลที่มีความสามารถและมีราคาต่อโทเค็นต่ำอย่าง GLM-5.3-Flash จึงส่งผลอย่างมีนัยเมื่อย้ายจากเดโมเล็ก ๆ ไปเป็นแอปพลิเคชันจริงในโปรดักชัน
ก่อนสร้างเวิร์กโฟลว์หลายตัวแทน ให้สร้างคีย์ API สำหรับ Z.ai, Finnhub และ Tavily
สำหรับ Z.ai ให้แน่ใจว่าใช้ API ปกติ ไม่ใช่ GLM Coding Plan แผน Coding มีไว้สำหรับเครื่องมือโค้ดดิ้งที่รองรับ และไม่ควรใช้เป็น API อเนกประสงค์สำหรับแอปหลายตัวแทนของตนเอง
สร้างคีย์ API แบบปกติของ Z.ai และเติมเครดิตเล็กน้อยในบัญชี เนื่องจาก GLM-5.3-Flash มีราคาย่อมเยา จึงต้องมียอดคงเหลือเพียงเล็กน้อยเพื่อเริ่มทดสอบ
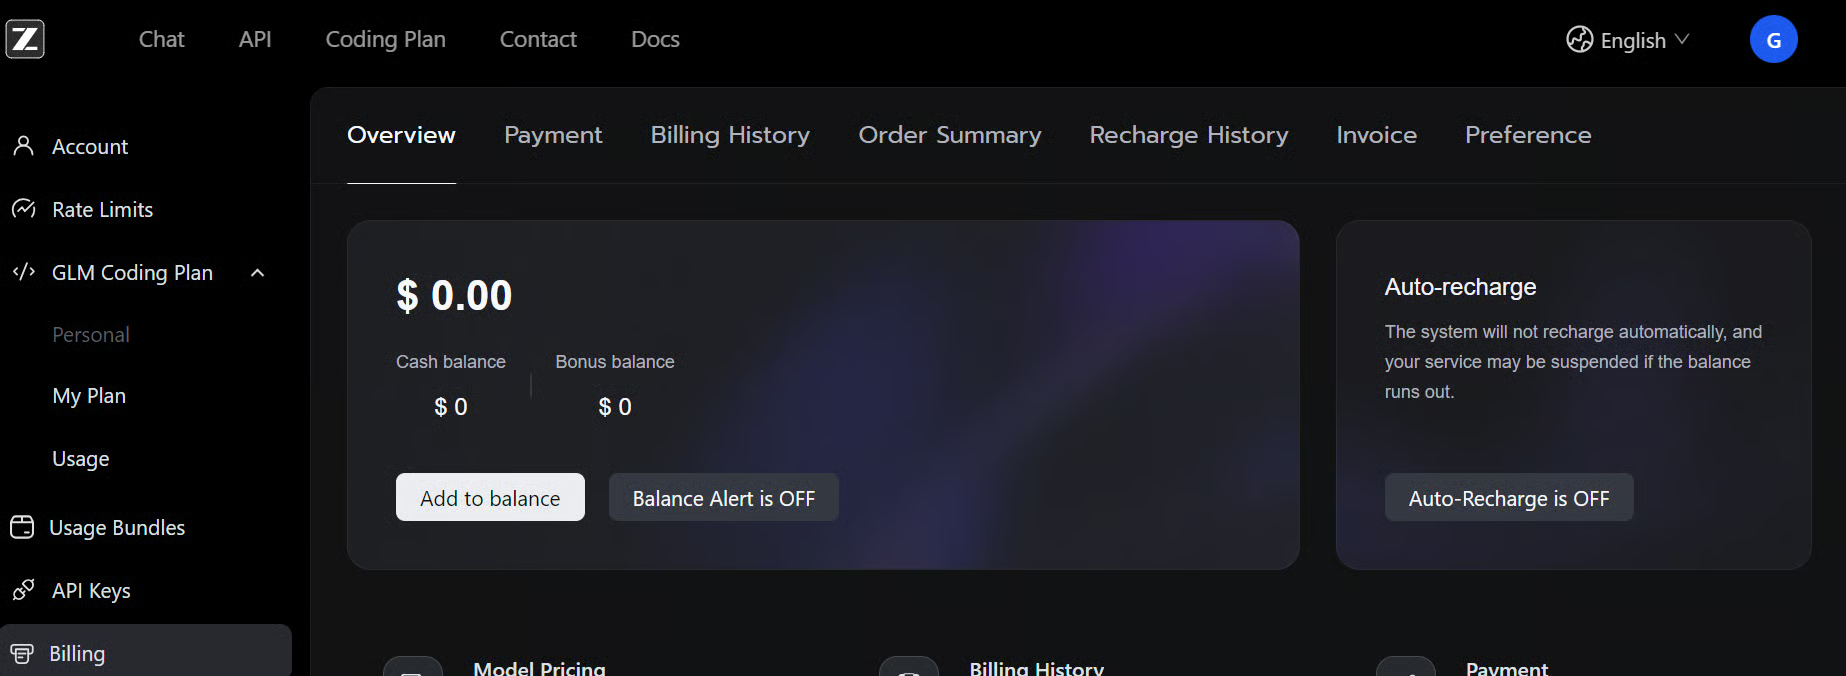
ที่มา: Z.ai API Platform — Start building with GLM-5.3
สามารถสร้างบัญชีฟรีบน Finnhub และ Tavily แล้วสร้างคีย์ API ได้ แพลนฟรีเพียงพอสำหรับทดสอบโปรเจกต์นี้
ถัดไป สร้างไฟล์ .env ในโฟลเดอร์โปรเจกต์ แล้วเพิ่มคีย์ API:
ZAI_API_KEY="your_zai_api_key"
FINNHUB_API_KEY="your_finnhub_api_key"
TAVILY_API_KEY="your_tavily_api_key"
ตอนนี้ สร้าง Jupyter Notebook ใหม่ เราจะสร้างและทดสอบเวิร์กโฟลว์หลายตัวแทนแบบครบถ้วนในนี้ ตรวจดูผลลัพธ์ของแต่ละตัวแทน และแก้ปัญหาก่อนแปลงเป็นแอปพลิเคชันจริง
เราจะใช้ CrewAI เพื่อสร้างและประสานงานตัวแทน ใช้ Finnhub สำหรับข้อมูลตลาดหุ้น และ Tavily สำหรับการค้นหาเว็บแบบเรียลไทม์ ติดตั้งแพ็กเกจ Python ที่ต้องใช้ดังนี้:
!pip install -q crewai crewai-tools finnhub-python tavily-python pandas numpy requests python-dotenv openaiถัดไป นำเข้าไลบรารีที่ต้องใช้และโหลดคีย์ API:
import os
import re
import time

import finnhub
import numpy as np
import pandas as pd
import requests

from dotenv import load_dotenv
from openai import OpenAI
from tavily import TavilyClient

from crewai import Agent, Crew, LLM, Process, Task
from crewai.tools import tool
from crewai_tools import TavilySearchTool

# Load environment variables
load_dotenv()

# Disable CrewAI tracing
os.environ.setdefault("CREWAI_TRACING_ENABLED", "false")
os.environ.setdefault("OTEL_SDK_DISABLED", "true")
สุดท้าย เลือกหุ้นที่ต้องการให้ตัวแทนวิเคราะห์:
TICKER = "NVDA"ในโน้ตบุ๊กนี้จะใช้ NVIDIA (NVDA) ตลอด แต่สามารถแทนที่ด้วยทิกเกอร์อื่นที่สนใจได้ เช่น AAPL, MSFT หรือ TSLA.
เมื่อตั้งค่าคีย์ API เรียบร้อยแล้ว เราสามารถเชื่อมต่อบริการที่ตัวแทนจะใช้ตลอดโปรเจกต์ได้
เริ่มจากการอินิเทียไลซ์ Finnhub สำหรับข้อมูลตลาดหุ้น และ Tavily สำหรับค้นหาเว็บ:
finnhub_client = finnhub.Client(
    api_key=os.environ["FINNHUB_API_KEY"]
)

tavily_client = TavilyClient(
    api_key=os.environ["TAVILY_API_KEY"]
)
หากต้องการสร้างตัวแทนด้านการเงินแต่ยังไม่แน่ใจว่าจะใช้แหล่งข้อมูลใด แนะนำให้อ่านคู่มือของเราว่าด้วย การเลือก API ข้อมูลตลาดหุ้นที่เหมาะสม
ถัดไป ตั้งค่า GLM-5.3-Flash เป็น LLM หลักสำหรับตัวแทน CrewAI ของเรา Z.ai มี API ที่เข้ากันได้กับ OpenAI จึงเชื่อมต่อได้ตรงผ่านคลาส LLM ของ CrewAI:
llm = LLM(
    model="openai/glm-5.3-flash",
    api_key=os.environ["ZAI_API_KEY"],
    base_url="https://api.z.ai/api/paas/v4/",
    temperature=0.1,
)
เราตั้งค่า temperature ต่ำเพราะแอปพลิเคชันนี้เน้นงานวิจัยและวิเคราะห์ด้านการเงิน ซึ่งต้องการคำตอบที่คงเส้นคงวาและตรงประเด็น
เมื่อเชื่อมต่อโมเดล ข้อมูลตลาด และ API ค้นหาเว็บแล้ว ต่อไปเริ่มสร้างเครื่องมือที่ตัวแทนจะใช้
ต่อไปเราต้องมีข้อมูลราคาย้อนหลังเพื่อให้ตัวแทนเข้าใจว่าหุ้นมีพัฒนาการอย่างไรตามกาลเวลา
สำหรับงานนี้ เราจะใช้เอ็นด์พอยต์กราฟสาธารณะของ Yahoo Finance เพื่อดึงข้อมูลรายวันของราคาเปิด สูง ต่ำ ปิด และปริมาณ
HTTP = requests.Session()
HTTP.headers.update({"User-Agent": "glm-stock-swarm/1.0"})


def _yahoo_history(ticker: str, days: int) -> pd.DataFrame:
    end = int(time.time())
    start = end - days * 24 * 60 * 60

    response = HTTP.get(
        f"https://query1.finance.yahoo.com/v8/finance/chart/{ticker}",
        params={
            "period1": start,
            "period2": end,
            "interval": "1d",
            "events": "history",
        },
        timeout=30,
    )
    response.raise_for_status()

    result = response.json()["chart"]["result"][0]
    values = result["indicators"]["quote"][0]

    frame = pd.DataFrame({
        "date": pd.to_datetime(
            result["timestamp"], unit="s", utc=True
        ).tz_localize(None),
        "open": values["open"],
        "high": values["high"],
        "low": values["low"],
        "close": values["close"],
        "volume": values["volume"],
    })

    frame = (
        frame.dropna(subset=["close"])
        .sort_values("date")
        .reset_index(drop=True)
    )

    frame.attrs["source"] = "Yahoo public chart"
    return frame


def get_price_history(ticker: str, days: int = 450) -> pd.DataFrame:
    return _yahoo_history(ticker.strip().upper(), days)
เราจะเก็บข้อมูลประมาณ 450 วัน ซึ่งเพียงพอสำหรับการคำนวณตัวชี้วัดระยะยาวอย่างเส้นค่าเฉลี่ยเคลื่อนที่ 200 วัน
ต่อไป มาคำนวณตัวชี้วัดที่ใช้กันทั่วไปไม่กี่ตัว ได้แก่
def add_indicators(frame: pd.DataFrame) -> pd.DataFrame:
    if frame.empty:
        return frame.copy()

    result = frame.copy()
    result.attrs.update(frame.attrs)

    # Moving averages
    result["SMA20"] = result["close"].rolling(20).mean()
    result["SMA50"] = result["close"].rolling(50).mean()
    result["SMA200"] = result["close"].rolling(200).mean()

    # RSI
    delta = result["close"].diff()
    gain = delta.clip(lower=0)
    loss = -delta.clip(upper=0)

    avg_gain = gain.ewm(
        alpha=1 / 14, min_periods=14, adjust=False
    ).mean()

    avg_loss = loss.ewm(
        alpha=1 / 14, min_periods=14, adjust=False
    ).mean()

    result["RSI14"] = 100 - (
        100 / (1 + avg_gain / avg_loss.replace(0, np.nan))
    )

    # MACD
    result["EMA12"] = result["close"].ewm(
        span=12, adjust=False
    ).mean()

    result["EMA26"] = result["close"].ewm(
        span=26, adjust=False
    ).mean()

    result["MACD"] = result["EMA12"] - result["EMA26"]

    return result
ตัวชี้วัดเหล่านี้มีประโยชน์เพราะช่วยให้ตัวแทนเชิงเทคนิคมองเห็นแนวโน้มและโมเมนตัมอย่างรวดเร็ว โดยไม่ต้องให้ LLM คำนวณทุกอย่างเอง
ตอนนี้รวบรวมข้อมูล คำนวณตัวชี้วัด และแสดงแถวล่าสุด:
history = add_indicators(
    get_price_history(TICKER)
)

if len(history) < 200:
    raise RuntimeError(
        f"Need at least 200 daily observations; received {len(history)}."
    )

print(
    f"Loaded {len(history)} rows "
    f"from {history.attrs['source']}."
)

history.tail(3)[
    [
        "date",
        "close",
        "SMA20",
        "SMA50",
        "SMA200",
        "RSI14",
        "MACD",
    ]
]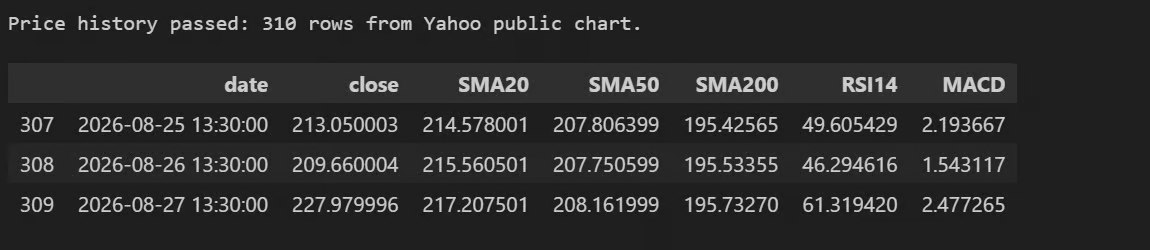
ควรเห็นราคาหุ้นล่าสุดพร้อมกับเส้นค่าเฉลี่ยเคลื่อนที่ RSI และ MACD คล้ายกับผลลัพธ์ข้างต้น
ต่อไปเราจะส่งข้อมูลนี้ให้ตัวแทนวิเคราะห์ทางเทคนิคเพื่อระบุแนวโน้มราคา โมเมนตัม และสัญญาณกระทิงหรือหมี
เมื่อแหล่งข้อมูลพร้อมใช้งานแล้ว เราต้องแปลงให้เป็นเครื่องมือของ CrewAI เพื่อให้ตัวแทนเรียกใช้โดยตรงเมื่อใดก็ตามที่ต้องการข้อมูลด้านการเงิน เทคนิค หรือข่าว
ก่อนอื่น สร้างฟังก์ชันช่วยขนาดเล็กเพื่อจัดรูปแบบค่าตัวเลขให้สะอาดและสม่ำเสมอ:
def _number(value, decimals: int = 2) -> str:
    if value is None or pd.isna(value):
        return "N/A"

    return f"{float(value):,.{decimals}f}"
ถัดไป สร้างเครื่องมือพื้นฐานหุ้น โดยใช้ Finnhub เพื่อดึงราคาล่าสุด เมตริกการประเมินมูลค่า การเติบโต ความสามารถในการทำกำไร และข้อมูลพื้นฐานอื่น ๆ ของบริษัท
@tool("Get Stock Fundamentals")
def get_fundamentals(ticker: str) -> str:
    """Get current price and company fundamentals from Finnhub for one ticker."""

    ticker = ticker.strip().upper()

    quote = finnhub_client.quote(ticker)
    metrics = finnhub_client.company_basic_financials(ticker, "all")
    m = metrics.get("metric", {})

    return f"""Ticker: {ticker}
Source: Finnhub
Current price: {_number(quote.get('c'))}
Previous close: {_number(quote.get('pc'))}
Daily change %: {_number(quote.get('dp'))}
Day high / low: {_number(quote.get('h'))} / {_number(quote.get('l'))}
Market cap (USD millions): {_number(m.get('marketCapitalization'))}
52-week high / low: {_number(m.get('52WeekHigh'))} / {_number(m.get('52WeekLow'))}
Normalized annual P/E: {_number(m.get('peNormalizedAnnual'))}
Annual P/B: {_number(m.get('pbAnnual'))}
Annual P/S: {_number(m.get('psAnnual'))}
ROE TTM: {_number(m.get('roeTTM'))}
Net margin TTM: {_number(m.get('netProfitMarginTTM'))}
Revenue growth TTM YoY: {_number(m.get('revenueGrowthTTMYoy'))}
EPS growth TTM YoY: {_number(m.get('epsGrowthTTMYoy'))}
Annual debt/equity: {_number(m.get('totalDebt/totalEquityAnnual'))}"""
เราจะสร้างเครื่องมือวิเคราะห์ทางเทคนิคด้วย โดยใช้ข้อมูลย้อนหลังและตัวชี้วัดจากส่วนก่อนหน้า
@tool("Analyze Stock Technicals")
def get_technicals(ticker: str) -> str:
    """Calculate price trends, returns, moving averages, RSI, and MACD."""

    ticker = ticker.strip().upper()
    frame = add_indicators(get_price_history(ticker))

    if len(frame) < 200:
        return (
            f"Technical data unavailable for {ticker}: "
            "fewer than 200 observations."
        )

    latest = frame.iloc[-1]

    return f"""Ticker: {ticker}
Source: {frame.attrs.get('source', 'unknown')}
Last market date: {latest['date'].date()}
Close: {_number(latest['close'])}
SMA20 / SMA50 / SMA200: {_number(latest['SMA20'])} / {_number(latest['SMA50'])} / {_number(latest['SMA200'])}
RSI14: {_number(latest['RSI14'])}
MACD: {_number(latest['MACD'])}
20-day return: {_number((latest['close'] / frame['close'].iloc[-21] - 1) * 100)}%
50-day return: {_number((latest['close'] / frame['close'].iloc[-51] - 1) * 100)}%
Price vs SMA20: {_number((latest['close'] / latest['SMA20'] - 1) * 100)}%
Price vs SMA50: {_number((latest['close'] / latest['SMA50'] - 1) * 100)}%
Price vs SMA200: {_number((latest['close'] / latest['SMA200'] - 1) * 100)}%"""
ส่วนสำคัญคือตัวตกแต่ง @tool ซึ่งแปลงฟังก์ชัน Python ปกติให้เป็นเครื่องมือที่ตัวแทน CrewAI ตัดสินใจเรียกใช้ระหว่างทำงานได้
สำหรับข่าวบริษัทและความเคลื่อนไหวล่าสุด เราจะใช้เครื่องมือค้นหา Tavily ของ CrewAI:
web_search = TavilySearchTool(
    api_key=os.environ["TAVILY_API_KEY"],
    topic="news",
    search_depth="advanced",
    days=30,
    max_results=5,
)
เราจำกัดการค้นหาไว้ 30 วันที่ผ่านมา และคืนผลลัพธ์สูงสุด 5 รายการ เพื่อให้ข้อมูลล่าสุดเพียงพอโดยไม่ล้นเกินความจำเป็น
ก่อนสร้างตัวแทน ให้รันเครื่องมือแบบกำหนดเองทั้งสองโดยตรง:
print(get_fundamentals.run(ticker=TICKER))
print()
print(get_technicals.run(ticker=TICKER))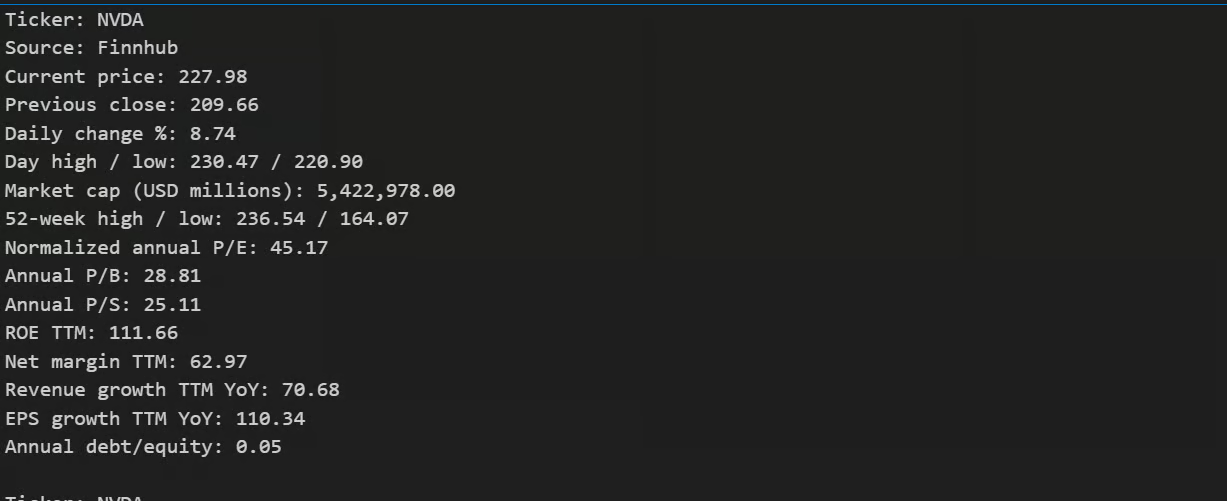
ขณะนี้ควรเห็นเมตริกพื้นฐานล่าสุด ตามด้วยตัวชี้วัดทางเทคนิคสำหรับหุ้นที่เลือก
เมื่อเครื่องมือพร้อมแล้ว เราสามารถสร้างทีมวิจัยหลายตัวแทนได้
เราจะใช้ตัวแทนผู้เชี่ยวชาญสามตัว สำหรับการวิเคราะห์พื้นฐาน เทคนิค และข่าวล่าสุด พร้อมผู้จัดการพอร์ตโฟลิโอที่ผสานสิ่งที่ค้นพบเป็นข้อประเมินสุดท้าย
ก่อนอื่น สร้างนักวิเคราะห์พื้นฐาน:
fundamental_agent = Agent(
    role="Fundamental Analyst",
    goal=(
        "Evaluate financial health, growth, profitability, "
        "valuation, and balance-sheet risk."
    ),
    backstory=(
        "You are a careful long-term equity analyst. "
        "Use the fundamentals tool and never invent a figure. "
        "Treat N/A as missing, not as zero."
    ),
    tools=[get_fundamentals],
    llm=llm,
    allow_delegation=False,
    max_iter=4,
    verbose=False,
)
ถัดไป สร้างนักวิเคราะห์เทคนิค:
technical_agent = Agent(
    role="Technical Analyst",
    goal=(
        "Determine whether the current price setup is "
        "bullish, bearish, or neutral."
    ),
    backstory=(
        "You interpret indicators calculated by Python. "
        "Never guess market prices or indicator values."
    ),
    tools=[get_technicals],
    llm=llm,
    allow_delegation=False,
    max_iter=4,
    verbose=False,
)
จากนั้นสร้างนักวิเคราะห์ข่าวการเงิน:
news_agent = Agent(
    role="Financial News Analyst",
    goal=(
        "Find material recent developments and distinguish "
        "confirmed reporting from speculation."
    ),
    backstory=(
        "You are a skeptical financial-news researcher. "
        "Prioritize primary and reputable sources, dates, and links."
    ),
    tools=[web_search],
    llm=llm,
    allow_delegation=False,
    max_iter=5,
    verbose=False,
)
ผู้เชี่ยวชาญแต่ละคนจะได้รับเฉพาะเครื่องมือที่ต้องใช้จริง ช่วยให้เวิร์กโฟลว์โฟกัสและป้องกันไม่ให้ตัวแทนเรียกเครื่องมือที่ไม่เกี่ยวข้อง
สุดท้าย สร้างตัวแทนผู้จัดการที่จะทบทวนรายงานทั้งสาม:
manager_agent = Agent(
    role="Portfolio Manager",
    goal=(
        "Combine the specialist reports into a balanced, "
        "evidence-based research signal."
    ),
    backstory=(
        "You lead an equity research team. "
        "Weigh bullish and bearish evidence, use HOLD when evidence "
        "is mixed, and never add unsupported facts."
    ),
    llm=llm,
    allow_delegation=False,
    max_iter=4,
    verbose=False,
)
ผู้จัดการพอร์ตโฟลิโอไม่ต้องเข้าถึงเครื่องมือข้อมูลโดยตรง แต่จะทำงานกับรายงานที่ตัวแทนผู้เชี่ยวชาญทั้งสามสร้างขึ้น
การตั้งค่า allow_delegation=False ช่วยให้เวิร์กโฟลว์คาดเดาได้ ส่วน max_iter จำกัดจำนวนรอบการให้เหตุผลและการใช้เครื่องมือของแต่ละตัวแทน
การสร้างตัวแทนกำหนดว่าพวกเขาเป็นใคร ตอนนี้ต้องบอกอย่างชัดเจนว่าแต่ละคนควรทำอะไรและผลลัพธ์สุดท้ายควรมีอะไรบ้าง.
เริ่มจากงานวิเคราะห์พื้นฐาน:
fundamental_task = Task(
    description=(
        f"Analyze {TICKER}'s growth, profitability, valuation, "
        "balance sheet, and business quality. "
        "Use Get Stock Fundamentals. "
        "Return a Fundamental Score from 0-100, strongest positive, "
        "biggest risk, and note all material missing data."
    ),
    expected_output=(
        "A concise fundamental assessment with a 0-100 score, "
        "evidence, strongest positive, biggest risk, "
        "and missing-data note."
    ),
    agent=fundamental_agent,
)
ถัดไป กำหนดงานวิเคราะห์ทางเทคนิค:
technical_task = Task(
    description=(
        f"Analyze {TICKER}'s technical setup. "
        "Use Analyze Stock Technicals. "
        "Consider SMA20/50/200, RSI14, MACD, recent returns, and trend. "
        "Return Technical Score 0-100, Bullish/Neutral/Bearish signal, "
        "trend, momentum, and main technical risk."
    ),
    expected_output=(
        "A concise technical assessment with score, signal, trend, "
        "momentum, data source, and main risk."
    ),
    agent=technical_agent,
)
สำหรับความเคลื่อนไหวล่าสุด สร้างงานวิจัยข่าว:
news_task = Task(
    description=(
        f"Research the most important recent news for {TICKER}, "
        "focusing on the last 30 days: earnings, guidance, analyst "
        "revisions, products, partnerships, M&A, regulation, lawsuits, "
        "management, and industry developments. "
        "Use Tavily Search. "
        "Return News Score 0-100, sentiment, positive and negative "
        "catalysts, publication dates, and source URLs. "
        "Ignore low-quality speculation."
    ),
    expected_output=(
        "A sourced recent-news assessment with score, sentiment, "
        "catalysts, dates, and clickable URLs."
    ),
    agent=news_agent,
)
การกำหนดงานและรูปแบบผลลัพธ์ชัดเจนให้แต่ละตัวแทนเป็นสิ่งสำคัญ ช่วยให้ผู้จัดการพอร์ตเปรียบเทียบรายงานได้ง่าย แทนที่จะได้รับคำตอบที่ต่างรูปแบบจากแต่ละตัวแทน
งานสุดท้ายจะรวมรายงานทั้งสามเข้าด้วยกัน:
decision_task = Task(
    description=(
        f"Review all three specialist reports and make the final "
        f"educational research assessment for {TICKER}. "
        "Return exactly one signal: BUY, HOLD, or SELL. "
        "Use HOLD when evidence is mixed or confidence is insufficient. "
        "Base every claim only on the supplied reports."
    ),
    expected_output=(
        "Ticker; Signal; Overall Score /100; Confidence %; "
        "Fundamental, Technical, and News scores; Bull Case; "
        "Bear Case; Main Catalyst; Main Risk; Final Explanation; "
        "Sources; and an educational-not-financial-advice disclaimer."
    ),
    agent=manager_agent,
    context=[
        fundamental_task,
        technical_task,
        news_task,
    ],
)
ส่วนสำคัญคือ context ซึ่งให้ผู้จัดการพอร์ตเข้าถึงผลลัพธ์จากงานผู้เชี่ยวชาญทั้งสาม ทำให้สามารถเปรียบเทียบสัญญาณพื้นฐาน เทคนิค และข่าว ก่อนสร้างข้อประเมินขั้นสุดท้ายว่า ควรซื้อ ถือ หรือขาย
ถึงตอนนี้ ตัวแทน เครื่องมือ และงาน พร้อมแล้ว ต่อไปเชื่อมทุกอย่างเป็นเวิร์กโฟลว์ของ CrewAI และรันทีมวิจัยครบชุด
ตอนนี้นำทุกอย่างมารวมกันและรันเวิร์กโฟลว์วิจัยหุ้นแบบครบถ้วน
สร้าง CrewAI crew ที่มีตัวแทนผู้เชี่ยวชาญสามคนและผู้จัดการพอร์ต:
crew = Crew(
    agents=[
        fundamental_agent,
        technical_agent,
        news_agent,
        manager_agent,
    ],
    tasks=[
        fundamental_task,
        technical_task,
        news_task,
        decision_task,
    ],
    process=Process.sequential,
    verbose=False,
    tracing=False,
)
เราใช้ Process.sequential เพื่อให้งานวิจัยรันตามลำดับ นักวิเคราะห์พื้นฐาน เทคนิค และข่าว จะทำงานก่อน แล้วผู้จัดการพอร์ตจึงรับรายงานเหล่านั้นมาสร้างข้อประเมินสุดท้าย
เริ่มเวิร์กโฟลว์แบบอะซิงโครนัส:
result = await crew.kickoff_async()ขั้นตอนนี้อาจใช้เวลาเพราะตัวแทนจะเรียก LLM และเครื่องมือหลายครั้ง จากการทดสอบ เวิร์กโฟลว์วิจัยครบชุดใช้เวลาประมาณ 4 ถึง 5 นาที
เมื่อเสร็จแล้ว แสดงรายงานสุดท้ายของผู้จัดการพอร์ต:
print(result.raw)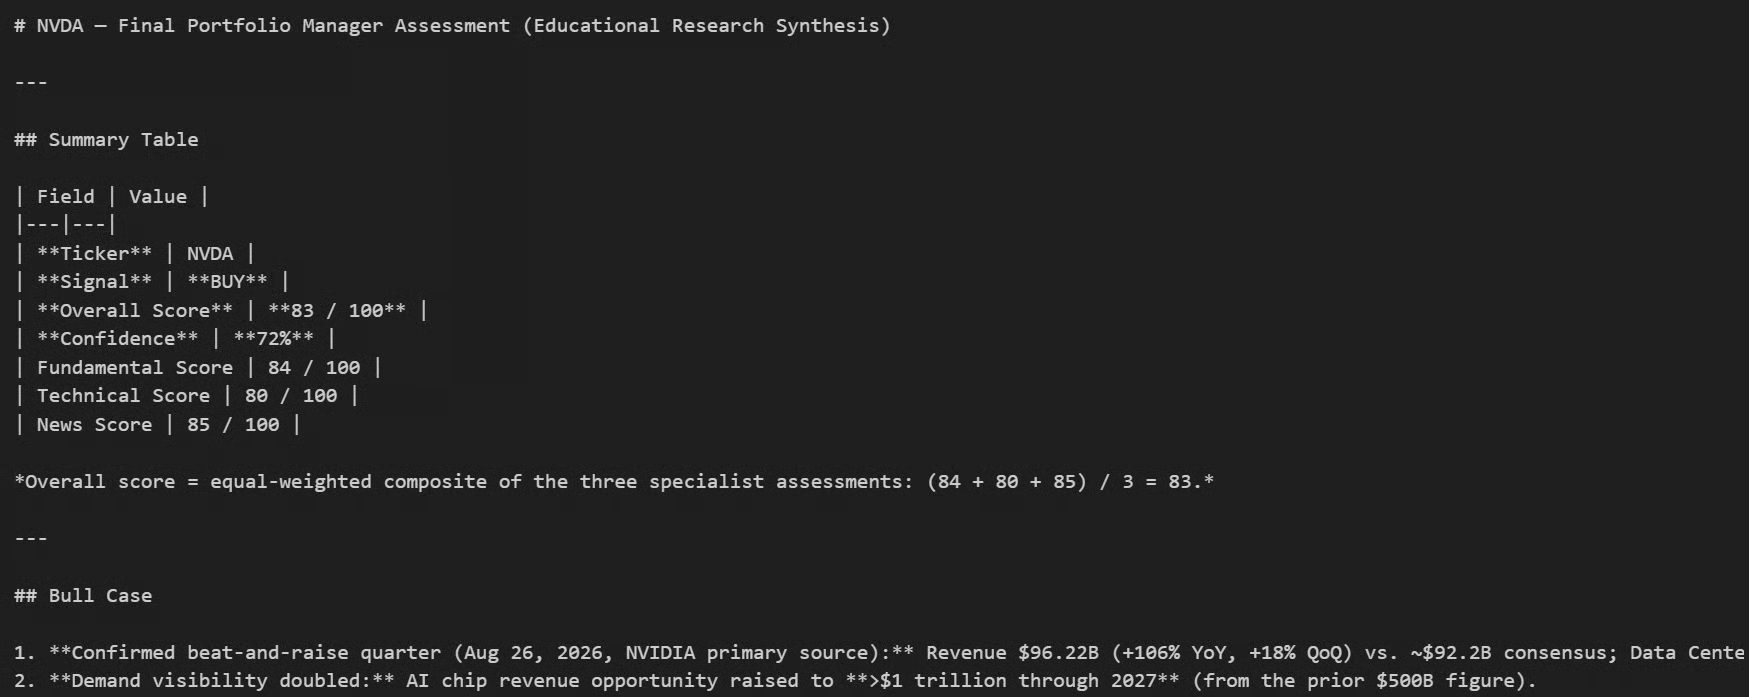
ควรได้รายงานละเอียดคล้ายตัวอย่างข้างต้น ซึ่งประกอบด้วย:
ในตัวอย่างนี้ ตัวแทนได้วิเคราะห์ NVIDIA อย่างอิสระ จากนั้นรวมสิ่งที่ค้นพบเป็นรายงานวิจัยบนหลักฐานเดียว นี่คือจุดที่เห็นประโยชน์ของแนวทางหลายตัวแทนชัดเจน: แทนที่จะขอให้โมเดลเดียวทำทุกอย่างพร้อมกัน แต่ละตัวแทนโฟกัสในด้านของตน ก่อนที่ผู้จัดการพอร์ตจะรวบรวมงานวิจัยทั้งหมดเข้าด้วยกัน
หากพบปัญหาในการรันโค้ดด้านบน เรามี Jupyter Notebook ฉบับเต็มพร้อมโค้ดและเอาต์พุตให้ตรวจหรือรันเองได้ที่: glm-stock-swarm/stock_analyst_crew.ipynb
หลังจากทดสอบทุกอย่างใน Jupyter Notebook แล้ว ได้แปลงเวิร์กโฟลว์ทั้งหมดเป็นอินเทอร์เฟซผู้ใช้แบบเทอร์มินัล (TUI) แทนที่จะรันแต่ละเซลล์ด้วยตนเอง ตอนนี้สามารถเปิดนักวิเคราะห์หุ้นแบบหลายตัวแทนทั้งชุดด้วยคำสั่งเดียว
โปรเจกต์ฉบับเต็มรวมโค้ดและคำแนะนำการตั้งค่าอยู่บน GitHub: ที่เก็บ glm-stock-swarm บน GitHub
เริ่มจากโคลนที่เก็บ:
git clone https://github.com/kingabzpro/glm-stock-swarm.git
cd glm-stock-swarm
เพิ่มคีย์ API ของ Z.ai, Finnhub และ Tavily ลงในไฟล์ .env จากนั้นติดตั้งดีเพนเดนซีทั้งหมดด้วย uv:
uv syncสุดท้าย เปิด TUI:
uv run glm-stock-swarmอินเทอร์เฟซมีช่องป้อนข้อมูลอย่างง่ายซึ่งสามารถกรอกทิกเกอร์หุ้นที่รองรับใด ๆ เพื่อเริ่มวิเคราะห์
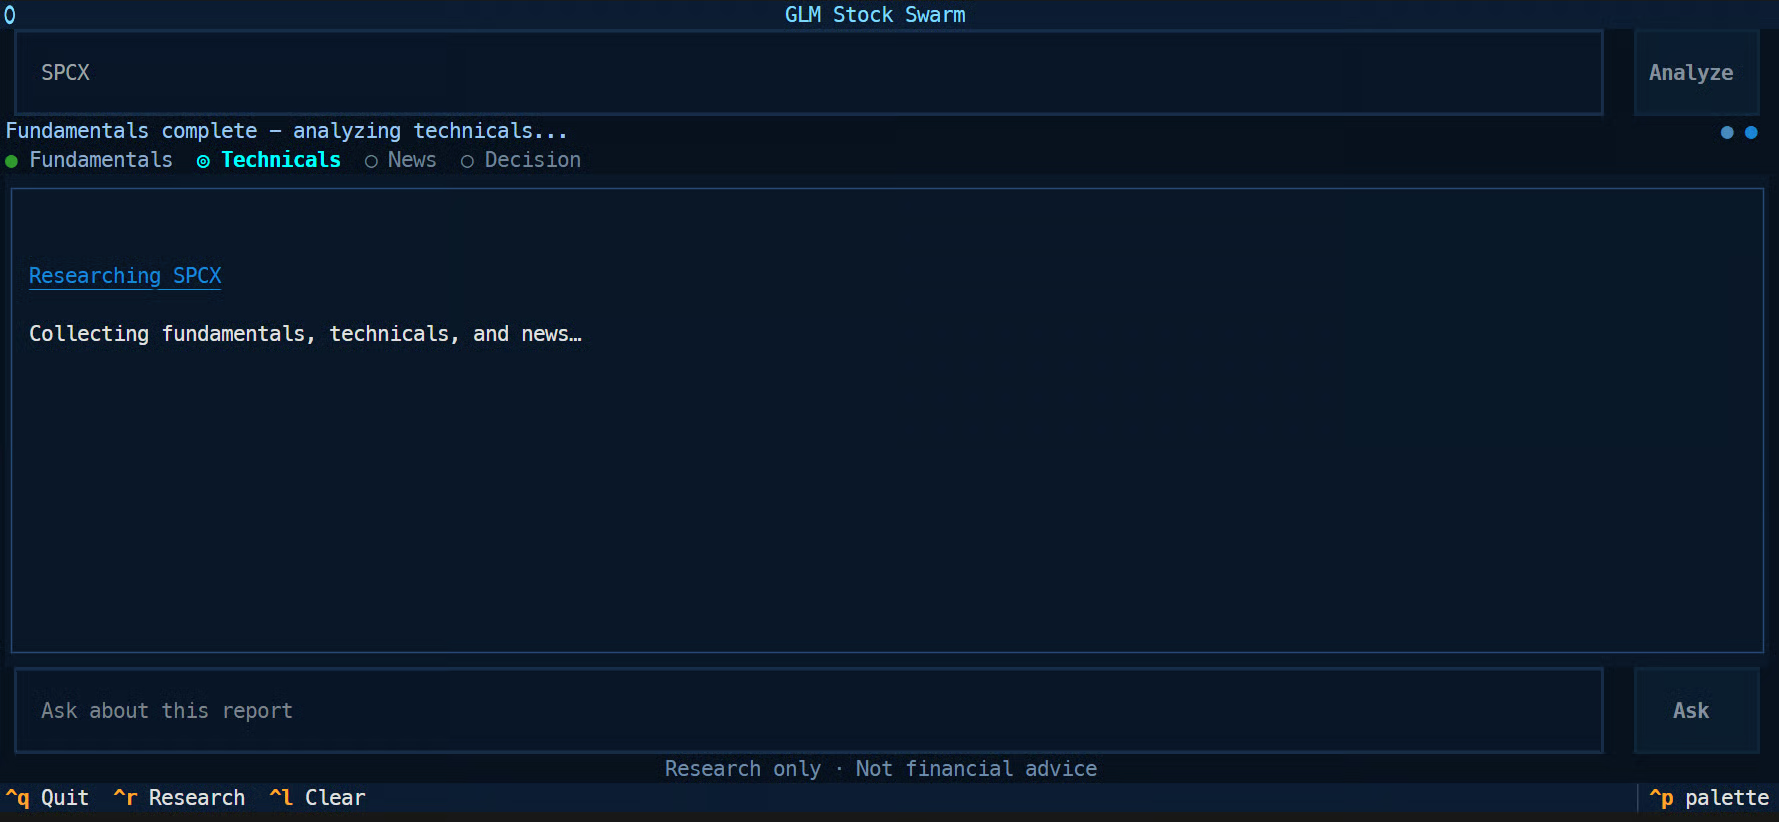
เมื่อส่งทิกเกอร์แล้ว สามารถดูตัวแทนทำงานทีละขั้นตอน นักวิเคราะห์พื้นฐานเริ่มก่อน ตามด้วยนักวิเคราะห์เทคนิค นักวิเคราะห์ข่าว และสุดท้ายผู้จัดการพอร์ตที่ผสานทุกอย่างเป็นข้อสรุป
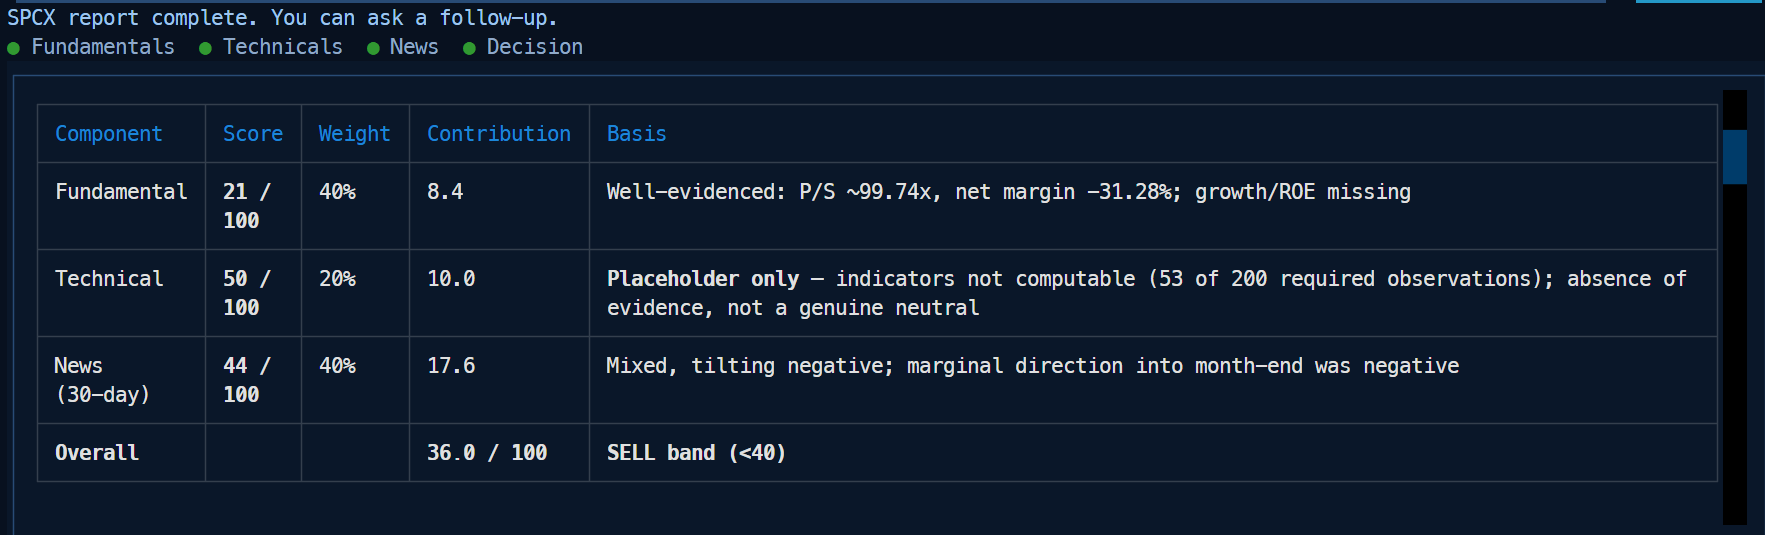
ท้ายที่สุด TUI จะสร้างรายงานครบถ้วนในเทอร์มินัลโดยตรง รวมถึงคะแนนพื้นฐาน คะแนนเทคนิค คะแนนข่าว คะแนนรวม ความเชื่อมั่น มุมมองฝั่งบวก มุมมองฝั่งลบ ความเสี่ยง ปัจจัยกระตุ้น และสัญญาณ ซื้อ ถือ หรือขาย สุดท้าย
ได้เพิ่มแช็ตติดตามผลเพื่อไม่ต้องรันไปป์ไลน์หลายตัวแทนทั้งหมดใหม่ทุกครั้งที่มีคำถามเพิ่มเติม
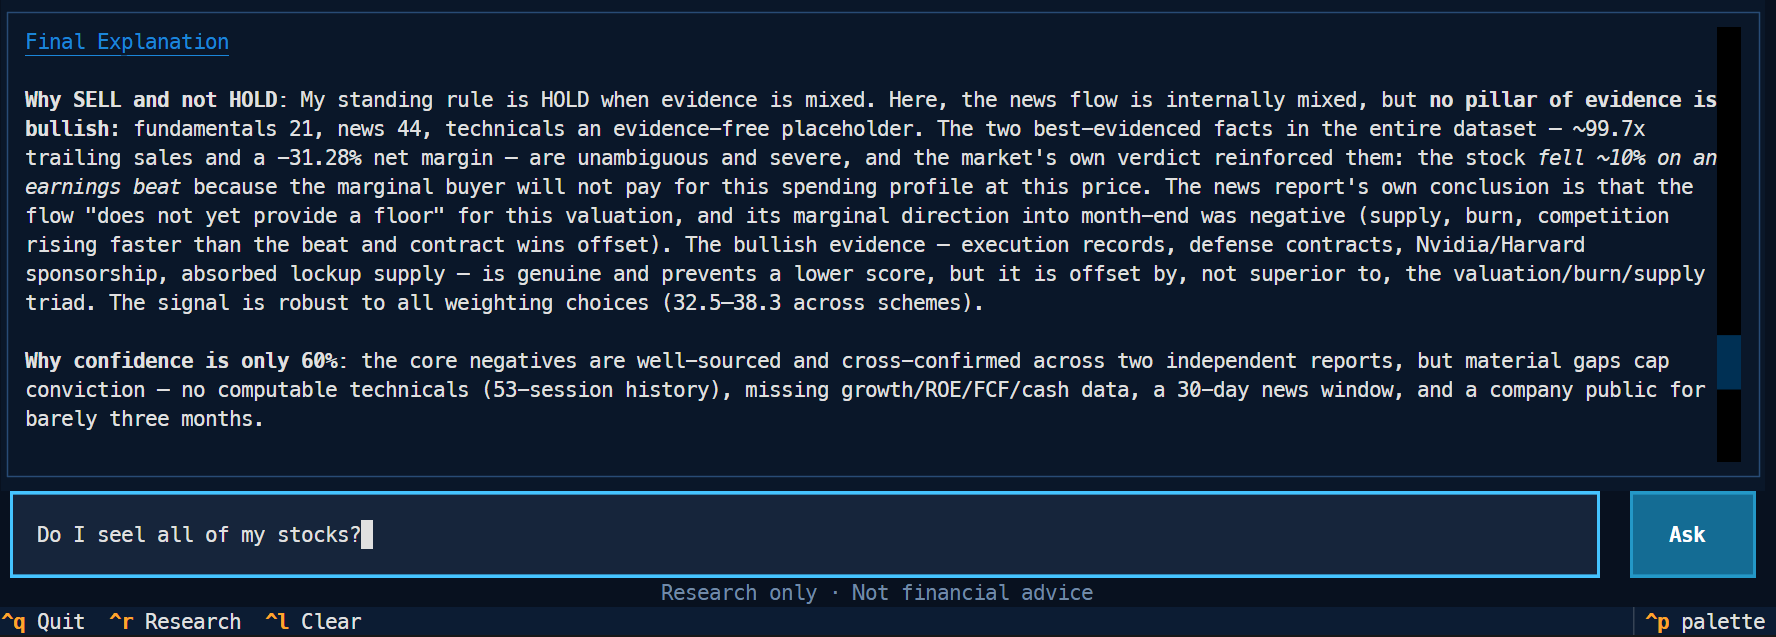
ตัวอย่างเช่น หลังจากได้รับคำแนะนำให้ขาย จึงถามว่าควรขายทั้งก้อนหรือเพียงบางส่วน
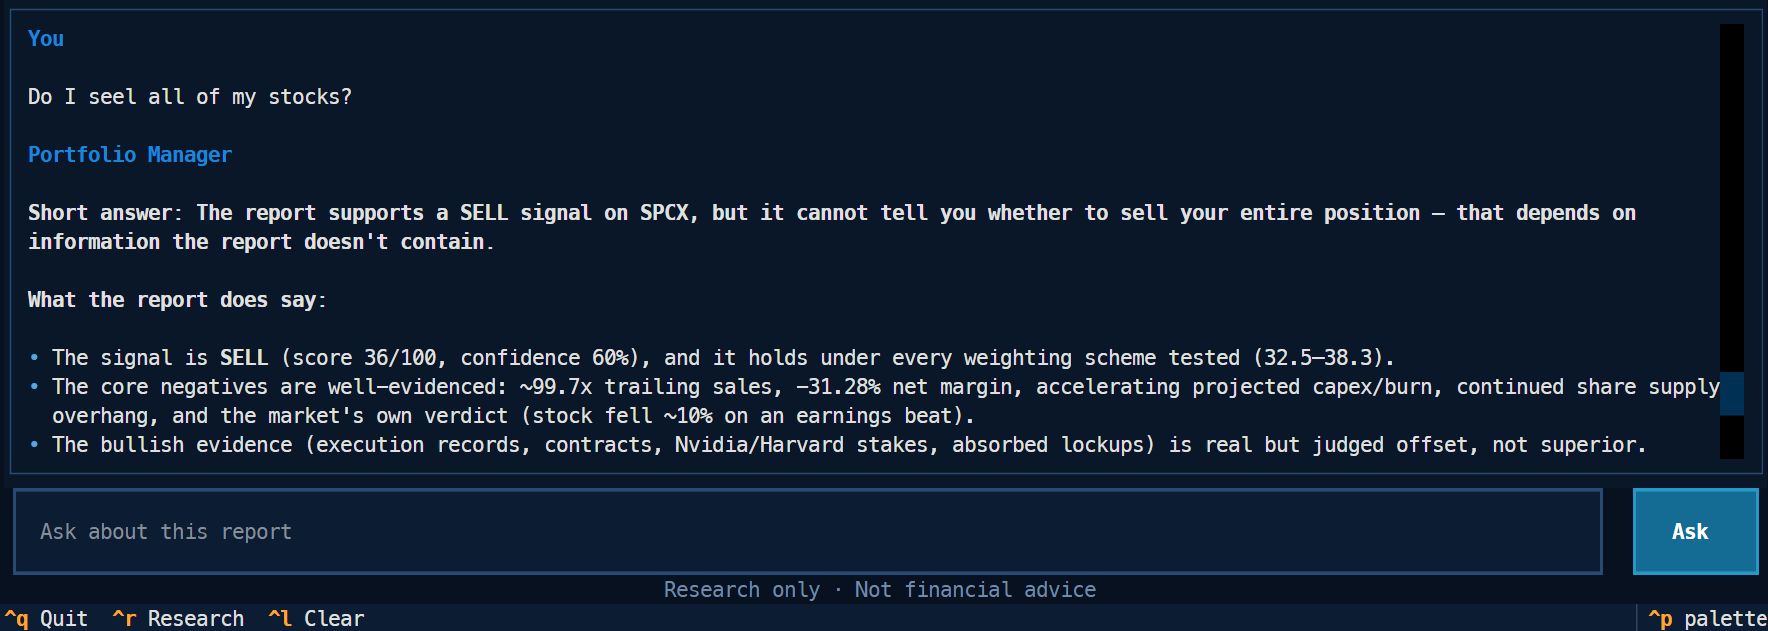
แทนที่จะเปิดตัวแทนทั้งสี่อีกครั้ง แอปจะใช้บริบทจากรายงานวิจัยที่สร้างไว้ และส่งคำตอบติดตามผลที่เร็วกว่าอย่างมาก
สิ่งนี้ทำให้แอปใช้งานได้จริงมากขึ้น เพราะงานวิจัยหลายตัวแทนที่มีค่าใช้จ่ายสูงจะรันเพียงครั้งเดียว ขณะที่คำถามติดตามผลสามารถใช้การวิเคราะห์เดิมซ้ำได้
สิ่งที่น่ารายงานจากการทดสอบคือ ความน่าเชื่อถือในการเรียกใช้เครื่องมือ ผู้เชี่ยวชาญทั้งสามเลือกเครื่องมือถูกต้อง เคารพคอนเวนชัน N/A แทนที่จะถือว่าข้อมูลหายไปเป็นศูนย์ และส่งคืนรูปแบบคะแนนพร้อมหลักฐานที่ผู้จัดการพอร์ตต้องการ ซึ่งมักเป็นจุดที่โมเดลราคาถูกล้มเหลว
ความเร็วคือข้อแลกเปลี่ยน Artificial Analysis วัด GLM-5.3-Flash ได้ราว 45 โทเค็นขาออกต่อวินาทีบน API ของ Z.ai ซึ่งอยู่ด้านล่างของช่วงสำหรับโมเดล open-weight ขนาดนี้ และสัมผัสได้ในเวลา 4 ถึง 5 นาทีที่ลูกเรือทำงานครบหนึ่งรอบ นอกจากนี้ยังได้คะแนน 57 บนดัชนีความฉลาดของพวกเขา เทียบกับ 60 สำหรับ GLM-5.3 ดังนั้นจึงยอมสละคุณภาพการให้เหตุผลเล็กน้อย แต่ถือเป็นข้อแลกเปลี่ยนที่ดีเมื่อจ่ายเพียงประมาณหนึ่งในสิบของราคา
ทั้งหมดนี้ไม่ผูกมัด สามารถสลับไปยัง OpenRouter, Hugging Face Inference หรือโมเดลโลคัลผ่าน Ollama ได้ โดยปกติเปลี่ยนเพียงสามอย่าง: คีย์ API ชื่อโมเดล และ base URL เครื่องมือก็เช่นกัน ที่ yfinance ก็ทำงานแทน Finnhub และ Yahoo ที่ใช้ร่วมกันที่นี่ได้
ก้าวต่อไปคือเชื่อมกับ API กระดาษเทรดและตั้งเวลาให้รันตอนเช้า ควรใช้บัญชีเดโมเท่านั้น โปรเจกต์นี้สร้างขึ้นเพื่อสอนการออกแบบตัวแทน ไม่ใช่เพื่อเทรดจริง
หากต้องการเรียนรู้เรื่อง agentic AI ตั้งแต่พื้นฐาน แนะนำ AI Agent Fundamentals skill track ของเราเป็นจุดเริ่มต้นที่ยอดเยี่ยม
เรียนรู้ Agentic AI กับ DataCamp!
{count, plural, other {แทร็ก}}
{count, plural, other {คอร์ส}}
{count, plural, other {คอร์ส}}