programa
SQL para Administradores de Bases de Datos
16 h
OLAP’s integration with data warehouses has allowed data analysts to find patterns and relationships within the data at a much faster speed and at a much higher level of efficiency. But the work of OLAP, which stands for Online Analytical Processing, happens under the hood, so to speak. So, you might be a skilled analyst working with data in a business intelligence tool and be supported by OLAP, but you do not necessarily know what OLAP is or how helpful it is.
In this article, we will learn more about OLAP and how it works so you can fully appreciate it. For a super in-depth look at how OLAP figures into databases, try taking our Database Design course, which will provide a full view and is sure to make you an expert in not only the idea of OLAP but also how it's placed in the larger context of databases.
You might be a senior analyst, but you are still wondering: What is OLAP, or online analytical processing? In short, OLAP is a data processing technique that has changed how we analyze massive amounts of data. Because OLAP has become a big and important part of our data workflows, analysts might be working with OLAP advancements without even realizing it.
With OLAP, data analysts can rapidly analyze complex queries to transform enormous datasets into the actionable insights that our supervisors often ask for. With OLAP, analysts can perform multidimensional analysis, meaning they look at dimensions such as time, geography, and hierarchical categories in order to see patterns and trends that would probably be difficult to detect if you were working with tables and had to find associations without OLAP.
OLAP. Source: CSUS coursework online
Let’s look at how OLAP is involved in manipulating large datasets. The best part is you can perform these operations in real-time. I think about these three specific actions:
For instance, OLAP helps us extract sales data by region, drill into the details to analyze sales performance for each individual store, and then aggregate all the info to provide overall sales trends.
Any discussion of OLAP is remiss without talking about OLAP cubes. An OLAP cube, also known as a hypercube, is a kind of data structure that permits fast and multi-dimensional analysis of extensive data beyond what can be achieved by relational databases. Its key features include the following:
Simply put, OLAP cubes take our tables, which are flat and two-dimensional (think like spreadsheets), and elevate them into something that has three (or many more) dimensions. OLAP cubes add additional layers and associations. They organize data appropriately to support complex analytical queries and reporting at a much higher speed.
Analyzing large volumes of multidimensional data begins with collecting data from various sources and storing it in data warehouses, followed by creating OLAP cubes for fast and efficient querying. Here's a visual so you can see OLAP's place in this:
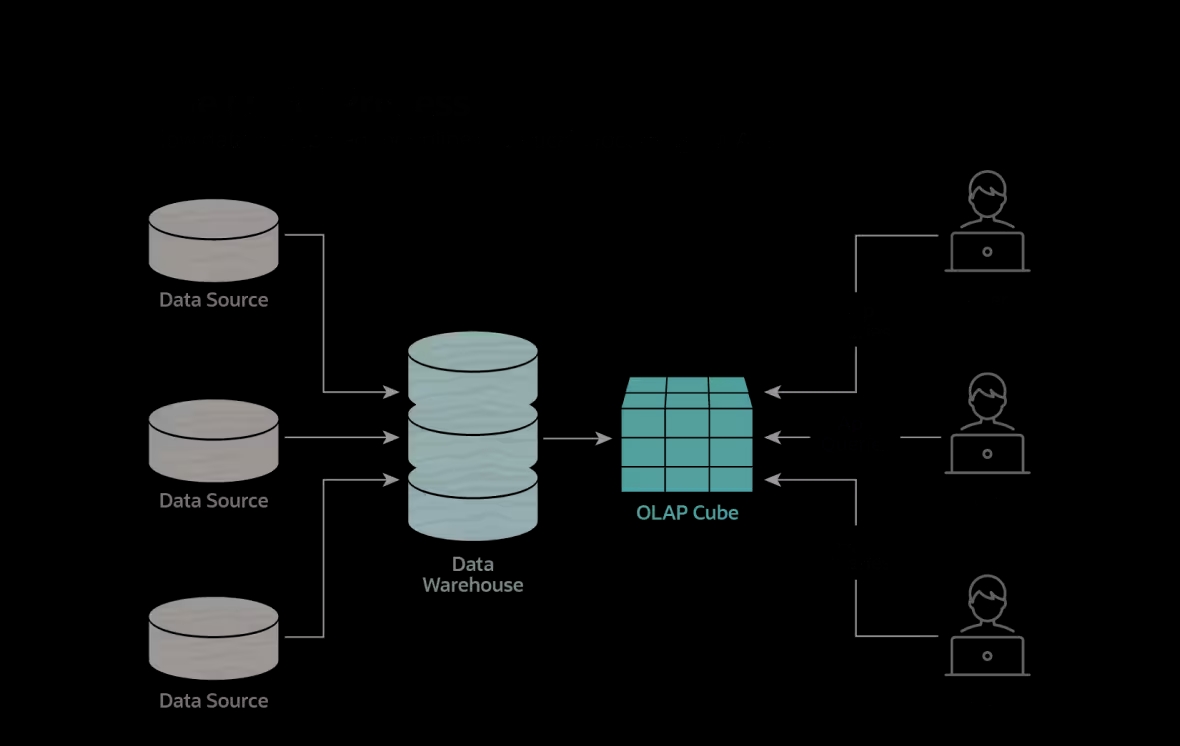
OLAP working process. Source: NetSuite
Data is extracted from multiple sources, such as transactional databases and external systems. Then, the extracted data undergoes a transformation process to maintain quality. It’s then loaded into a centralized data warehouse optimized for analytical queries and historical data storage.
OLAP cubes are pre-calculated, multidimensional data structures built from the data stored in the data warehouse. They organize data along various predefined dimensions and hierarchies (e.g., time, product, location) and measures (e.g., sales, quantity). This pre-calculation of aggregations is a key part of OLAP, and it's really what gives rapid query responses. Because OLAP cubes are pre-aggregated at various levels, we can access summarized data without having to write the same SQL query on raw data.
OLAP cubes make it easier to access summarized data at different granularity levels quickly. You can perform complex analytical queries without impacting the source systems and enjoy more flexible data exploration. Here are some of the key OLAP operations that data analysts can perform:
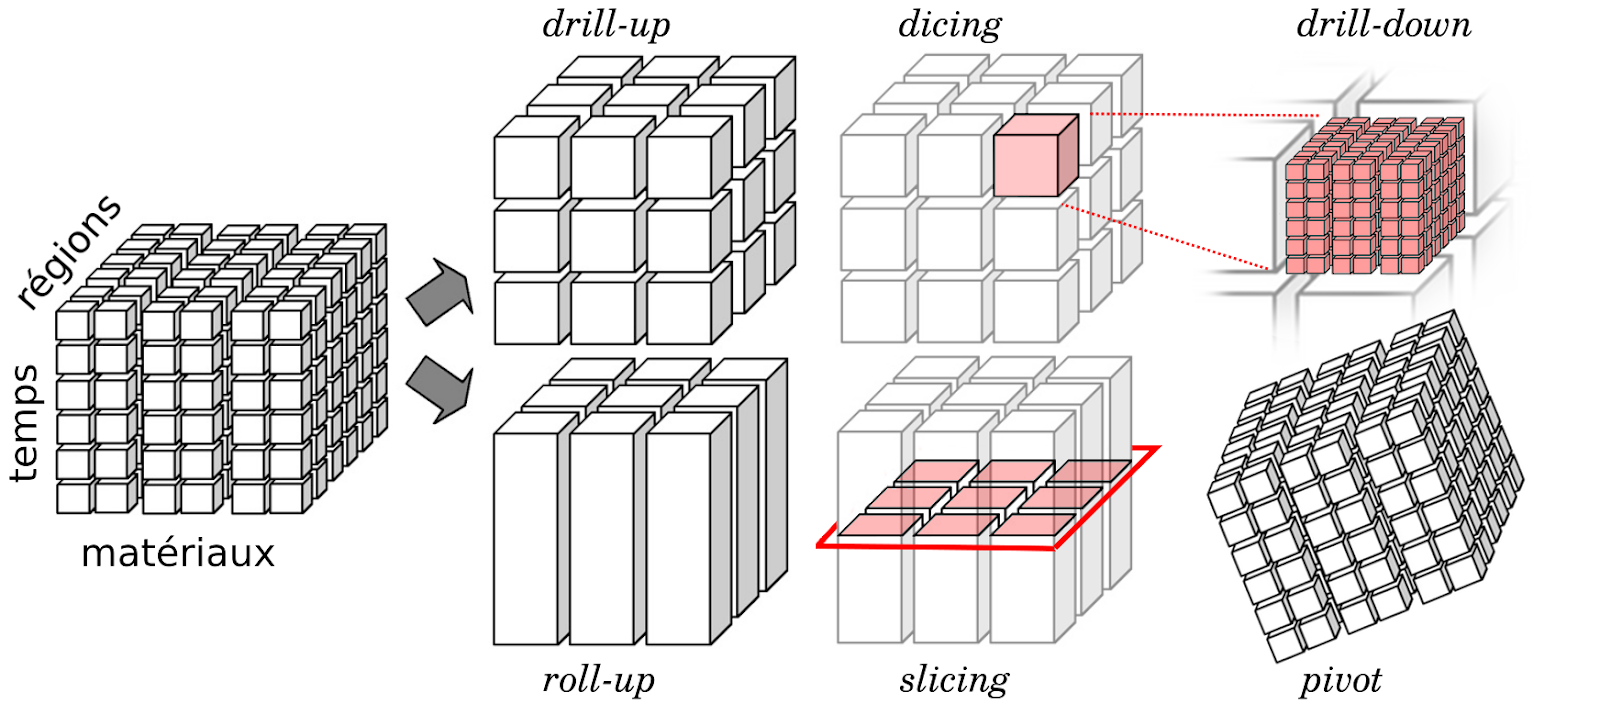
Basic OLAP operations. Source: Wikimedia
There are different types of OLAP systems, each with different usage and benefits. Let’s summarize the types with a table.
| OLAP Type | Summary | Benefits |
|---|---|---|
| Multidimensional OLAP (MOLAP) | It uses a multidimensional database to store pre-computed data in cube structures. | Suitable for complex calculations. Optimized for multidimensional analysis. |
| Relational OLAP (ROLAP) | It works with relational databases to access data using SQL queries. | Can handle large data volumes. Leans on existing relational database technology. More flexible for changing data structures. |
| Hybrid OLAP (HOLAP) | HOLAP stores some data in a multidimensional format and some in a relational format. | Balances performance and scalability. Offers flexibility in data storage and access. Can be optimized based on specific use cases. |
Now that we have looked at different types of OLAP systems, we can compare OLAP versus OLTP. Unlike OLAP, OTLP, which stands for online transaction processing, is designed for transaction processing rather than analytical processing. OLAP is focused on data analysis and querying, but OLTP is centered around real-time transaction processing and data integrity in operational databases.
Generally speaking, OLAP handles more complex queries so businesses can make better decisions. An OLTP system handles day-to-day transactions to maintain data integrity and service various applications, like order entry and inventory control.
More specifically, and in the language of data engineering and architecture, we can say that OLAP uses a multidimensional data model with a denormalized schema that is best for fast querying and read-heavy operations. OLTP, on the other hand, uses a normalized relational data model optimized for write-heavy operations to ensure consistency in real-time transactions. Let's capture the differences in a table:
| Feature | OLAP (Online Analytical Processing) | OLTP (Online Transaction Processing) |
|---|---|---|
| Purpose | Complex queries and data analysis for decision-making | Handling day-to-day transactions and maintaining data integrity |
| Data Model | Multidimensional data model with denormalized schema | Normalized relational data model |
| Operations | Read-heavy operations | Write-heavy operations |
| Query Complexity | Supports complex queries and multidimensional analysis | Optimized for simple, short online transactions |
| Data Redundancy | Higher redundancy due to denormalized schema | Lower redundancy due to normalized schema |
| Performance Focus | Fast querying and analysis | Quick processing and maintaining data accuracy |
| Use Cases | Business intelligence, data warehousing, analytics | Order entry, inventory control, customer relationship management |
Let’s now document the key benefits of OLAP, some of which we touched on above.
Here are key factors to consider while implementing OLAP solutions within your organization:
Some of the most common tools with OLAP capabilities include IBM Cognos and Oracle OLAP. These tools come with various advanced analytics capabilities to meet different needs.
As we have seen, OLAP changes raw data into actionable insights by allowing multidimensional analysis and rapid querying. To better familiarize yourself with data processing and analysis, check out our Database Design course, Data Warehousing Concepts course, and Introduction to Data Engineering course.
Also, if you're learning about OLAP, chances are you are working with SQL. DataCamp offers many SQL courses and skill tracks to help you improve your skills, including our SQL for Database Administrators skill track, our Introduction to Relational Databases in SQL course, and our Data-Driven Decision Making in SQL project.
Learn with DataCamp
programa
Curso
Curso
Tutorial
Hafsa Jabeen
Tutorial
Allan Ouko
Tutorial
Parul Pandey
Tutorial
Joleen Bothma
code-along
Jasmin Ludolf
code-along
Kelsey McNeillie