यह चीट शीट हमेशा पास रखें
PDF डाउनलोड करेंWhat are Data Quality Dimensions?
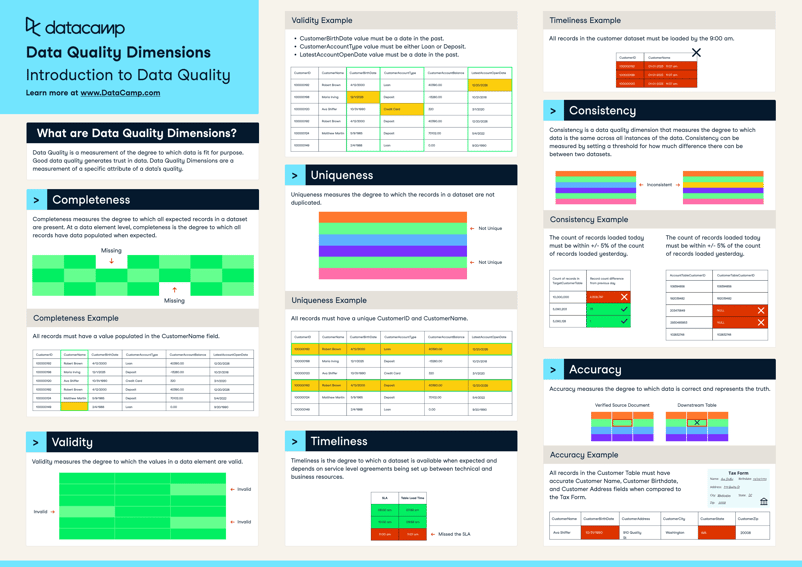
Data Quality is a measurement of the degree to which data is fit for purpose. Good data quality generates trust in data. Data Quality Dimensions are a measurement of a specific attribute of a data's quality.
Completeness
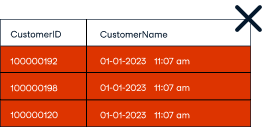
Completeness measures the degree to which all expected records in a dataset are present. At a data element level, completeness is the degree to which all records have data populated when expected.

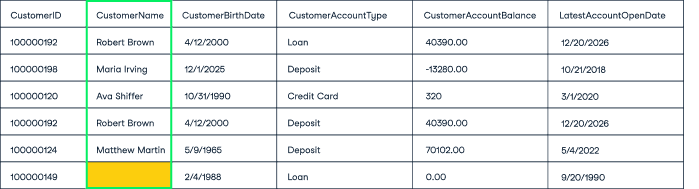
Completeness Example
All records must have a value populated in the CustomerName field.
Validity
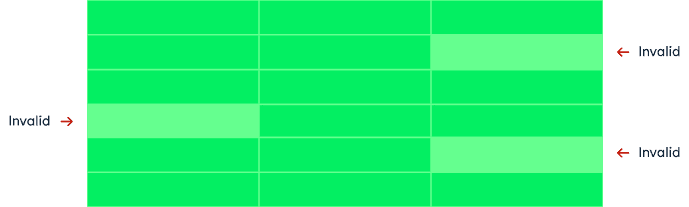
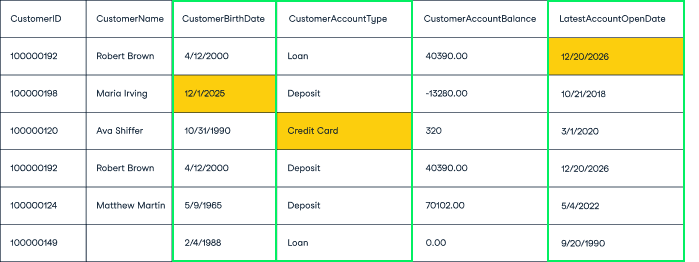
Validity measures the degree to which the values in a data element are valid.
Validity Example
- CustomerBirthDate value must be a date in the past.
- CustomerAccountType value must be either Loan or Deposit.
- LatestAccountOpenDate value must be a date in the past.
Uniqueness
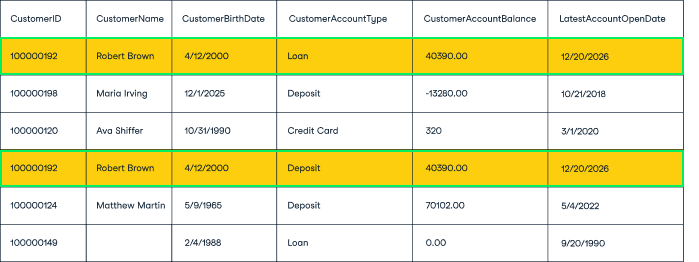
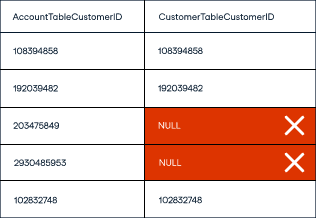
Uniqueness measures the degree to which the records in a dataset are not duplicated.

Uniqueness Example
All records must have a unique CustomerID and CustomerName.
Timeliness
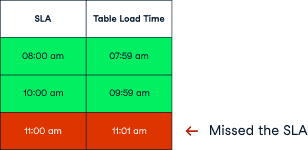
Timeliness is the degree to which a dataset is available when expected and depends on service level agreements being set up between technical and business resources.
Timeliness Example
All records in the customer dataset must be loaded by the 9:00 am.
Consistency
Consistency is a data quality dimension that measures the degree to which data is the same across all instances of the data. Consistency can be measured by setting a threshold for how much difference there can be between two datasets.

Consistency Example
The count of records loaded today must be within +/- 5% of the count of records loaded yesterday.
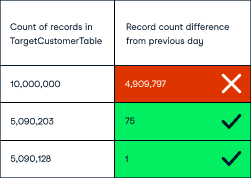
The count of records loaded today must be within +/- 5% of the count of records loaded yesterday.
Accuracy
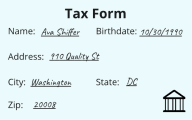
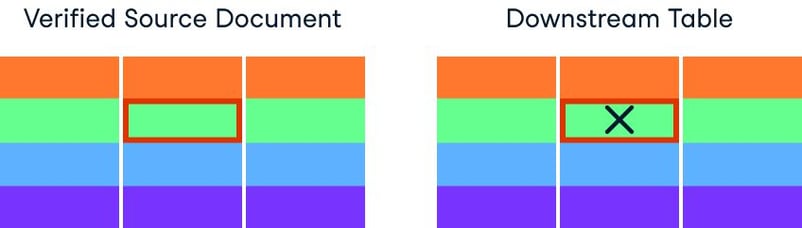
All records in the Customer Table must have accurate Customer Name, Customer Birthdate, and Customer Address fields when compared to the Tax Form.
Accuracy Example
All records in the Customer Table must have accurate Customer Name, Customer Birthdate, and Customer Address fields when compared to the Tax Form.