मुख्य सामग्री पर जाएं

Python with AI Cheat Sheet

Use AI to write Python code for data science. This cheat sheet covers prompting principles and ready-to-run snippets for pandas, NumPy, lists, dictionaries, strings, and file paths.
22 मई 2026  · 5 मि॰ पढ़ना

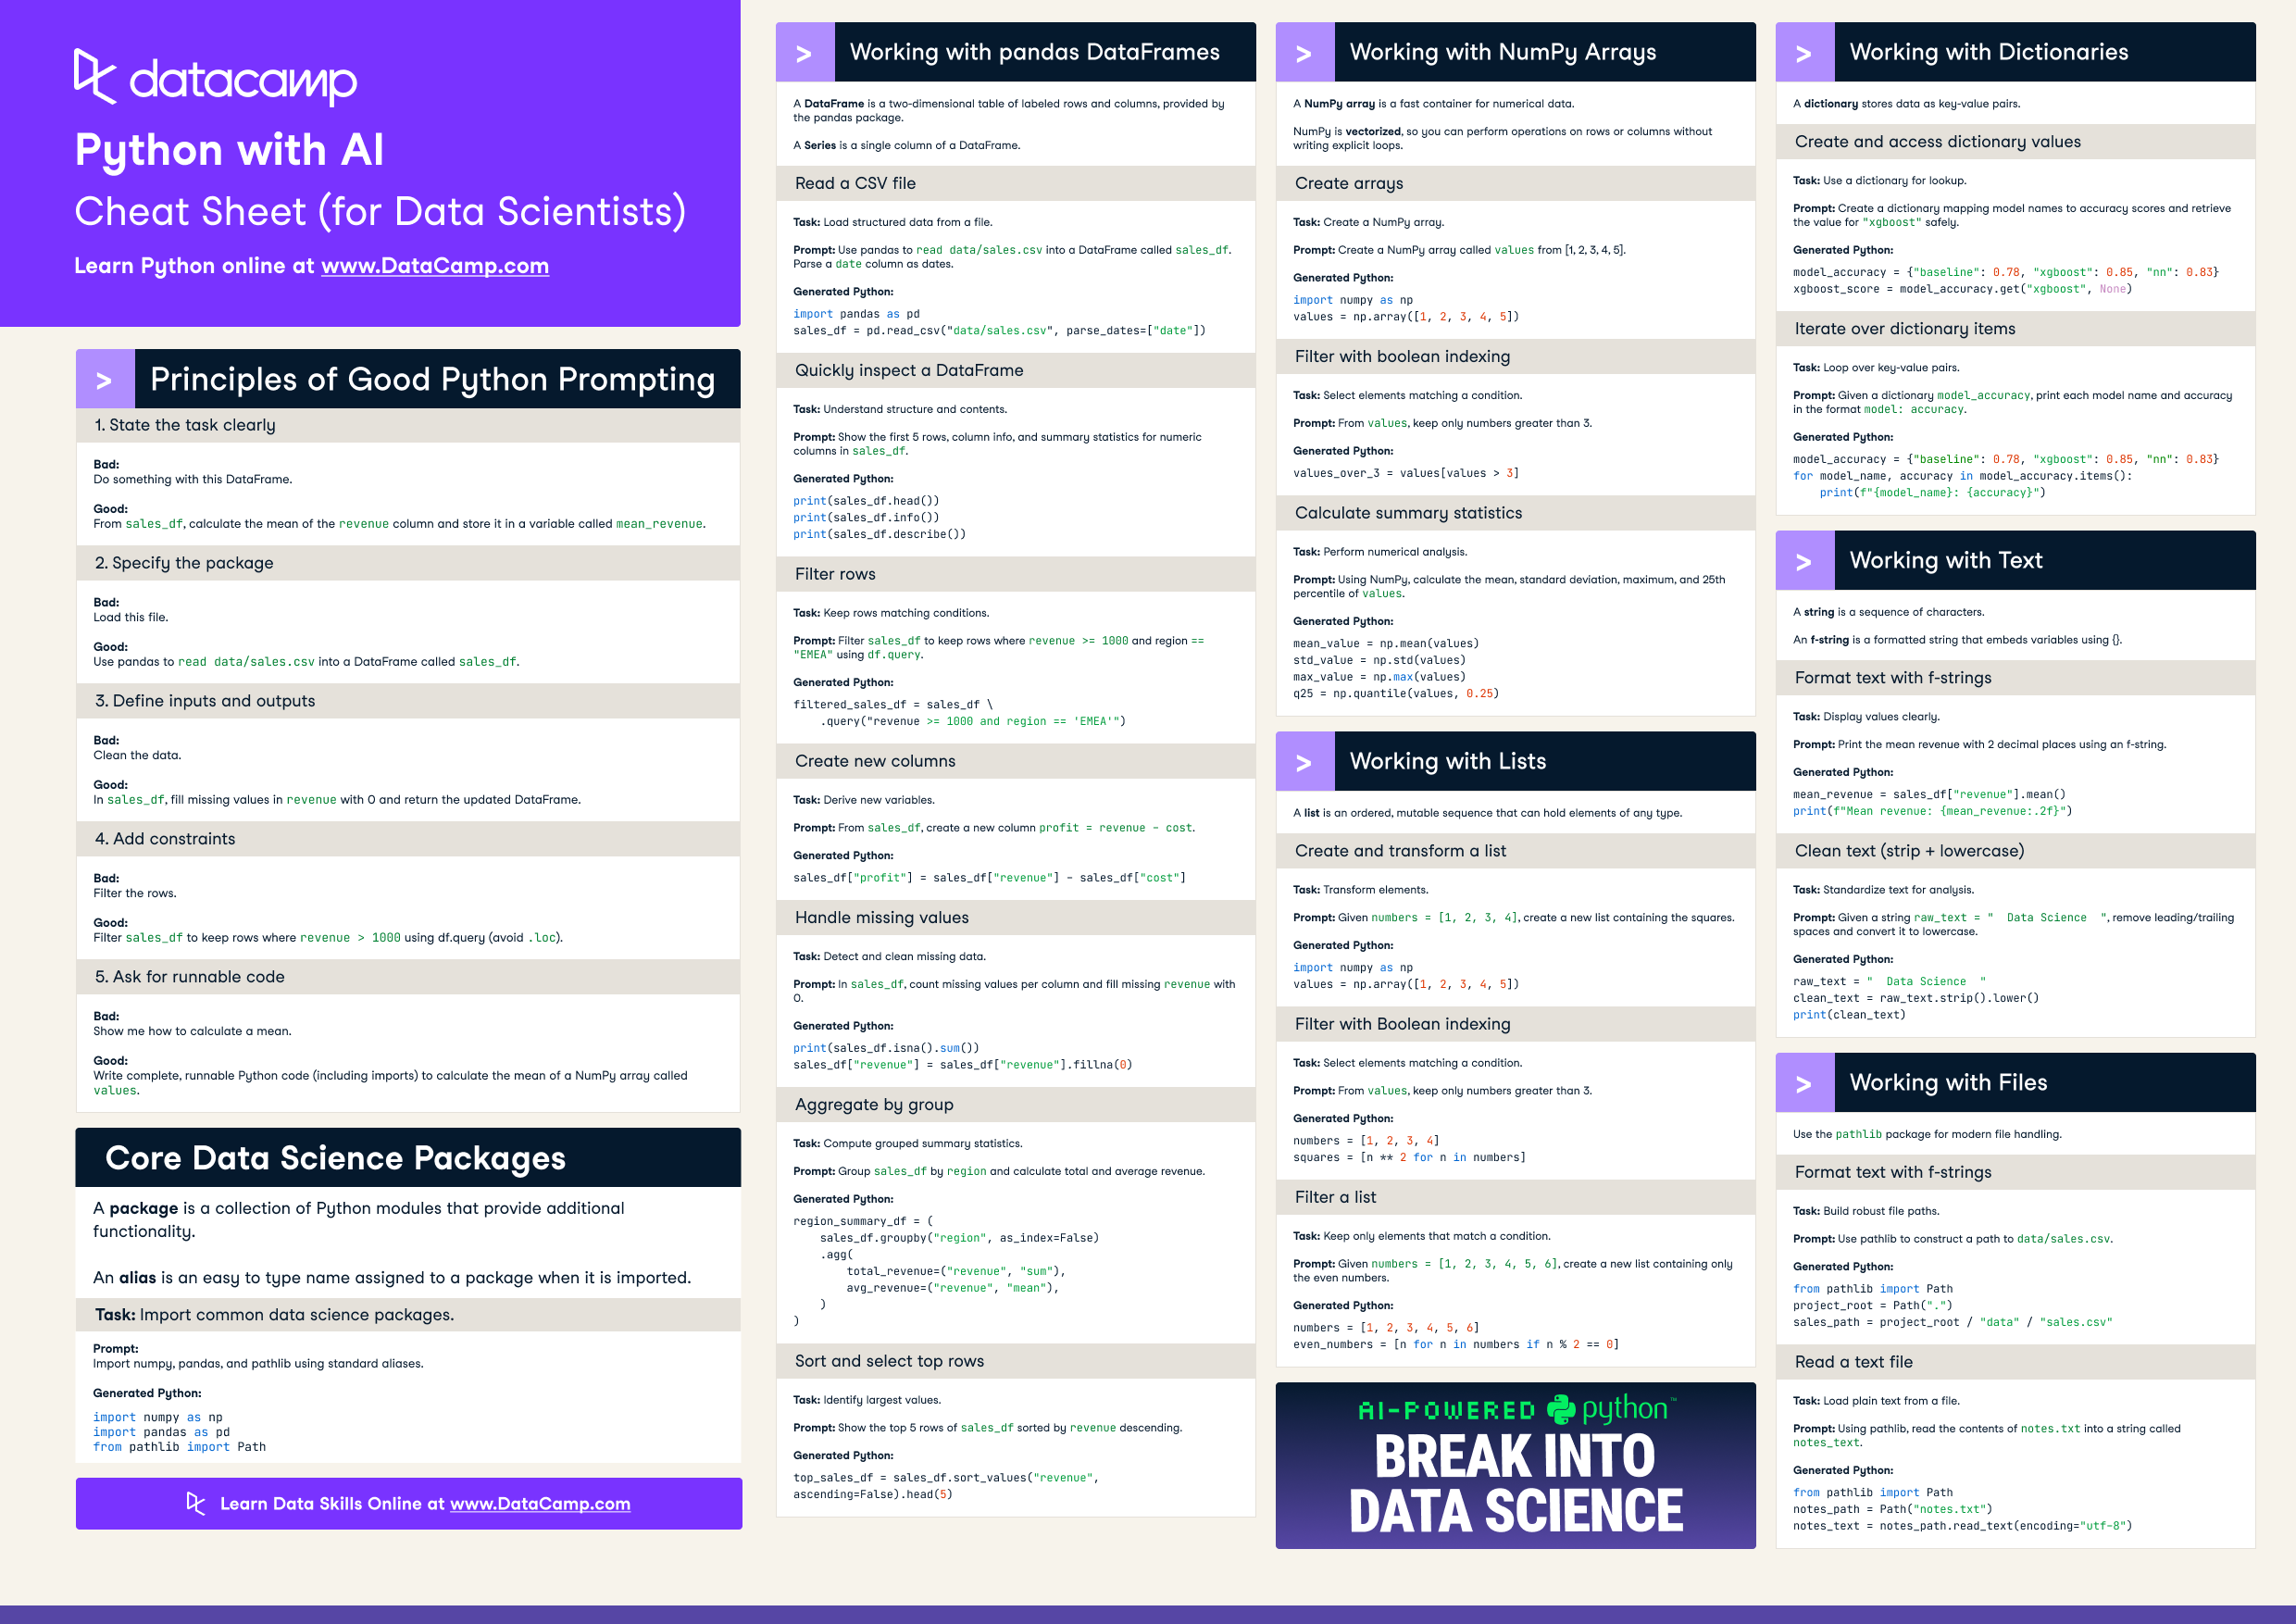
Python with AI (2).png

Have this cheat sheet at your fingertips

Download PDF

Writing Python for data science is faster when AI handles the syntax. This cheat sheet covers prompting principles that produce reliable code, plus ready-to-run snippets for the packages and data structures you use every day: pandas, NumPy, lists, dictionaries, strings, and file paths.

Principles of good Python prompting

When using AI to generate Python, vague prompts produce fragile code. Clear prompts produce reliable code.

1. State the task clearly

Bad:

Do something with this DataFrame.

Good:

From sales_df, calculate the mean of the revenue column and store it in a variable called mean_revenue.

2. Specify the package

Bad:

Load this file.

Good:

Use pandas to read data/sales.csv into a DataFrame called sales_df.

3. Define inputs and outputs

Bad:

Clean the data.

Good:

In sales_df, fill missing values in revenue with 0 and return the updated DataFrame.

4. Add constraints

Bad:

Filter the rows.

Good:

Filter sales_df to keep rows where revenue > 1000 using df.query (avoid .loc).

5. Ask for runnable code

Bad:

Show me how to calculate a mean.

Good:

Write complete, runnable Python code (including imports) to calculate the mean of a NumPy array called values.

Core data science packages

A package is a collection of Python modules that provide additional functionality. An alias is an easy-to-type name assigned to a package when it is imported.

Import common packages

Prompt:

Import numpy, pandas, and pathlib using standard aliases.

Generated Python:

import numpy as np
import pandas as pd
from pathlib import Path

Working with DataFrames (pandas)

A DataFrame is a two-dimensional table of labeled rows and columns, provided by the pandas package. A Series is a single column of a DataFrame.

Read a CSV file

Prompt:

Use pandas to read data/sales.csv into a DataFrame called sales_df. Parse a date column as dates.

Generated Python:

import pandas as pd
sales_df = pd.read_csv("data/sales.csv", parse_dates=["date"])

Quickly inspect a DataFrame

Prompt:

Show the first 5 rows, column info, and summary statistics for numeric columns in sales_df.

Generated Python:

print(sales_df.head())
print(sales_df.info())
print(sales_df.describe())

Filter rows

Prompt:

Filter sales_df to keep rows where revenue >= 1000 and region == "EMEA" using df.query.

Generated Python:

filtered_sales_df = sales_df.query("revenue >= 1000 and region == 'EMEA'")

Create new columns

Prompt:

From sales_df, create a new column profit = revenue - cost.

Generated Python:

sales_df["profit"] = sales_df["revenue"] - sales_df["cost"]

Handle missing values

Prompt:

In sales_df, count missing values per column and fill missing revenue with 0.

Generated Python:

print(sales_df.isna().sum())
sales_df["revenue"] = sales_df["revenue"].fillna(0)

Aggregate by group

Prompt:

Group sales_df by region and calculate total and average revenue.

Generated Python:

region_summary_df = (
    sales_df.groupby("region", as_index=False)
    .agg(
        total_revenue=("revenue", "sum"),
        avg_revenue=("revenue", "mean"),
    )
)

Sort and select top rows

Prompt:

Show the top 5 rows of sales_df sorted by revenue descending.

Generated Python:

top_sales_df = sales_df.sort_values("revenue", ascending=False).head(5)

Working with NumPy arrays

A NumPy array is a fast container for numerical data. NumPy is vectorized, so you can perform operations on rows or columns without writing explicit loops.

Create arrays

Prompt:

Create a NumPy array called values from [1, 2, 3, 4, 5].

Generated Python:

import numpy as np
values = np.array([1, 2, 3, 4, 5])

Filter with boolean indexing

Prompt:

From values, keep only numbers greater than 3.

Generated Python:

values_over_3 = values[values > 3]

Calculate summary statistics

Prompt:

Using NumPy, calculate the mean, standard deviation, maximum, and 25th percentile of values.

Generated Python:

mean_value = np.mean(values)
std_value = np.std(values)
max_value = np.max(values)
q25 = np.quantile(values, 0.25)

Working with lists

A list is an ordered, mutable sequence that can hold elements of any type.

Create and transform a list

Prompt:

Given numbers = [1, 2, 3, 4], create a new list containing the squares.

Generated Python:

numbers = [1, 2, 3, 4]
squares = [n ** 2 for n in numbers]

Filter a list

Prompt:

Given numbers = [1, 2, 3, 4, 5, 6], create a new list containing only the even numbers.

Generated Python:

numbers = [1, 2, 3, 4, 5, 6]
even_numbers = [n for n in numbers if n % 2 == 0]

Working with dictionaries

A dictionary stores data as key-value pairs.

Create and access dictionary values

Prompt:

Create a dictionary mapping model names to accuracy scores and retrieve the value for "xgboost" safely.

Generated Python:

model_accuracy = {"baseline": 0.78, "xgboost": 0.85, "nn": 0.83}
xgboost_score = model_accuracy.get("xgboost", None)

Iterate over dictionary items

Prompt:

Given a dictionary model_accuracy, print each model name and accuracy in the format model: accuracy.

Generated Python:

model_accuracy = {"baseline": 0.78, "xgboost": 0.85, "nn": 0.83}
for model_name, accuracy in model_accuracy.items():
    print(f"{model_name}: {accuracy}")

Working with text

A string is a sequence of characters. An f-string is a formatted string that embeds variables using {}.

Format text with f-strings

Prompt:

Print the mean revenue with 2 decimal places using an f-string.

Generated Python:

mean_revenue = sales_df["revenue"].mean()
print(f"Mean revenue: {mean_revenue:.2f}")

Clean text (strip and lowercase)

Prompt:

Given a string raw_text = "  Data Science  ", remove leading/trailing spaces and convert it to lowercase.

Generated Python:

raw_text = "  Data Science  "
clean_text = raw_text.strip().lower()
print(clean_text)

Working with file paths

Use the pathlib package for modern file handling.

Construct file paths

Prompt:

Use pathlib to construct a path to data/sales.csv.

Generated Python:

from pathlib import Path
project_root = Path(".")
sales_path = project_root / "data" / "sales.csv"

Read a text file

Prompt:

Using pathlib, read the contents of notes.txt into a string called notes_text.

Generated Python:

from pathlib import Path
notes_path = Path("notes.txt")
notes_text = notes_path.read_text(encoding="utf-8")
विषय

Continue your Python with AI journey

Track

एसोसिएट डेटा वैज्ञानिक में Python

90 घंटा
Python में डेटा विज्ञान सीखें, डेटा मैनिपुलेशन से लेकर मशीन लर्निंग तक. यह ट्रैक आपको डेटा वैज्ञानिक के रूप में सफल होने के लिए आवश्यक कौशल प्रदान करता है!
विस्तृत जानकारी देखेंRight Arrow
कोर्स शुरू करें
और देखेंRight Arrow
संबंधित

cheat-sheet

Pandas Cheat Sheet for Data Science in Python

A quick guide to the basics of the Python data analysis library Pandas, including code samples.
Karlijn Willems's photo

Karlijn Willems

cheat-sheet

Python for Data Science - A Cheat Sheet for Beginners

This handy one-page reference presents the Python basics that you need to do data science
Karlijn Willems's photo

Karlijn Willems

cheat-sheet

Scikit-Learn Cheat Sheet: Python Machine Learning

A handy scikit-learn cheat sheet to machine learning with Python, including some code examples.
Karlijn Willems's photo

Karlijn Willems

cheat-sheet

Python For Data Science Cheat Sheet For Beginners

This cheat sheet covers the basics that you need to know to do data science with Python
Karlijn Willems's photo

Karlijn Willems

cheat-sheet

Python Cheat Sheet for Beginners

Python is the most popular programming language in data science. Use this cheat sheet to jumpstart your Python learning journey.
Richie Cotton's photo

Richie Cotton

tutorial

Python For Data Science - A Cheat Sheet For Beginners

This handy one-page reference presents the Python basics that you need to do data science
Karlijn Willems's photo

Karlijn Willems

और देखेंऔर देखें