
Corso
Introduzione a MongoDB in Python
3 h
24.1K
Mantenere un database MongoDB in salute è essenziale per garantire la stabilità dell’applicazione, prestazioni ottimali e integrità dei dati. Un cluster “sano” serve in modo affidabile letture e scritture, protegge i dati dalla perdita e opera entro parametri operativi previsti. Controlli regolari e monitoraggio proattivo sono cruciali per individuare e risolvere potenziali problemi prima che impattino il tuo servizio.
Possiamo suddividere lo stato di salute del tuo cluster MongoDB in tre aree fondamentali:
Valutando regolarmente queste aree, garantisci che la tua piattaforma dati sia solida e affidabile. Inoltre, strumenti di gestione moderni come MongoDB Atlas e MongoDB Ops Manager offrono monitoraggio integrato con avvisi e raccomandazioni per aiutarti ad anticipare i potenziali problemi. Configurare gli avvisi dovrebbe aiutarti a tenere tutto sotto controllo. Puoi trovare istruzioni ed esempi su come impostare gli avvisi nella documentazione ufficiale di MongoDB.
Vediamo queste aree.
La replica è la spina dorsale dell’alta disponibilità in MongoDB. Un replica set in salute assicura ridondanza dei dati e capacità di failover. Esaminiamo tre indicatori chiave per garantire una replica efficace tra i server che costituiscono i membri del replica set.
Lo stato completo di un replica set può essere ottenuto eseguendo il comando rs.status() nella shell di MongoDB. Questo comando fornisce una vista completa dello stato attuale del replica set. L’output va controllato per confermare che tutti i membri siano in salute (ossia in stato PRIMARY o SECONDARY) e funzionino come previsto.
Dalla UI di Atlas puoi anche accedere a informazioni simili a quelle fornite dal comando sopra. Dalla pagina “Clusters”, clicca sul nome di uno specifico cluster. Questa azione ti porta alla scheda “Overview”, dove trovi una panoramica dei nodi. Se qualcosa non va davvero, dovrebbe comparire lì.
La durabilità in un cluster replicato dipende dalla replica dei dati sulla maggioranza dei nodi. Per questo, un cluster in salute deve replicare rapidamente. In caso contrario, le operazioni con write concern majority avranno latenze maggiori.
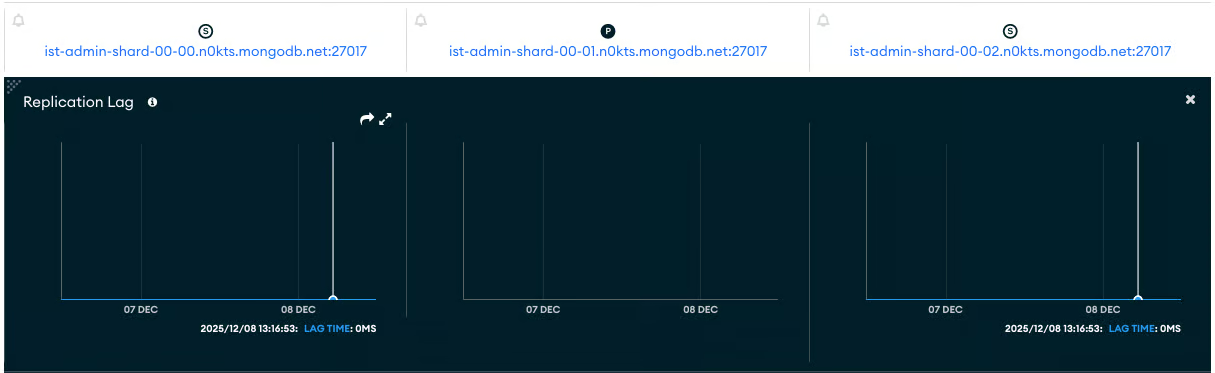
L’indicatore principale di questa caratteristica è il ritardo di replica (replication lag). Il replication lag è il ritardo tra un’operazione sul membro primario e la sua successiva applicazione su un membro secondario. Un lag basso e costante è un forte indicatore di buona salute. Al contrario, una replica lenta può essere il segno di connessioni tra i nodi configurate male.
Il modo più semplice per osservare il replica lag è guardare il grafico “Replication Lag” nella scheda “Cluster Metrics”. Ecco un esempio di questo grafico per un cluster in salute. Nota che questa metrica non si applica al nodo PRIMARY del cluster, quello al centro identificato da una “P”.
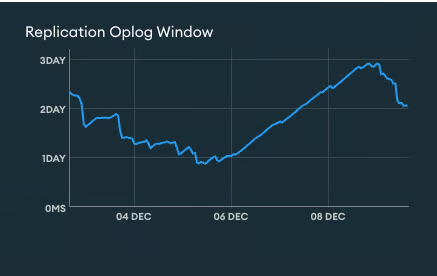
La replica è implementata tramite una collezione speciale chiamata “oplog”. L’oplog (operation log) è una capped collection che registra tutte le operazioni che modificano i dati. La “Replication Oplog Window" indica il tempo approssimativo disponibile nell’oplog di replica per la sorgente di sincronizzazione prima che le operazioni correnti inizino a essere sovrascritte. In altre parole, la Replication Oplog Window è la differenza temporale tra i timestamp più recenti e più vecchi nell’oplog. Un valore di finestra sufficiente è fondamentale per permettere ai secondari di recuperare dopo un’interruzione e prevenire la necessità di risincronizzazioni complete dei dati.
Se un secondario resta offline più a lungo della Replication Oplog Window disponibile, si dovrà risincronizzarlo da zero. In altre parole, vuoi un valore di Replication Oplog Window più lungo del tempo massimo in cui una replica può essere indisponibile. Nota che il valore della Replication Oplog Window è sensibile ai picchi di operazioni di scrittura.
Per ottenere una Replication Oplog Window maggiore, si può aumentare la dimensione della collezione oplog.
Le prestazioni influiscono direttamente sull’esperienza utente della tua applicazione e sui costi di esercizio del cluster. Un cluster in salute esegue in modo efficiente rispetto al proprio carico di lavoro.
Anche qui, vediamo gli aspetti critici delle prestazioni da monitorare.
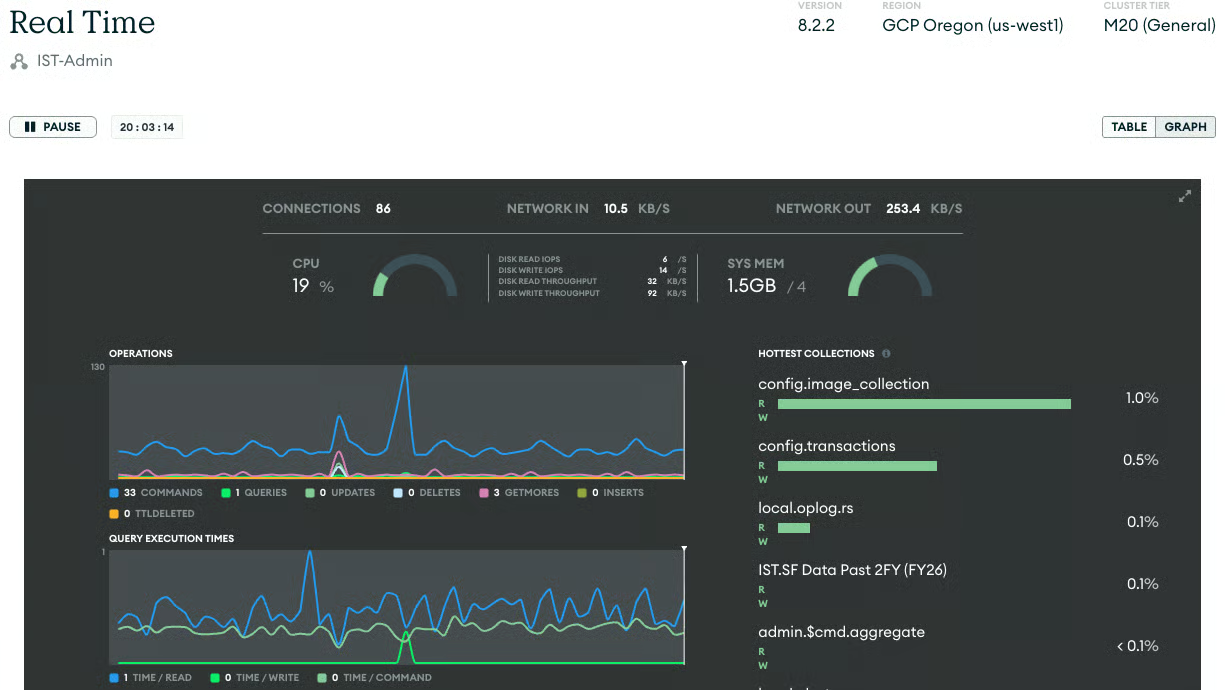
La prima cosa che mi piace controllare è se il cluster riceve il numero di operazioni previsto. Qui, “previsto” presuppone che tu conosca il valore. In caso contrario, osservare l’andamento delle query nell’ultima ora, giorno, settimana, ecc., può dare una buona idea di cosa aspettarsi e se si stanno verificando picchi o anomalie. Un picco settimanale regolare a un orario dato può richiedere uno scale-up preventivo del cluster.
Tieni d’occhio il tasso di operazioni (letture, scritture, comandi). Picchi o cali improvvisi e inattesi possono indicare un problema, come un malfunzionamento dell’applicazione, un collo di bottiglia delle risorse o uno schema di query inefficiente. Per aiutarti, imposta avvisi sul numero di operazioni, visibili nella sezione “Opcounters” delle metriche del cluster.
Informazioni in tempo reale sul tasso corrente di operazioni sono disponibili anche tramite la “Real Time Tab”.
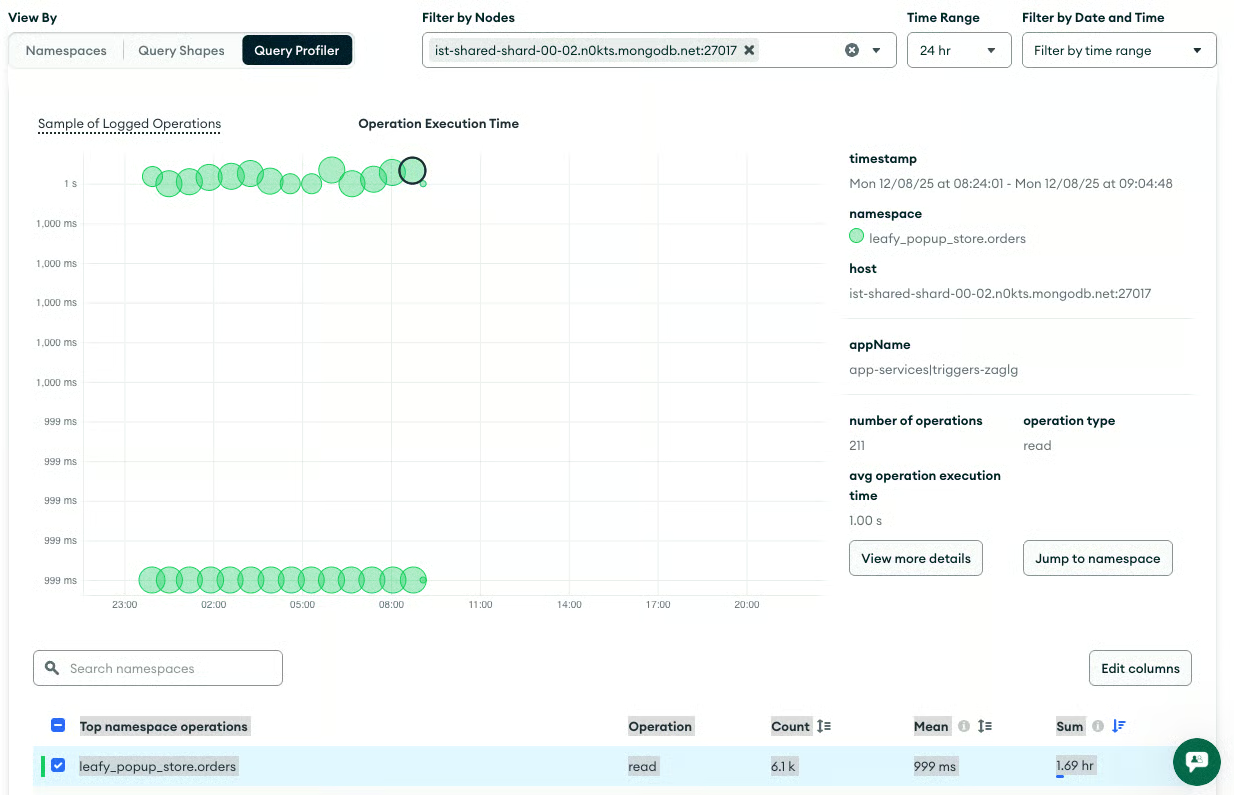
Le query che impiegano un tempo insolitamente lungo per essere eseguite sono note come query lente. Spesso indicano la necessità di indicizzazione o di ottimizzazione della query. Inoltre, è fondamentale monitorare le operazioni che richiedono ordinamenti in memoria, perché possono consumare molte risorse del server e degradare le prestazioni.
La scheda “Query Insights” ti permette di visualizzare le query, filtrarle per criteri e svolgere azioni aggiuntive. Usa questa pagina per identificare quali query andrebbero ottimizzate e quali potrebbero dover essere eseguite su un altro nodo o in un secondo momento.
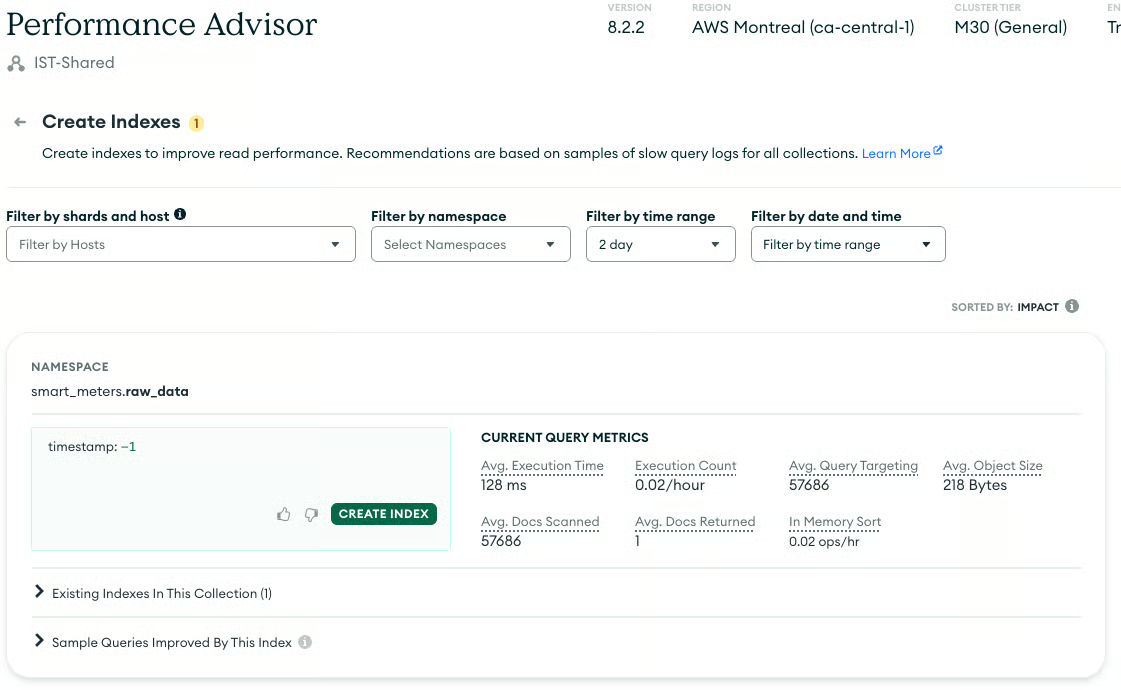
La causa più comune delle query lente in MongoDB è l’assenza di indici adeguati. In mancanza di un indice, MongoDB può eseguire una scansione della collezione (controllando ogni documento), ma è un’operazione molto inefficiente, soprattutto su collezioni grandi. Identificare e creare gli indici mancanti è essenziale per mantenere le prestazioni delle query.
La scheda “Performance Advisor” include diversi strumenti utili per aiutarti a ottimizzare le prestazioni. Quello sotto è la pagina “Create Indexes”.
La replica è una risorsa preziosa per mitigare la perdita di dati quando risorse, come il disco di un server, vengono perse o danneggiate. L’alta disponibilità nativa del tuo cluster coprirà la maggior parte dei guasti hardware. Tuttavia, una strategia di backup affidabile rimane l’estrema difesa contro la perdita di dati. Un cluster in salute ha un sistema di backup e ripristino testato e operativo.
Come per le altre sezioni, vediamo alcune considerazioni chiave per la tua strategia di backup.
Definisci il tuo Recovery Point Objective (RPO), cioè la quantità massima accettabile di perdita di dati, e il tuo Recovery Time Objective (RTO), cioè il tempo massimo consentito per ripristinare il servizio. Questi obiettivi determinano la frequenza e il metodo dei tuoi backup.
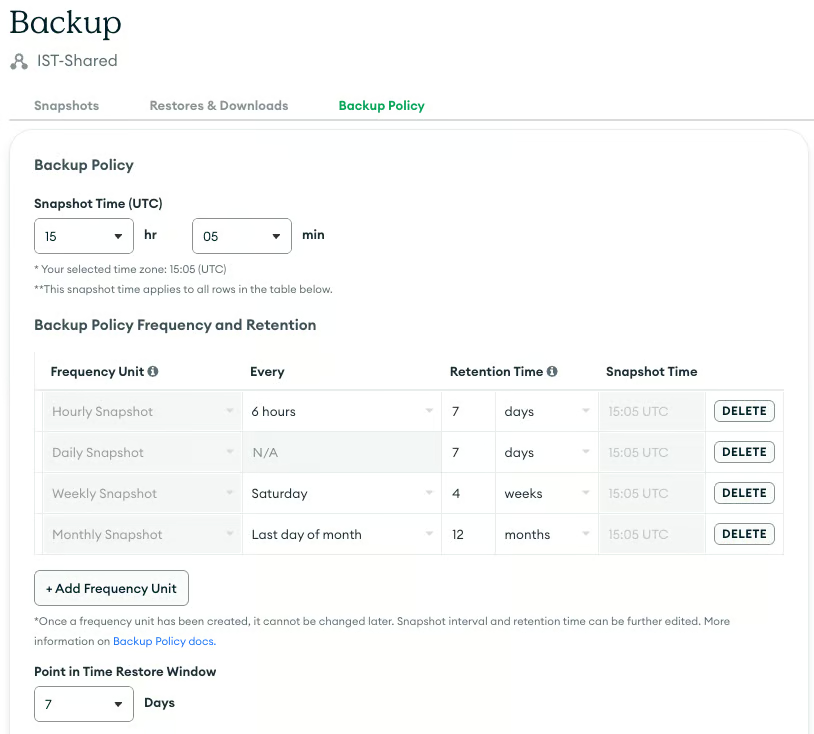
Esistono diversi strumenti per eseguire backup dei dati con MongoDB. Si parte da un semplice dump dei dati usando mongodump. Poi si passa all’uso degli strumenti di gestione di MongoDB per eseguire snapshot e conservare le singole operazioni (oplog) per ricreare un’immagine di qualsiasi punto nel tempo. MongoDB Atlas incorpora questi strumenti per i cluster ospitati, mentre MongoDB OpsManager svolge una funzione simile per i cluster on-premises.
Conservare molte versioni dei dati come backup di solito richiede più spazio del database originale stesso. Devi comprendere i costi per adattarli meglio alle tue esigenze. Questo esercizio produrrà una pianificazione che mostra il numero di snapshot da generare e la relativa frequenza.
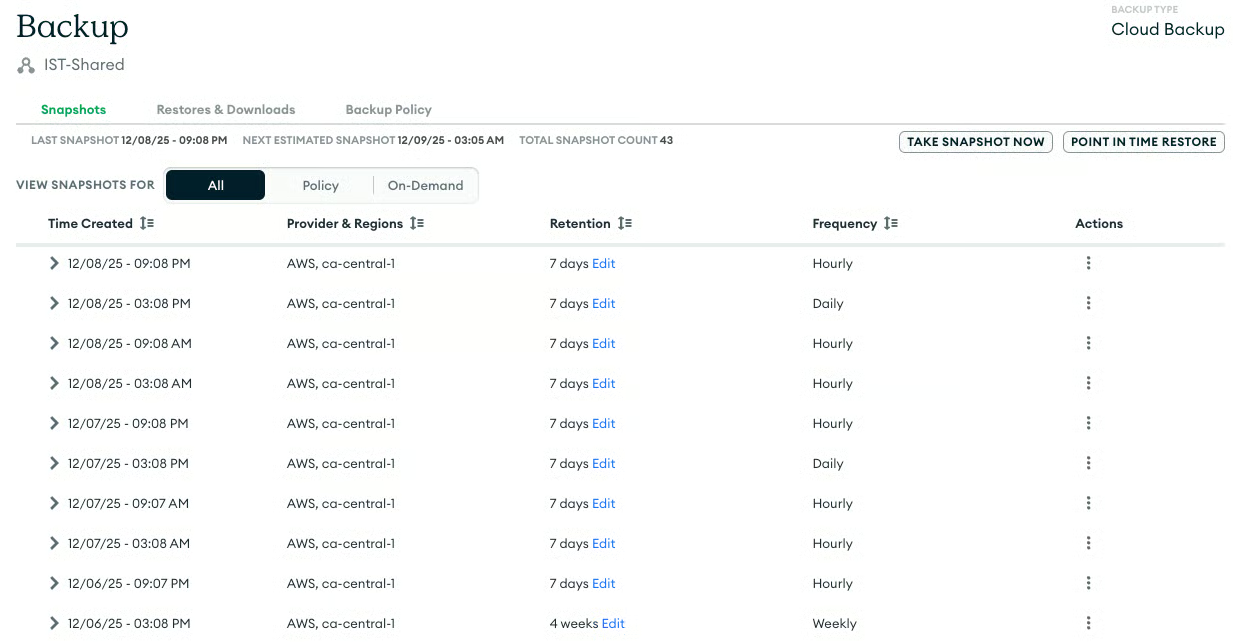
Se usi MongoDB Atlas, verifica che il processo di backup gestito sia in esecuzione correttamente, che catturi regolarmente gli snapshot e che le politiche di conservazione siano allineate al tuo RPO.
Esegui un ripristino: l’unico modo per confermare davvero che i tuoi backup siano validi è effettuare test di ripristino regolari. Questa azione convalida l’intera pipeline di backup e ripristino, assicurando che i dati siano recuperabili in caso di emergenza.
Un cluster MongoDB in salute è caratterizzato da:
Un monitoraggio proattivo in queste tre aree, l’analisi delle prestazioni delle query e i test di ripristino garantiranno stabilità e longevità alla tua distribuzione MongoDB.
Impara MongoDB con DataCamp
Corso
Corso
Corso
blog
Abid Ali Awan
15 min
blog
Tim Lu
12 min
blog
Abid Ali Awan
10 min