
Kurs
Python ile MongoDB'ye Giriş
3 sa
24.1K
Sağlıklı bir MongoDB veritabanını korumak, uygulama kararlılığı, en iyi performans ve veri bütünlüğü için kritik öneme sahiptir. "Sağlıklı" bir küme, okumaları ve yazmaları güvenilir şekilde sunan, veriyi kayba karşı koruyan ve beklenen operasyonel parametreler dahilinde çalışan kümeyi ifade eder. Düzenli kontroller ve proaktif izleme, hizmetinizi etkilemeden önce potansiyel sorunları belirlemek ve gidermek için hayati önem taşır.
MongoDB kümenizin sağlığını üç temel alanda kategorize edebiliriz:
Bu alanları düzenli olarak değerlendirerek veri platformunuzun sağlam ve güvenilir olmasını sağlarsınız. Ayrıca MongoDB Atlas ve MongoDB Ops Manager gibi modern yönetim araçları, uyarılar ve önerilerle entegre izleme sunarak olası sorunların önüne geçmenize yardımcı olur. Uyarıları yapılandırmak işlerin kontrolünüzde kalmasına katkı sağlar. Talimatları ve örnekleri resmi MongoDB belgelerinde uyarıların nasıl ayarlanacağı bölümünde bulabilirsiniz.
Bu alanları tek tek ele alalım.
MongoDB'de yüksek erişilebilirliğin belkemiği çoğaltmadır. Sağlıklı bir çoğaltma kümesi, veri yedekliliğini ve otomatik devralma (failover) yeteneğini sağlar. Çoğaltma kümesi üyelerini oluşturan sunucular arasında etkin çoğaltmayı sağlamak için üç temel göstergeyi inceleyelim.
Bir çoğaltma kümesinin tam durumunu MongoDB kabuğunda rs.status() komutunu çalıştırarak elde edebilirsiniz. Bu komut, çoğaltma kümesinin mevcut durumuna kapsamlı bir bakış sunar. Çıktı, tüm üyelerin sağlıklı olduğunu (yani PRIMARY veya SECONDARY durumunda) ve beklendiği gibi çalıştığını doğrulamak için kontrol edilmelidir.
Atlas kullanıcı arayüzünden de yukarıdaki komutun sunduğuna benzer bilgilere erişebilirsiniz. "Clusters" sayfasından belirli bir küme adına tıklayın. Bu işlem sizi düğümlerin genel görünümünü alacağınız "Overview" sekmesine götürür. Ciddi bir sorun varsa burada görünmelidir.
Çoğaltılan bir kümede dayanıklılık, verinin düğümlerin çoğunluğuna çoğaltılmasına bağlıdır. Bu nedenle sağlıklı bir küme veriyi hızlı çoğaltmalıdır. Aksi takdirde majority write concern ile yapılan işlemlerde gecikmeler artar.
Bu özelliğin öncü göstergesi çoğaltma gecikmesidir. Çoğaltma gecikmesi, birincil üyedeki bir işlemin ikincil üyede uygulanması arasındaki gecikmeye karşılık gelir. Düşük ve tutarlı çoğaltma gecikmesi, sağlığın güçlü bir göstergesidir. Öte yandan yavaş çoğaltma, düğümler arasındaki bağlantıların kötü yapılandırıldığına işaret edebilir.
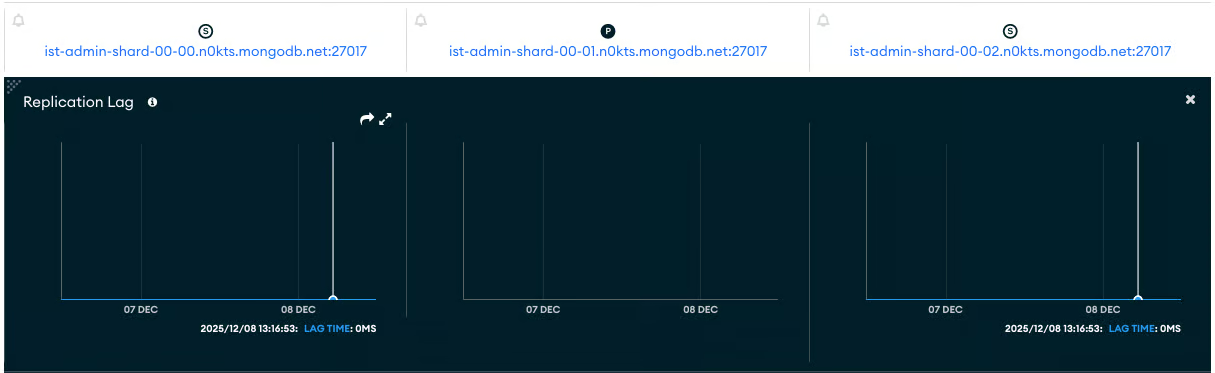
Çoğaltma gecikmesini gözlemlemenin en kolay yolu, "Cluster Metrics" sekmesi altındaki "Replication Lag" grafiğine bakmaktır. İşte sağlıklı bir küme için bu grafiğe bir örnek. Bu ölçütün, ortadaki ve "P" ile gösterilen PRIMARY düğüm için geçerli olmadığını unutmayın.
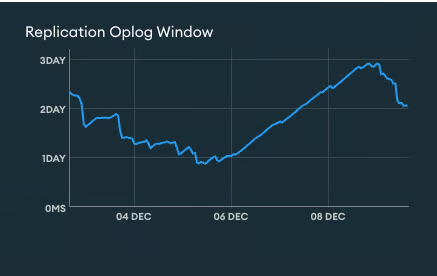
Çoğaltma, "oplog" adı verilen özel bir koleksiyon aracılığıyla uygulanır. Oplog (işlem günlüğü), tüm veri değişiklik işlemlerini kaydeden sınırlı (capped) bir koleksiyondur. "Replication Oplog Window", senkronizasyon kaynağı için, güncel işlemler üzerine yazılmaya başlanmadan önce çoğaltma oplog'unda mevcut tahmini süreyi ifade eder. Başka bir deyişle Replication Oplog Window, oplog içindeki en yeni ve en eski zaman damgaları arasındaki zaman farkıdır. Yeterli bir oplog penceresi değeri, ikincil düğümlerin bir kesinti sonrasında yetişebilmesi ve tam veri yeniden eşitlemelerinin (resync) önlenmesi için kritiktir.
Bir ikincil düğüm, mevcut Replication Oplog Window süresinden daha uzun süre çevrimdışı kalırsa, bu ikincili baştan yeniden eşitlemek gerekir. Yani, çoğaltma penceresi değerinin, bir replikayı en fazla ne kadar süreyle kullanılamaz olabileceğinden daha uzun olmasını istersiniz. Replication Oplog Window değerinin yazma işlemlerindeki ani patlamalara duyarlı olduğunu unutmayın.
Daha geniş bir Replication Oplog Window elde etmek için oplog koleksiyonunun boyutunu artırabilirsiniz.
Performans, uygulamanızın kullanıcı deneyimini ve kümenin işletim maliyetlerini doğrudan etkiler. Sağlıklı bir küme, iş yüküne göre verimli şekilde çalışır.
Burada da izlenmesi gereken kritik performans yönlerine bakalım.
Kontrol etmeyi sevdiğim ilk şey, kümenin beklenen sayıda işlem alıp almadığıdır. Burada "beklenen", değeri bildiğinizi varsayar. Bilmiyorsanız, son bir saat, gün, hafta vb. boyunca sorgu eğilimini incelemek, neyin beklendiğine ve herhangi bir zirve veya anomali olup olmadığına dair iyi bir anlayış sağlayabilir. Belirli bir zamanda düzenli haftalık bir zirve, kümeyi önceden ölçeklendirmeyi gerektirebilir.
İşlem hızını (okumalar, yazmalar, komutlar) yakından izleyin. Ani ve beklenmedik artış veya düşüşler, uygulama sorunu, kaynak darboğazı veya verimsiz sorgu modeli gibi bir sorunu işaret edebilir. Yardımcı olması için, küme metriklerindeki "Opcounters" bölümünde görülebilen işlem sayıları üzerine uyarılar ayarlayın.
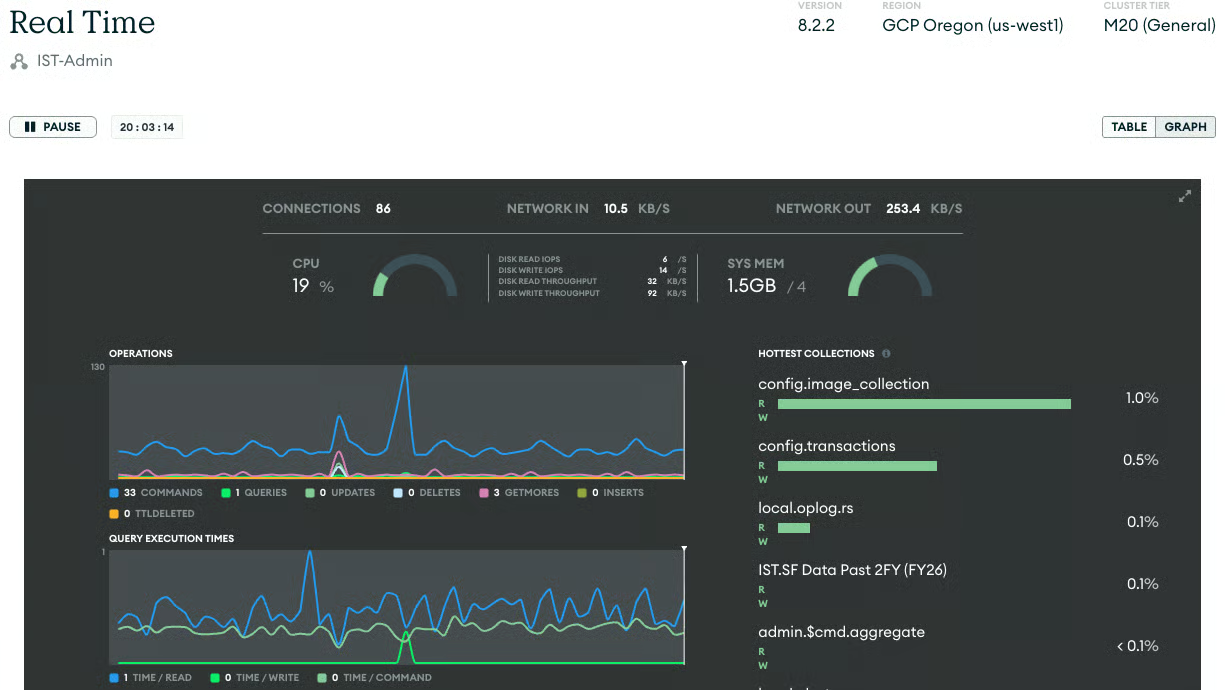
Ayrıca, anlık işlem hızına ilişkin gerçek zamanlı bilgiler "Real Time Tab" üzerinden bulunabilir.
Olağandışı derecede uzun süren sorgular yavaş sorgular olarak bilinir. Bunlar genellikle indeksleme veya sorgu optimizasyonu ihtiyacına işaret eder. Ayrıca, bellek içi sıralama gerektiren işlemleri izlemek de önemlidir; zira bu, önemli sunucu kaynakları tüketir ve performansı düşürür.
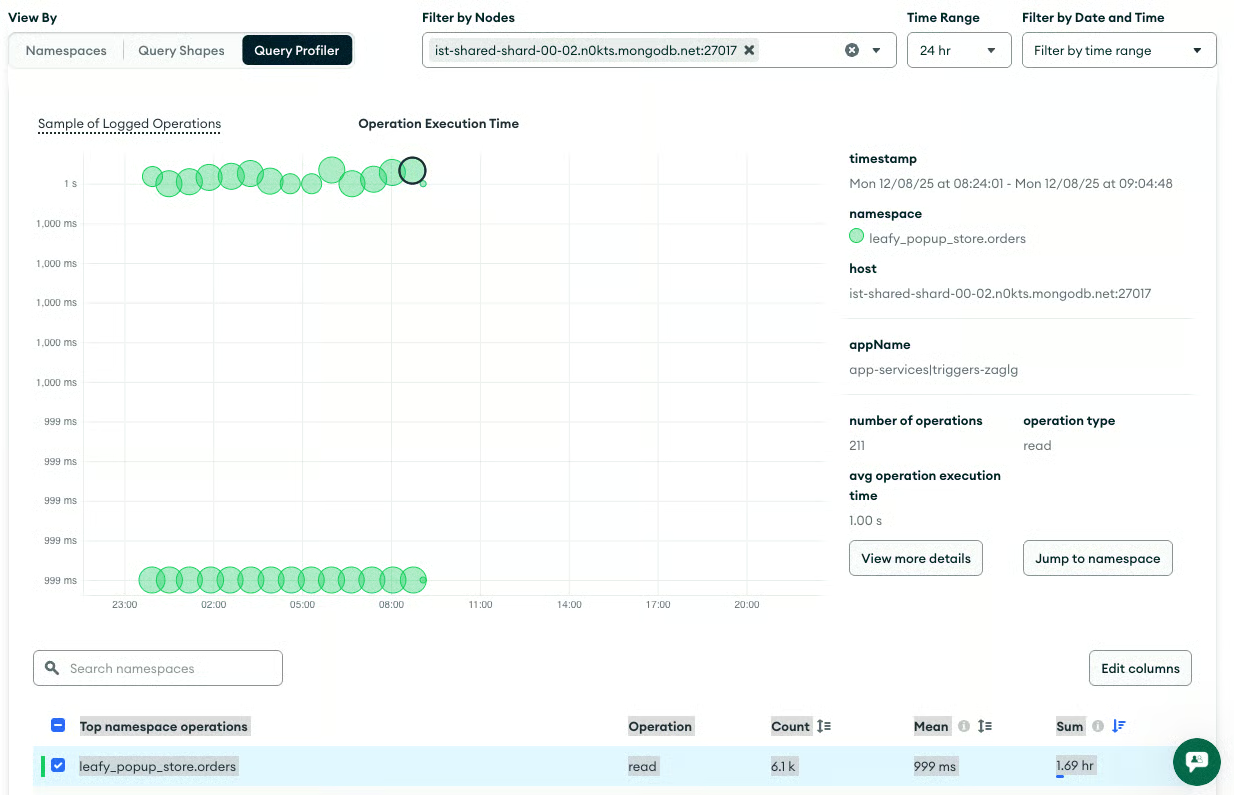
"Query Insights" sekmesi, sorguları görüntülemenize, ölçütlere göre filtrelemenize ve ek işlemler yapmanıza olanak tanır. Bu sayfayı, hangi sorguların optimize edilmesi gerektiğini ve hangilerinin başka bir düğümde veya daha sonra çalıştırılması gerekebileceğini belirlemek için kullanmak istersiniz.
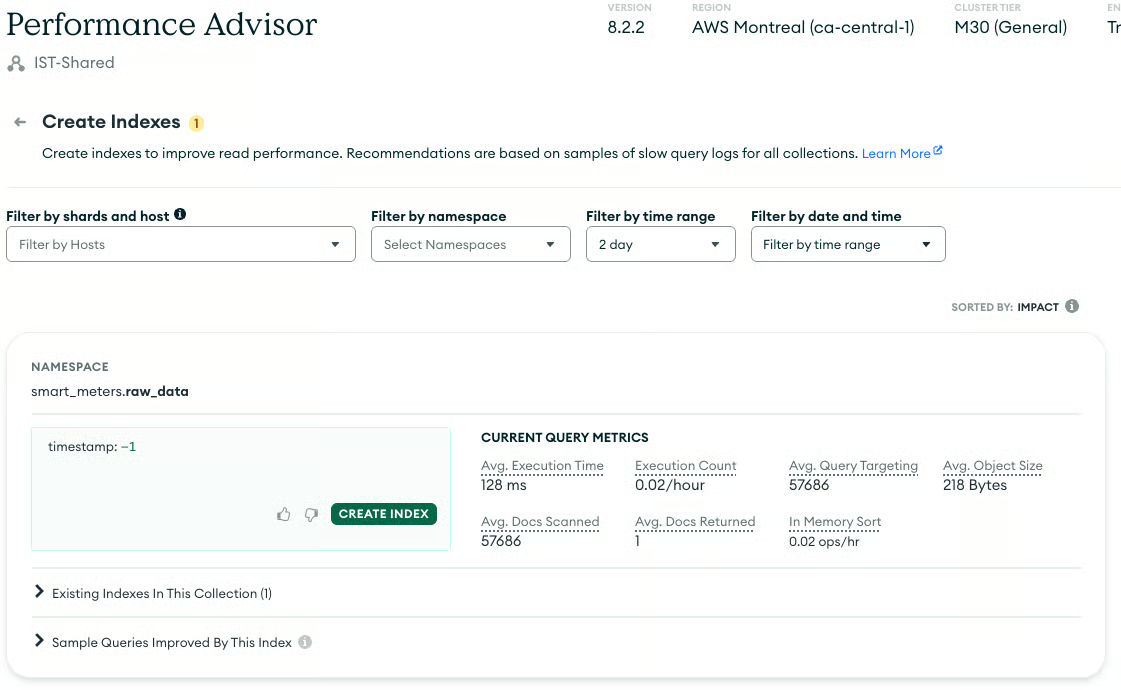
MongoDB'de yavaş sorguların en yaygın nedeni, uygun indekslerin eksikliğidir. Bir indeks eksik olduğunda MongoDB bir koleksiyon taraması (koleksiyondaki her belgenin tek tek kontrol edilmesi) yapabilir; ancak bu, özellikle büyük koleksiyonlarda son derece verimsizdir. Eksik indeksleri belirlemek ve oluşturmak, sorgu performansını korumak için esastır.
"Performance Advisor" sekmesi, performansı optimize etmenize yardımcı olacak çeşitli değerli araçlar içerir. Aşağıdaki sayfa "Create Indexes" sayfasıdır.
Çoğaltma, bir sunucunun diski gibi kaynaklar kaybolduğunda veya bozulduğunda veri kaybını azaltmak için değerli bir varlıktır. Kümenizin yerleşik yüksek erişilebilirliği donanım arızalarının çoğunu karşılar. Ancak güvenilir bir yedekleme stratejisi, veri kaybına karşı nihai güvence olmaya devam eder. Sağlıklı bir kümede test edilmiş, çalışır bir yedekleme ve kurtarma sistemi bulunur.
Diğer bölümlerde olduğu gibi, yedekleme stratejiniz için bazı kilit hususları inceleyelim.
Kabul edilebilir en yüksek veri kaybını ifade eden Kurtarma Noktası Hedefinizi (RPO) ve hizmeti geri yüklemek için izin verilen en uzun süre olan Kurtarma Süresi Hedefinizi (RTO) tanımlayın. Bu hedefler, yedeklemelerinizin gerekli sıklığını ve yöntemini belirler.
MongoDB ile verileri yedeklemek için farklı araçlar vardır. En basiti, verilerinizin mongodump ile basit bir dökümünü almaktır. Sonrasında, anlık görüntüler (snapshot) almak ve tek tek işlemleri (oplog) saklayarak herhangi bir zaman noktasının görüntüsünü yeniden oluşturmak için MongoDB yönetim araçlarından yararlanılır. MongoDB Atlas, barındırılan kümeler için bu araçları içerirken, MongoDB OpsManager şirket içi kümeleriniz için benzer bir işlev görür.
Yedek olarak verinin birçok sürümünü tutmak, genellikle orijinal veritabanının kendisinden daha fazla alan kaplar. İhtiyaçlarınıza daha iyi uyması için maliyetleri anlamanız gerekir. Bu çalışma, üretilecek anlık görüntü sayısını ve bunların karşılık gelen sıklığını gösteren bir zamanlama oluşturacaktır.
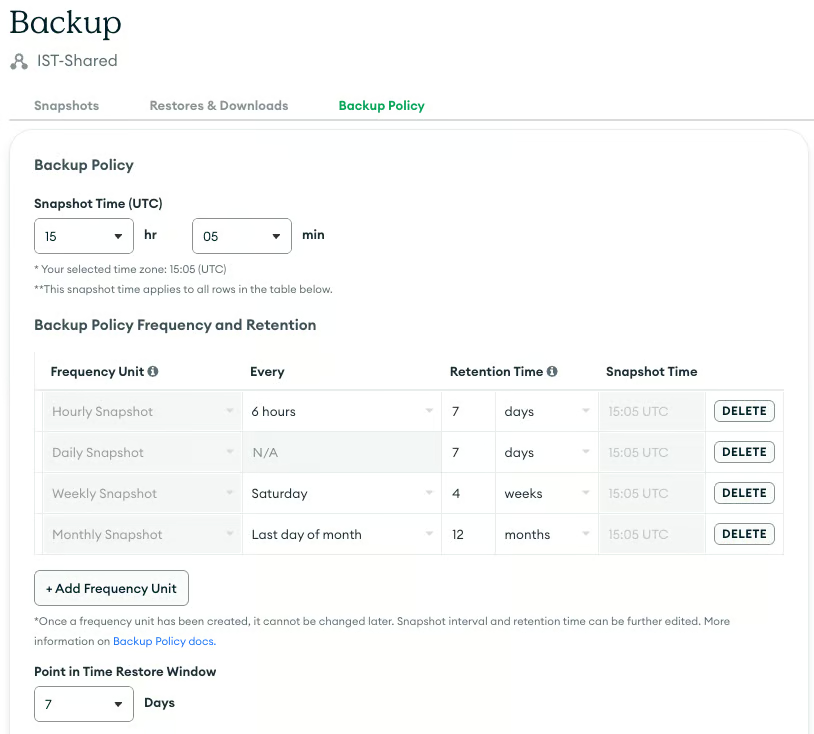
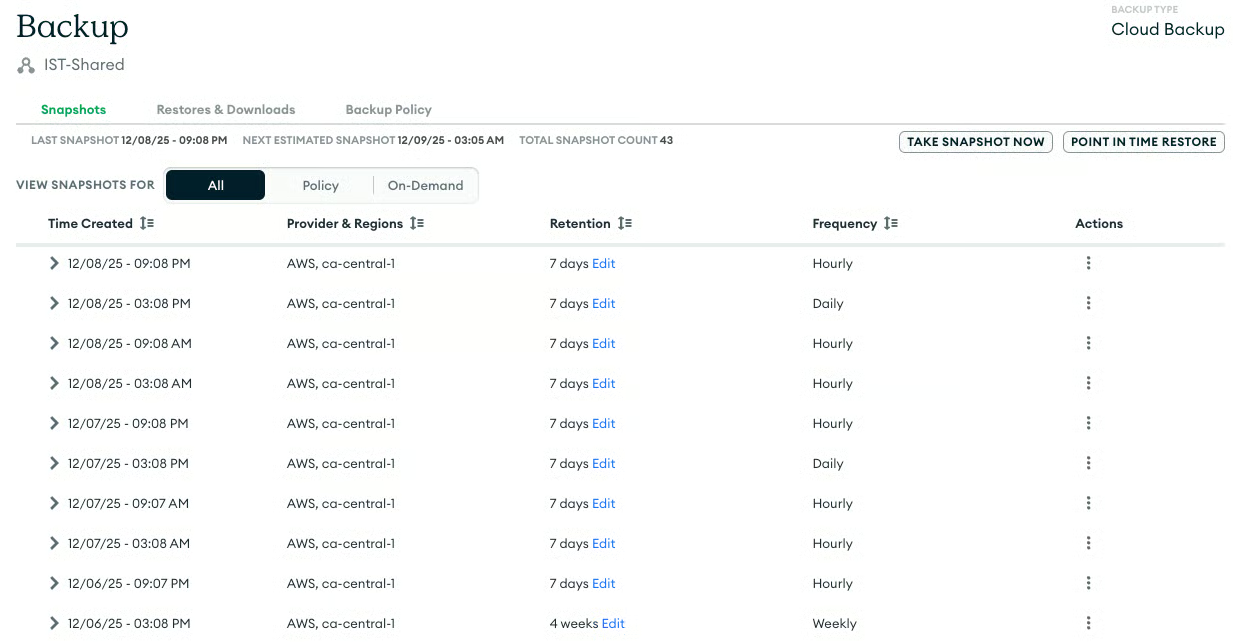
MongoDB Atlas kullanıyorsanız, yönetilen yedekleme sürecinin başarıyla çalıştığını, düzenli olarak anlık görüntüler aldığını ve saklama ilkelerinin RPO'nuzla uyumlu olduğunu doğrulayın.
Geri yükleme gerçekleştirin: Yedeklerinizin geçerli olduğunu gerçekten doğrulamanın tek yolu, düzenli bir geri yükleme testi yapmaktır. Bu işlem, acil bir durumda verinin kurtarılabilir olmasını sağlayarak tüm yedekleme ve geri yükleme hattını doğrular.
Sağlıklı bir MongoDB kümesi şu özelliklerle tanımlanır:
Bu üç alan genelinde proaktif izleme, sorgu performansının analiz edilmesi ve geri yükleme işlemlerinin test edilmesi, MongoDB dağıtımınızın kararlılığını ve uzun ömürlülüğünü sağlayacaktır.
DataCamp ile MongoDB öğrenin
Kurs
Kurs
Kurs
blog
Abid Ali Awan
14 dk.
blog
Dario Radečić
15 dk.
Eğitim
Kurtis Pykes
Eğitim
Adel Nehme