
Last chance! 50% off DataCamp Premium
Sale ends in
Buy Now

Oefen en volg je voortgang.
Ga verder met GoogleDoor verder te gaan, accepteer je ons Gebruiksvoorwaarden, onze Privacybeleid en dat je gegevens in de VS worden opgeslagen.Houd deze cheatsheet bij de hand
PDF downloadenThe Pandas cheat sheet will guide you through some more advanced indexing techniques, DataFrame iteration, handling missing values or duplicate data, grouping and combining data, data functionality, and data visualization.
In short, everything that you need to complete your data manipulation with Python!
Don't miss out on our other cheat sheets for data science that cover Matplotlib, SciPy, Numpy, and the Python basics.
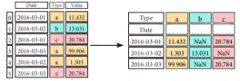
>>> df3= df2.pivot(index='Date', #Spread rows into columns columns='Type', values='Value')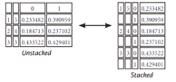
>>>stacked= df5.stack() #Pivot a level of column labels>>> stacked.unstack() #Pivot a level of index labels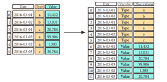
>>> pd.melt(df2, #Gather columns into rows id_vars=[''Date''], value_vars=[''Type'', ''Value''], value name=''Observations'')>>> df.iteritems() #{Column-index, Series) pairs>>> df.iterrows() #{Row-index, Series) pairs>>> df.dropna() #Drop NaN values>>> df3.fillna(df3.mean()) #Fill NaN values with a predetermined value>>> df2.replace("a", "f") #Replace values with othersSelecting
>>> df3.loc[:,(df3>1).any()] #Select cols with any vols >1>>> df3.loc[:,(df3>1).all()] #Select cols with vols> 1>>> df3.loc[:,df3.isnull().any()] #Select cols with NaN>>> df3.loc[:,df3.notnull().all()] #Select cols without NaNIndexing With isin ()
>>> df[(df.Country.isin(df2.Type))] #Find some elements>>> df3.filter(iterns="a","b"]) #Filter on values>>> df.select(lambda x: not x%5) #Select specific elementsWhere
>>> s.where(s > 0) #Subset the dataQuery
>>> df6.query('second > first') #Query DataFrame>>> df.set_index('Country') #Set the index>>> df4 = df.reset_index() #Reset the index>>> df = df.rename(index=str, #Rename DataFrame columns={"Country":"cntry", "Capital":"cptl", "Population":"ppltn"})>>> s2 = s. reindex (['a','c','d','e',' b'])Forward Filling
>>> df.reindex(range(4), method='ffill')| Country | Capital | Population |
| 0 Belgium | Brussels | 11190846 |
| 1 India | New Dehli | 1303171035 |
| 2 Brazil | Brasilia | 207847528 |
| 3 Brazil | Brasilia | 207847528 |
Backward Filling
>>> s3 = s.reindex(range(5), method='bfill')| 0 | 3 |
| 1 | 3 |
| 2 | 3 |
| 3 | 3 |
| 4 | 3 |
>>>arrays= [np.array([1,2,3]), np.array([5,4,3])]>>> df5 = pd.DataFrame(np.random.rand(3, 2), index=arrays)>>>tuples= list(zip(*arrays))>>>index= pd.Multilndex.from_tuples(tuples, names= ['first','second'])>>> df6 = pd.DataFrame(np.random.rand(3, 2), index=index)>>> df2.set_index(["Date", "Type"])>>> s3.unique() #Return unique values>>> df2.duplicated('Type') #Check duplicates>>> df2.drop_duplicates('Type', keep='last') #Drop duplicates>>> df.index.duplicated() #Check index duplicatesAggregation
>>> df2.groupby(by=['Date','Type']).mean()>>> df4.groupby(level=0).sum()>>> df4.groupby(level=0).agg({'a':lambda x:sum(x)/len (x), 'b': np.sum})Transformation
>>> customSum = lambda x: (x+x%2)>>> df4.groupby(level=0).transform(customSum)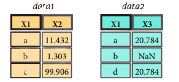
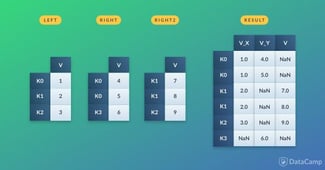
>>> pd.merge(data1, data2, how=' left', on='X1')
>>> pd.merge(data1, data2, how='right', on='X1')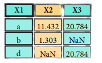
>>> pd.merge(data1, data2, how='inner', on='X1')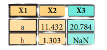
>>> pd.merge(data1, data2, how='outer', on='X1')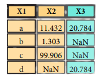
>>> data1.join(data2, how='right')Vertical
>>> s.append(s2)Horizontal/Vertical
>>> pd.concat([s,s2],axis=1, keys=['One','Two'])>>> pd.concat([datal, data2], axis=1, join='inner')>>> df2['Date']= pd.to_datetime(df2['Date'])>>> df2['Date']= pd.date_range('2000-1-1', periods=6, freq='M')>>>dates= [datetime(2012,5,1), datetime(2012,5,2)]>>>index= pd.Datetimelndex(dates)>>>index= pd.date_range(datetime(2012,2,1), end, freq='BM')>>> import matplotlib.pyplot as plt>>> s.plot()>>> plt.show()
>>> df2.plot()>>> plt.show()
kort overzicht
 Karlijn Willems• 4 min

kort overzicht
Karlijn Willems• 4 min
kort overzicht
Karlijn Willems• 6 min

By now, you'll already know the Pandas library is one of the most preferred tools for data manipulation and analysis, and you'll have explored the fast, flexible, and expressive Pandas data structures, maybe with the help of DataCamp's Pandas Basics cheat sheet.
Yet, there is still much functionality that is built into this package to explore, especially when you get hands-on with the data: you'll need to reshape or rearrange your data, iterate over DataFrames, visualize your data, and much more. And this might be even more difficult than "just" mastering the basics.
That's why today's post introduces a new, more advanced Pandas cheat sheet.
It's a quick guide through the functionalities that Pandas can offer you when you get into more advanced data wrangling with Python.
(Do you want to learn more? Start our Data Manipulation with pandas course for free now or try out our Pandas DataFrame tutorial! )