HomeCheat sheetsPython

Pandas Cheat Sheet for Data Science in Python

A quick guide to the basics of the Python data analysis library Pandas, including code samples.
May 2021  · 4 min read

The Pandas library is one of the most preferred tools for data scientists to do data manipulation and analysis, next to matplotlib for data visualization and NumPy, the fundamental library for scientific computing in Python on which Pandas was built. 

The fast, flexible, and expressive Pandas data structures are designed to make real-world data analysis significantly easier, but this might not be immediately the case for those who are just getting started with it. Exactly because there is so much functionality built into this package that the options are overwhelming.

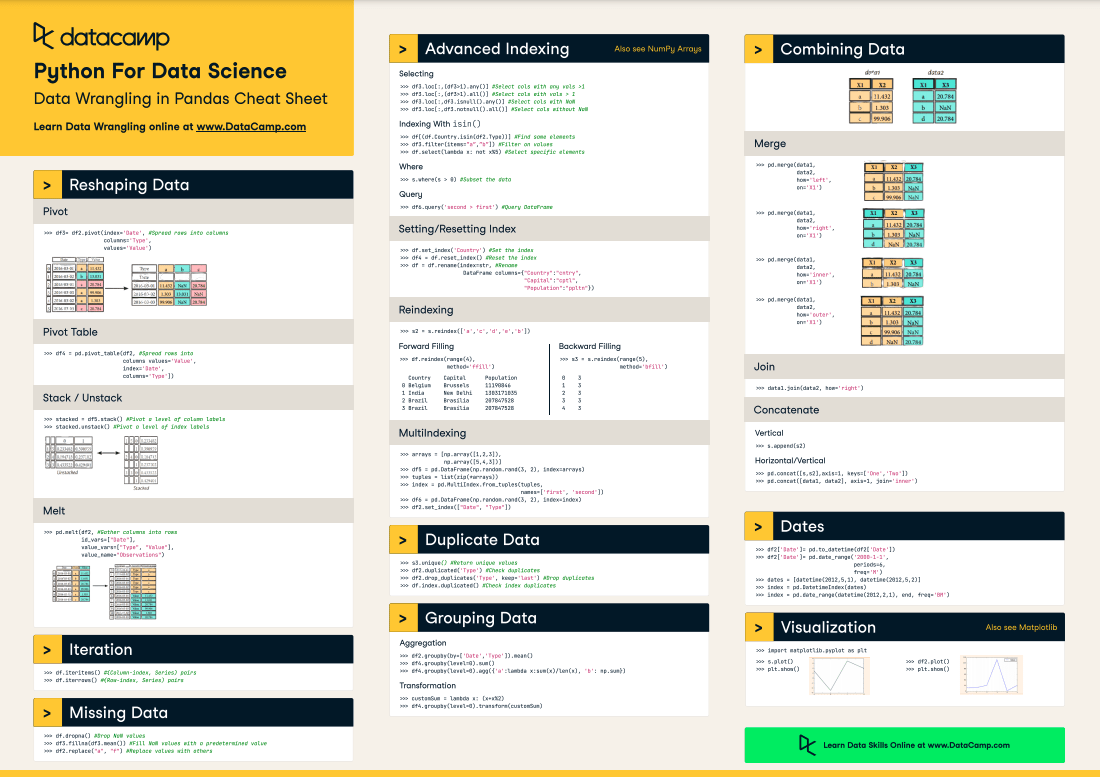
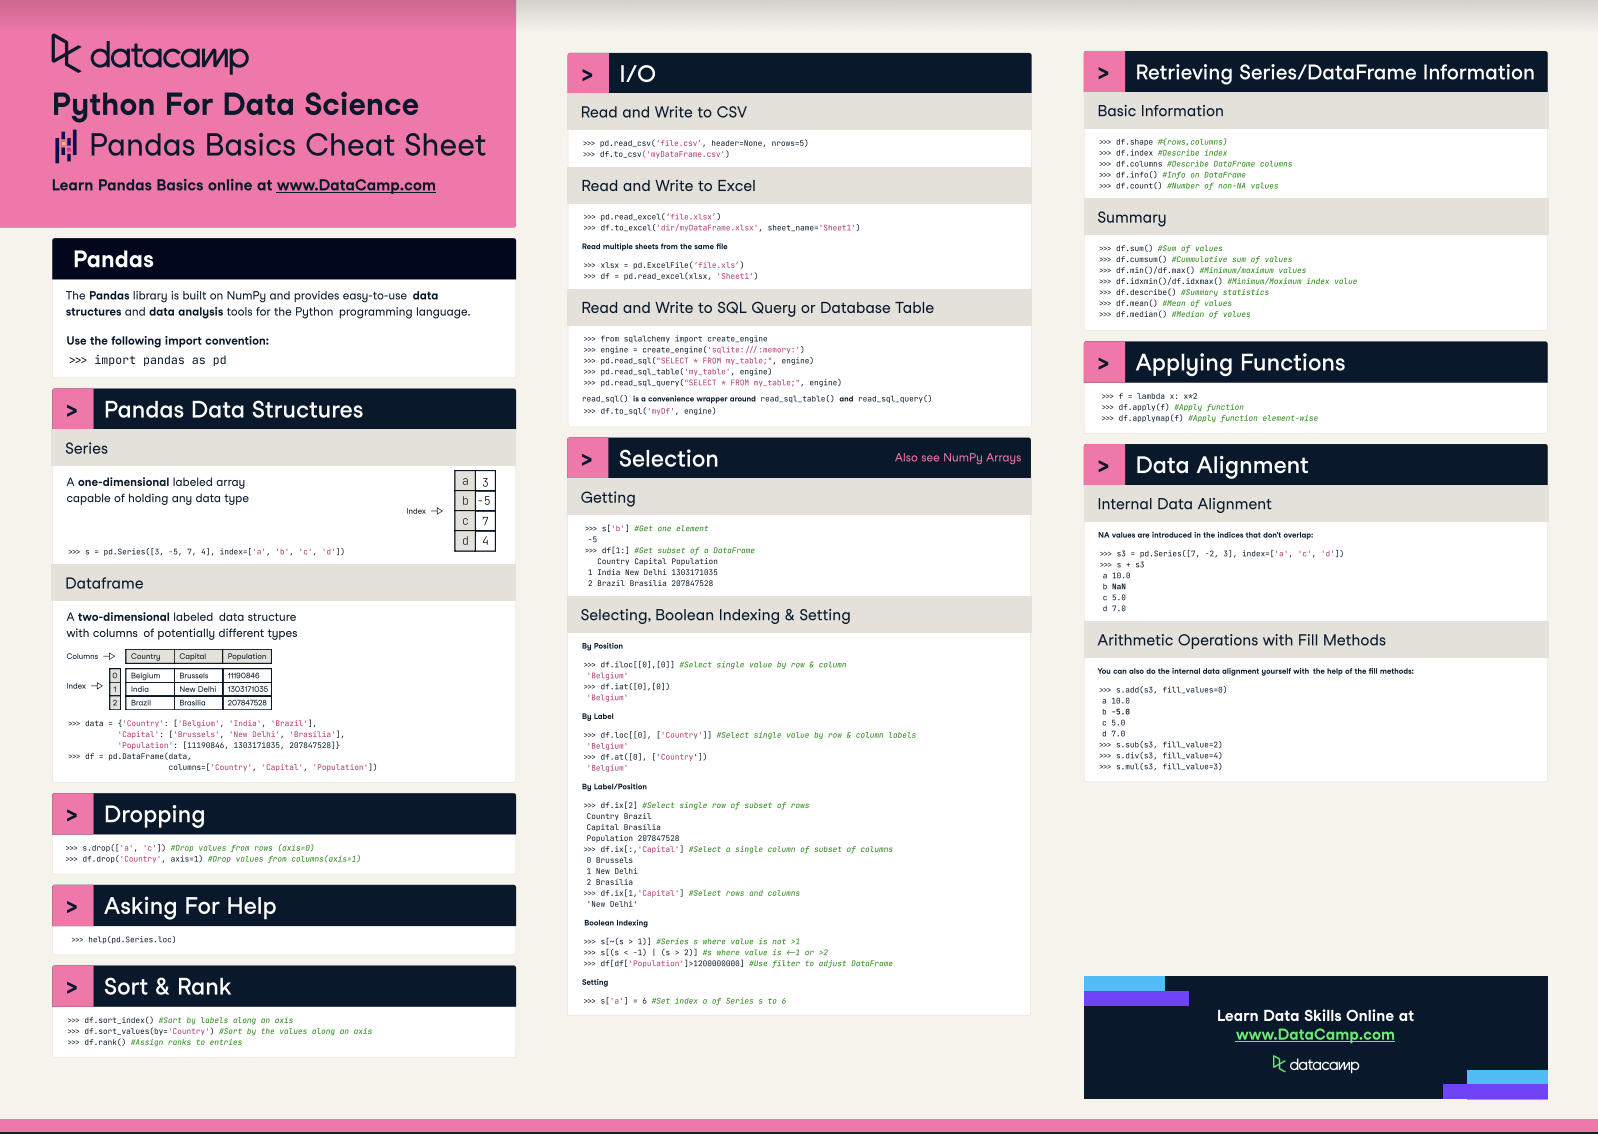
That's where this Pandas cheat sheet might come in handy. 

It's a quick guide through the basics of Pandas that you will need to get started on wrangling your data with Python. 

As such, you can use it as a handy reference if you are just beginning their data science journey with Pandas or, for those of you who already haven't started yet, you can just use it as a guide to make it easier to learn about and use it. 

Pandas Cheat Sheet for Data Science in Python

Have this cheat sheet at your fingertips

Download PDF

The Pandas cheat sheet will guide you through the basics of the Pandas library, going from the data structures to I/O, selection, dropping indices or columns, sorting and ranking, retrieving basic information of the data structures you're working with to applying functions and data alignment.

In short, everything that you need to kickstart your data science learning with Python!

Do you want to learn more? Start the Intermediate Python For Data Science course for free now or try out our Pandas DataFrame tutorial

Also, don't miss out on our Pandas Data Wrangling cheat sheet or our other data science cheat sheets

(Click above to download a printable version or read the online version below.)

Python For Data Science Cheat Sheet: Pandas Basics

Use the following import convention:

import pandas as pd

Pandas Data Structures

Series

A one-dimensional labeled array capable of holding any data type

s = pd.Series([3, -5, 7, 4],  index=['a',  'b',  'c',  'd'])
A 3

DataFrame

A two-dimensional labeled data structure with columns of potentially different types

data = {'Country': ['Belgium',  'India',  'Brazil'],

'Capital': ['Brussels',  'New Delhi',  'Brasilia'],

'Population': [11190846, 1303171035, 207847528]} 

df = pd.DataFrame(data,columns=['Country',  'Capital',  'Population'])

  Country Capital Population
1 Belgium Brussels 11190846
2 India New Delhi 1303171035
3 Brazil Brasilia 207847528

Please note that the first column 1,2,3 is the index and Country,Capital,Population are the Columns.

Asking For Help

help(pd.Series.loc)

I/O

Read and Write to CSV

pd.read_csv('file.csv', header=None, nrows=5)
df.to_csv('myDataFrame.csv')

Read multiple sheets from the same file

xlsx = pd.ExcelFile('file.xls')
df = pd.read_excel(xlsx,  'Sheet1')

Read and Write to Excel

pd.read_excel('file.xlsx')
df.to_excel('dir/myDataFrame.xlsx',  sheet_name='Sheet1')

Read and Write to SQL Query or Database Table

(read_sql()is a convenience wrapper around read_sql_table() and read_sql_query())

from sqlalchemy import create_engine
engine = create_engine('sqlite:///:memory:')
pd.read_sql(SELECT * FROM my_table;, engine)
pd.read_sql_table('my_table', engine)
pd.read_sql_query(SELECT * FROM my_table;', engine)
df.to_sql('myDf', engine)

Selection

Getting

Get one element

s['b']
-5

Get subset of a DataFrame

df[1:]
Country     Capital   Population
1  India    New Delhi 1303171035
2  Brazil   Brasilia  207847528

Selecting', Boolean Indexing and Setting

By Position

Select single value by row and and column

df.iloc([0], [0])
'Belgium'
df.iat([0], [0])
'Belgium'

By Label

Select single value by row and column labels

df.loc([0],  ['Country'])
'Belgium'
df.at([0],  ['Country'])
'Belgium'

By Label/Position

Select single row of subset of rows

df.ix[2]
Country      Brazil
Capital    Brasilia
Population  207847528

Select a single column of subset of columns

df.ix[:, 'Capital']
0     Brussels
1    New Delhi
2     Brasilia

Select rows and columns

df.ix[1, 'Capital']
'New Delhi'

Boolean Indexing

Series s where value is not >1

s[~(s > 1)]

s where value is <-1 or >2

s[(s < -1) | (s > 2)]

Use filter to adjust DataFrame

df[df['Population']>1200000000]

Setting

Set index a of Series s to 6

s['a'] = 6

Dropping

Drop values from rows (axis=0)

s.drop(['a',  'c'])

Drop values from columns(axis=1)

df.drop('Country', axis=1) 

Sort and Rank

Sort by labels along an axis

df.sort_index()

Sort by the values along an axis

df.sort_values(by='Country') 

Assign ranks to entries

df.rank()

Retrieving Series/DataFrame Information

Basic Information

(rows, columns)

df.shape

Describe index

df.index

Describe DataFrame columns

df.columns

Info on DataFrame

df.info()

Number of non-NA values

df.count()

Summary

Sum of values

df.sum()

Cumulative sum of values

df.cumsum()

Minimum/maximum values

df.min()/df.max()

Minimum/Maximum index value

df.idxmin()/df.idxmax() 

Summary statistics

df.describe()

Mean of values

df.mean()

Median of values

df.median()

Applying Functions

f = lambda x: x*2

Apply function

df.apply(f)

Apply function element-wise

df.applynap(f) 

Internal Data Alignment

NA values are introduced in the indices that don't overlap:

s3 = pd.Series([7, -2, 3],  index=['a',  'c',  'd'])
s + s3
a     10.0
b     NaN
c     5.0
d     7.0

Arithmetic Operations with Fill Methods

You can also do the internal data alignment yourself with the help of the fill methods:

s.add(s3, fill_value=0)
a    10.0
b    -5.0
c    5.0
d    7.0
s.sub(s3, fill_value=2)
s.div(s3, fill_value=4)
s.mul(s3, fill_value=3)

Learn more about pandas

Joining Data with pandas

Reshaping Data with pandas

Data Manipulation with pandas

Writing Efficient Code with pandas

Related

DataCamp Portfolio Challenge: Win $500 Publishing Your Best Work

Win up to $500 by building a free data portfolio with DataCamp Portfolio.
DataCamp Team's photo

DataCamp Team

5 min

10 Essential Python Skills All Data Scientists Should Master

All data scientists need expertise in Python, but which skills are the most important for them to master? Find out the ten most vital Python skills in the latest rundown.

Thaylise Nakamoto

9 min

Building Diverse Data Teams with Tracy Daniels, Head of Insights and Analytics at Truist

Tracy and Richie discuss the best way to approach DE & I in data teams and the positive outcomes of implementing DEI correctly.
Richie Cotton's photo

Richie Cotton

49 min

Making Better Decisions using Data & AI with Cassie Kozyrkov, Google's First Chief Decision Scientist

Richie speaks to Google's first Chief Decision Scientist and CEO of Data Scientific, Cassie Kozyrkov, covering decision science, data and AI.
Richie Cotton's photo

Richie Cotton

68 min

Chroma DB Tutorial: A Step-By-Step Guide

With Chroma DB, you can easily manage text documents, convert text to embeddings, and do similarity searches.
Abid Ali Awan's photo

Abid Ali Awan

10 min

Textacy: An Introduction to Text Data Cleaning and Normalization in Python

Discover how Textacy, a Python library, simplifies text data preprocessing for machine learning. Learn about its unique features like character normalization and data masking, and see how it compares to other libraries like NLTK and spaCy.

Mustafa El-Dalil

5 min

See MoreSee More