
Cursus
Clusteranalyse in Python
4 Hr
65.8K
Hoe weet je na het trainen van een clusteringmodel of de clusters deugen?
Daar is geen universeel antwoord op. In traditionele supervised learning kun je voorspellingen vergelijken met echte labels en een accuraatheidsscore krijgen. Dat kan niet met clustering. Je koos k=5, maar is een andere k misschien beter? Zonder labels kun je niet zien of het algoritme de structuur vond of de data gewoon in willekeurige stukken heeft verdeeld.
De silhouettescore is de maatstaf die je zoekt. Hij laat zien hoe goed elk punt past bij zijn toegewezen cluster ten opzichte van het dichtstbijzijnde andere cluster, en het is een van de meest gebruikte metrics. Hij werkt zonder labels en is makkelijk te interpreteren.
In dit artikel neem ik je mee door de formule en hoe je die leest, laat ik een Python-voorbeeld met scikit-learn zien en bespreek ik wanneer het wel en niet de ideale oplossing is.
Nieuw met clustering? Lees onze tutorial Introductie tot k-Means Clustering met scikit-learn om te leren hoe het algoritme werkt en hoe je het gebruikt in Python.
De silhouettescore is een getal tussen -1 en 1 dat aangeeft hoe goed elk punt bij zijn cluster past.
Het getal laat je twee dingen zien:
Als het punt goed binnen zijn eigen groep ligt en ver van andere, is de score hoog. Als het aan de rand ligt, dichter bij een naburig cluster dan bij zijn eigen cluster, is de score laag.
Kort gezegd, dat is de balans die de silhouettescore laat zien. Hij omvat zowel hoe dicht punten binnen elk cluster gegroepeerd zijn als hoe goed clusters van elkaar gescheiden zijn. Beide zijn even belangrijk. Een clustering die punten goed groepeert maar clusters bovenop elkaar plaatst, is niet nuttig, en clustering die clusters goed scheidt maar punten losjes binnen die clusters laat zweven, evenmin.
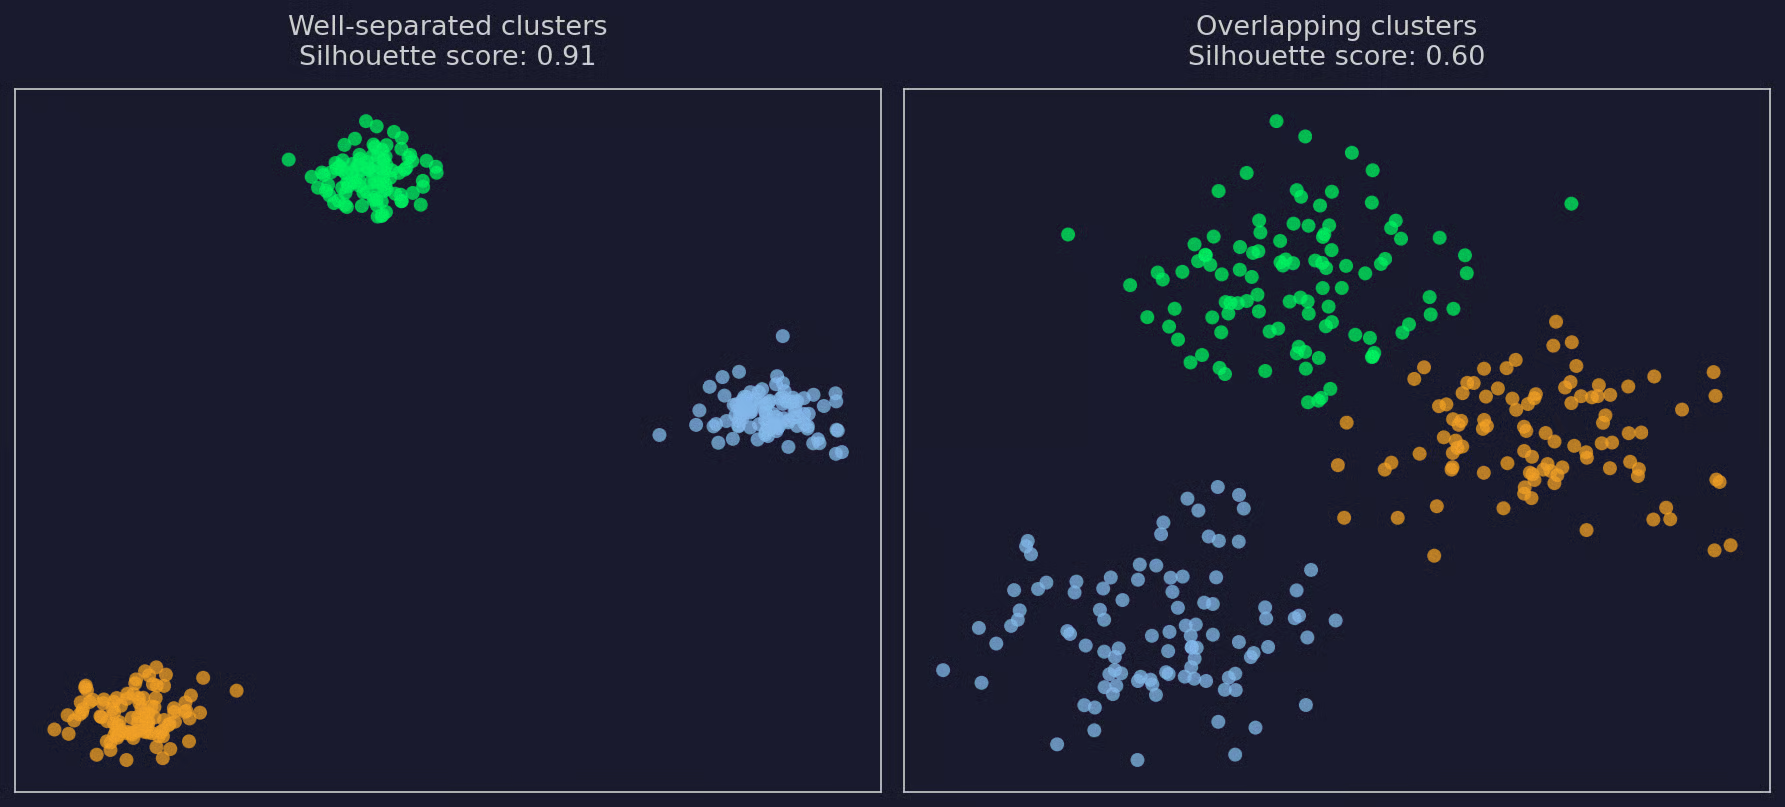
Goed gescheiden clusters vergeleken met overlappende clusters
Hogere scores betekenen beter gedefinieerde clusters. Een score dicht bij 1 betekent dat punten strak binnen hun cluster liggen en ver van andere. Een score dicht bij 0 betekent dat clusters overlappen of dat de grenzen vaag zijn. Een negatieve score betekent dat het punt dichter bij een ander cluster ligt dan bij het cluster waaraan het is toegewezen.
Elk punt krijgt zijn eigen silhouettescore, en die score komt uit twee afstanden.
De eerste is hoe ver het punt gemiddeld van de andere punten in zijn toegewezen cluster ligt. Als die klein is, ligt het punt dicht bij de anderen in het cluster. Als die groot is, is het punt los aan zijn cluster verbonden.
De tweede is hoe ver het punt gemiddeld van de punten in het dichtstbijzijnde naburige cluster ligt. Als die groot is, is het punt duidelijk gescheiden van andere clusters. Als die klein is, ligt het punt dicht bij de grens.
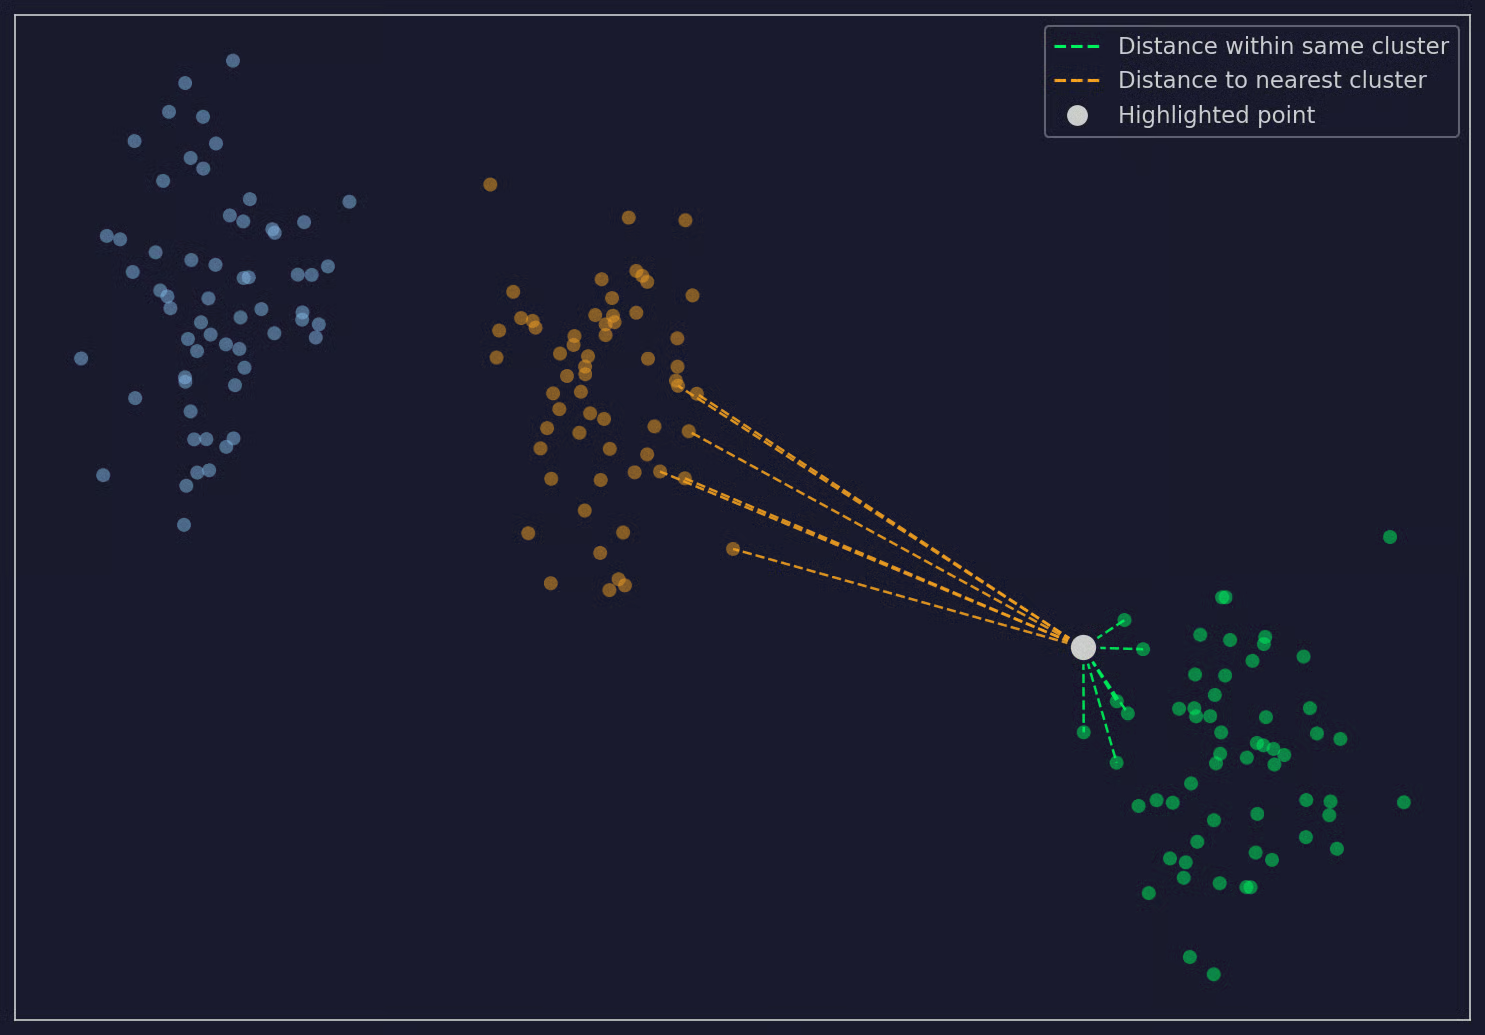
Afstand van een punt tot de clusters
De silhouettewaarde vergelijkt deze twee getallen. Een punt dat goed binnen zijn cluster ligt en ver van andere krijgt een hoge score. Een punt aan de rand (dicht bij een ander cluster) krijgt een lage score. Een punt dat dichter bij een ander cluster ligt dan bij zijn eigen cluster krijgt een negatieve score.
Onthoud hierbij dat geen van beide afstanden op zichzelf genoeg is.
Een strak cluster kan pal naast een ander liggen. Een goed gescheiden cluster kan intern verspreid zijn. Je hebt beide afstanden nodig om de toewijzing te vertrouwen.
Hier is de formule voor een enkel punt:
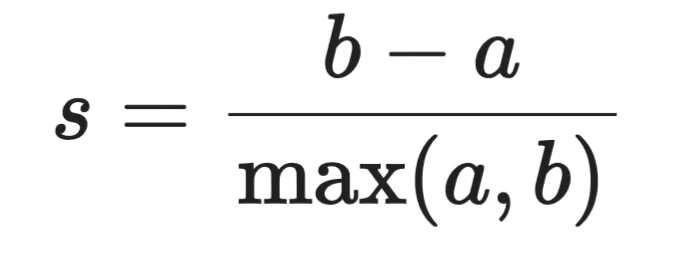
Formule voor de silhouettescore
Waarbij:
a de gemiddelde afstand is van het punt tot alle andere punten in hetzelfde cluster
b de gemiddelde afstand is van het punt tot alle punten in het dichtstbijzijnde naburige cluster
De formule deelt het verschil tussen b en a door de grootste van de twee.
In het algemeen kun je deze richtlijnen gebruiken om de score te interpreteren:
Als b veel groter is dan a: Het punt ligt ver van andere clusters en dicht bij zijn eigen cluster. De teller is dicht bij b, de noemer is ook b, en de score ligt dicht bij 1
Als a veel groter is dan b: Het punt ligt dichter bij een ander cluster dan bij zijn eigen cluster. De teller is een groot negatief getal dicht bij -a, de noemer is a, en de score ligt dicht bij -1
Als a en b ongeveer gelijk zijn: Het punt ligt op de grens tussen twee clusters. De teller ligt dicht bij 0, en de score ook
Meer over de details volgt zo.
Hier is een ruwe leidraad voor het lezen van de silhouettescore:
De drempels hierboven zijn slechts ruwe richtlijnen. Wat een goede silhouettescore is, hangt af van de dataset.
Schaars en hoog-dimensionale data levert vaak lagere scores op, zelfs als de clusters goed zijn. Dicht opeengepakte, goed gescheiden data kan scores boven 0,7 opleveren. Vergelijk scores tussen modellen op dezelfde dataset, niet met een universele drempel.
Je berekent de silhouettescore punt voor punt. Zo werkt het voor één punt.
Stap 1: Bereken a, de gemiddelde afstand van het punt tot elk ander punt in zijn eigen cluster. Als het punt in een cluster met 4 andere punten zit en de afstanden naar die punten 1,2, 1,5, 1,0 en 1,3 zijn:
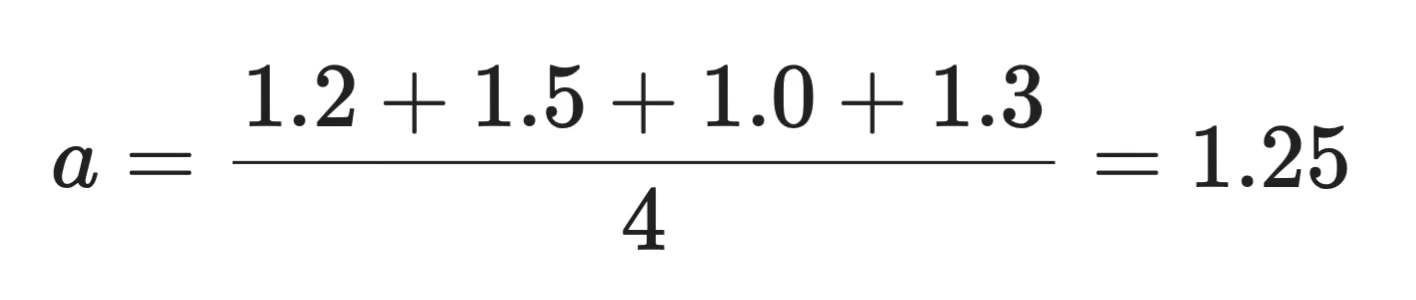
Berekening van de silhouettescore (1)
Stap 2: Vind het dichtstbijzijnde naburige cluster (dat wil zeggen het cluster, anders dan het eigen cluster van het punt, met de laagste gemiddelde afstand vanaf het punt). Bereken vervolgens b, de gemiddelde afstand van het punt tot elk punt in dat cluster. Als het dichtstbijzijnde cluster 5 punten heeft op afstanden 2,4, 2,8, 3,0, 2,6 en 2,7:
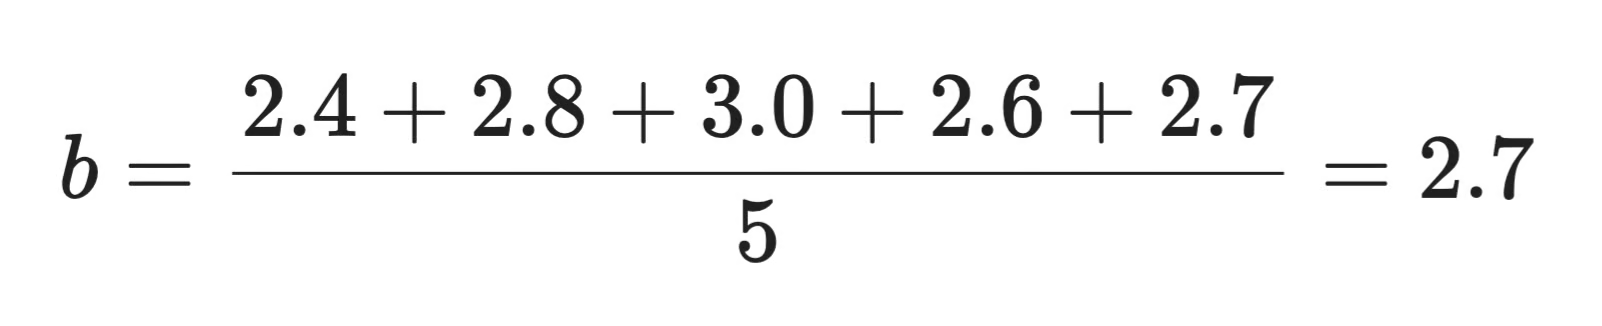
Berekening van de silhouettescore (2)
Stap 3: Vul a en b in de formule in:

Berekening van de silhouettescore (3)
Stap 4: Herhaal dit voor elk punt in de dataset. De totale silhouettescore voor de clustering is het gemiddelde van alle puntscores.
Scikit-learn geeft je twee functies om de silhouettescore te berekenen, beide in sklearn.metrics:
silhouette_score() geeft de gemiddelde score voor de hele clustering terug
silhouette_samples() geeft de score terug voor elk individueel punt
Zo gebruik je ze met KMeans op een synthetische dataset:
from sklearn.cluster import KMeans
from sklearn.datasets import make_blobs
from sklearn.metrics import silhouette_score, silhouette_samples

# Synthetic data with 4 clusters
X, _ = make_blobs(n_samples=500, centers=4, cluster_std=1.0, random_state=42)

# Clustering model
kmeans = KMeans(n_clusters=4, random_state=42, n_init=10)
labels = kmeans.fit_predict(X)

# Overall silhouette score
score = silhouette_score(X, labels)
print(f"Overall silhouette score: {score:.3f}")

# Per-point silhouette values
sample_scores = silhouette_samples(X, labels)
print(f"First 5 point scores: {sample_scores[:5]}")
Dit is de output die je krijgt als je de bovenstaande code uitvoert:

Voorbeeldoutput in Python
De totale score van 0,791 betekent dat de vier clusters goed gedefinieerd en gescheiden zijn.
De puntscores laten je elk datapunt analyseren.
Punten met hoge individuele scores liggen goed binnen hun cluster. Punten met lage of negatieve scores liggen op de grens of zijn verkeerd toegewezen, wat handig is om uitschieters op te sporen of grensgevallen te bekijken.
Een van de meest voorkomende toepassingen van de silhouettescore is het kiezen van de juiste k voor KMeans.
Dat doe je in drie stappen:
k met de hoogste scoreHier is de code daarvoor:
from sklearn.cluster import KMeans
from sklearn.datasets import make_blobs
from sklearn.metrics import silhouette_score

X, _ = make_blobs(n_samples=500, centers=4, cluster_std=1.0, random_state=42)

# Fit KMeans for k=2 to k=10 and keep track of the silhouette score for each
k_values = range(2, 11)
scores = []
for k in k_values:
    kmeans = KMeans(n_clusters=k, random_state=42, n_init=10)
    labels = kmeans.fit_predict(X)
    scores.append(silhouette_score(X, labels))
    print(f"k={k}: silhouette = {scores[-1]:.3f}")
Dit is de score die je per k ziet:
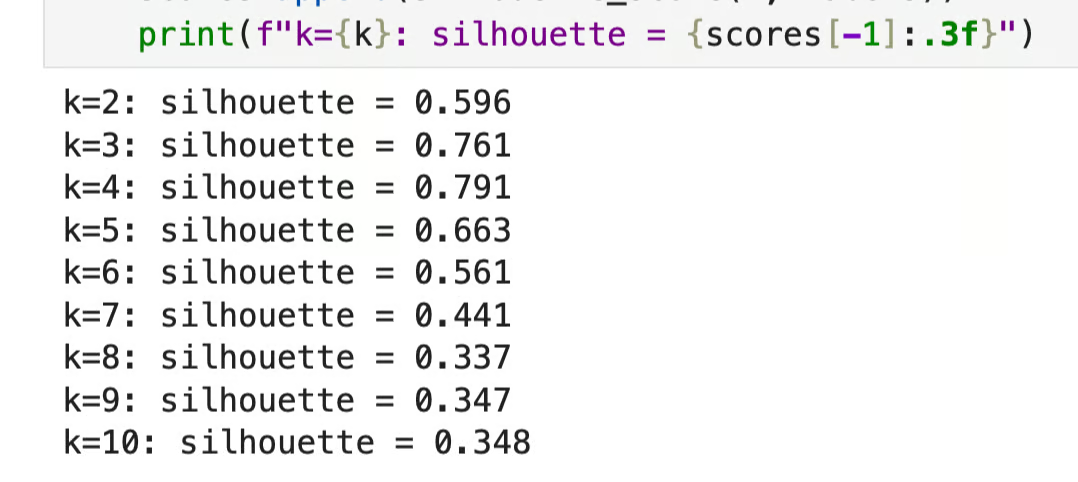
Silhouettescore bij verschillende waarden van k
De hoogste score ligt bij k=4. Dat is de waarde die je wilt kiezen.
Onthoud dat de silhouettescore domeinkennis niet vervangt. Als je businessprobleem om 5 klantsegmenten vraagt en de silhouette het hoogst is bij 4, kies dan niet automatisch 4. De metric laat zien waar de data de schoonste structuur heeft, maar soms is het juiste aantal clusters het aantal dat overeenkomt met iets dat in jouw probleem betekenisvol is.
De silhouettescore is waarschijnlijk de meest gebruikte maatstaf om clustering te beoordelen, maar niet de enige. Zo verhoudt hij zich tot alternatieven.
De elbow-methode is een visuele techniek om k in KMeans te kiezen. Je fit modellen voor een reeks k-waarden, je zet de inerta (som van kwadraten binnen clusters) uit tegen k, en je kiest de waarde waar de curve een scherpe knik vertoont.
De elbow-methode heeft hier het voordeel omdat hij snel en eenvoudig is. Maar de "knik" is niet altijd duidelijk. Bij rommelige data kan de curve soms vloeiend lijken en zie je niet waar hij buigt.
De silhouettescore geeft je een echt getal voor elke k, zodat je zinvoller kunt vergelijken. Het is trager om te berekenen, maar laat de beslissing niet over aan visuele interpretatie.
Gebruik de elbow-methode voor een snelle sanity check. Gebruik de silhouettescore als je een onderbouwd antwoord nodig hebt.
De Davies-Bouldin-index (DBI) meet de gemiddelde gelijkenis tussen elk cluster en het meest gelijkende. Lager is beter, en een perfecte score is 0.
DBI gebruikt clustercentroïden om gelijkenis te berekenen, wat hem sneller maakt dan de silhouettescore op grote datasets. Het hanteert ook een vergelijkbare intuïtie door strakke en goed gescheiden clusters te belonen.
Het nadeel is dat DBI je alleen iets vertelt over de clustering als geheel. De silhouettescore geeft ook een puntscore, zodat je grensgevallen en uitschieters kunt vinden.
Gebruik DBI als je met grote datasets werkt en snelheid belangrijk is. Gebruik de silhouettescore als je individuele punten wilt bekijken.
De Calinski-Harabasz-index (CH), ook wel de variatie-ratio-criterium genoemd, is de verhouding tussen spreiding tussen clusters en spreiding binnen clusters. Hogere scores betekenen betere clustering, en de score is onbegrensd (geen bovengrens).
CH is snel en werkt goed op grote datasets omdat het alleen clusterstatistieken gebruikt. Net als silhouette en DBI werkt het het best op convexe, goed gescheiden clusters.
CH heeft ook geen natuurlijke schaal, dus je kunt CH-scores alleen vergelijken tussen modellen op dezelfde dataset, niet tussen verschillende datasets.
Gebruik CH wanneer je dataset groot is en je snel resultaten nodig hebt. Gebruik de silhouettescore als je interpretatie en inzichten per datapunt wilt.
De bovenstaande metrics (silhouette, DBI, CH, elbow) zijn allemaal interne metrics. Ze beoordelen clustering alleen met de data zelf, zonder grondwaarheidslabels. Dat maakt ze de standaardkeuze voor clustering in de praktijk, waar labels niet bestaan.
Externe metrics vergelijken cluster-toewijzingen met bekende labels. De Adjusted Rand Index (ARI), Normalized Mutual Information (NMI) en homogeniteit zijn veelvoorkomende voorbeelden. Ze worden gebruikt wanneer je labels hebt en wilt testen hoe goed een clusteringalgoritme die terugvindt.
Gebruik interne metrics wanneer je geen labels hebt, wat meestal het geval is. Gebruik externe metrics wanneer je clusteringalgoritmen benchmarkt op gelabelde data.
Hier is een overzicht van de metrics naast elkaar:
| Methode | Bereik | Beste waarde | Snelheid | Gebruik voor |
|---|---|---|---|---|
| Silhouettescore | -1 tot 1 | Dicht bij 1 | Traag op grote datasets | Interpretatie en inzichten per punt |
| Elbow-methode | 0 tot oneindig | Zoek de knik | Snel | Snelle controles |
| Davies-Bouldin-index | 0 tot oneindig | Dicht bij 0 | Snel | Grote datasets |
| Calinski-Harabasz-index | 0 tot oneindig | Hoger is beter | Snel | Grote, ongelabelde datasets |
Silhouettescore vergeleken met alternatieven
De silhouettescore heeft een paar beperkingen die het waard zijn om te kennen:
O(n^2). Op datasets met miljoenen punten wordt dit kostbaarDe silhouettescore werkt het best als je een paar basispraktijken volgt:
k (of verschillende algoritmen) en hun scores naast elkaar vergelijkenk=5, zelfs wanneer 5 clusters in jouw probleem betekenisvol zijnDe silhouettescore is een van de meest intuïtieve manieren om clustering te beoordelen omdat hij zowel laat zien hoe strak punten gegroepeerd zijn als hoe goed clusters gescheiden zijn.
Je berekent hem punt voor punt, neemt het gemiddelde en krijgt een enkel getal tussen -1 en 1. Scores dichter bij 1 betekenen beter gedefinieerde clusters, en scores rond of onder 0 betekenen dat de structuur niet echt een structuur is
Maar de silhouettescore is slechts een begin. Je moet hem combineren met clustervisualisaties en, het belangrijkst, je eigen domeinkennis van het probleem. Pas als al deze in dezelfde richting wijzen, kun je het resultaat vertrouwen.
De silhouettescore maakt deel uit van het grotere geheel van Unsupervised Learning in Python. Schrijf je vandaag in en leer hoe je ongelabelde data clustert, transformeert, visualiseert en er inzichten uithaalt.
Leren met DataCamp
Cursus
Cursus
Cursus