You most probably will know by now that data storytelling, accomplished by data visualization, amongst other things, is an essential skill for every data scientist: after you have turned the raw data into understanding, insights and knowledge, you also need to communicate these findings effectively to your audience.
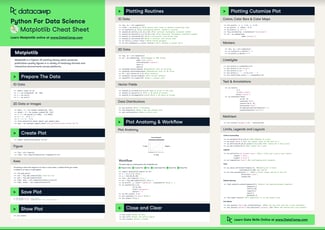
For most beginners, the first Python data visualization library that they use is, naturally, Matplotlib. It is a Python 2D plotting library that enables users to make publication-quality figures. It is quite an extensive library where a cheat sheet will definitely come in handy when you're learning, but when you manage to use this library effectively, you'll also be able to get insights and work better with other packages, such as Pandas, that intend to build more plotting integration with Matplotlib as time goes on.
Another package that you'll be able to tackle easily is Seaborn, the statistical data visualization library of Python.
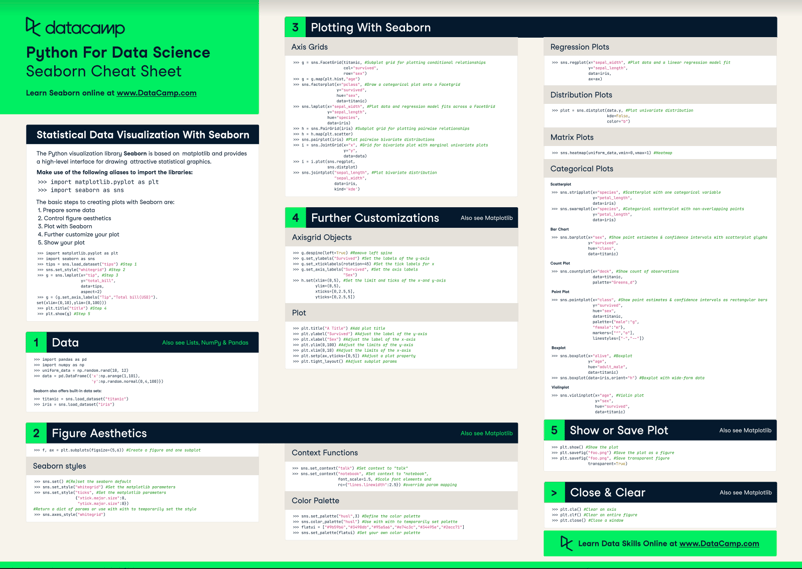
DataCamp has created a Seaborn cheat sheet for those who are ready to get started with this data visualization library with the help of a handy one-page reference. We also have a Seaborn beginners tutorial and a Seaborn line plot tutorial that can help you as you learn.
You'll see that this cheat sheet presents you with the five basic steps that you can go through to make beautiful statistical graphs in Python.
Check out the infographic by clicking on the button below:



You most probably will know by now that data storytelling, accomplished by data visualization, amongst other things, is an essential skill for every data scientist: after you have turned the raw data into understanding, insights and knowledge, you also need to communicate these findings effectively to your audience.
For most beginners, the first Python data visualization library that they use is, naturally, Matplotlib. It is a Python 2D plotting library that enables users to make publication-quality figures. It is quite an extensive library where a cheat sheet will definitely come in handy when you're learning, but when you manage to use this library effectively, you'll also be able to get insights and work better with other packages, such as Pandas, that intend to build more plotting integration with Matplotlib as time goes on.
Another package that you'll be able to tackle easily is Seaborn, the statistical data visualization library of Python.
DataCamp has created a Seaborn cheat sheet for those who are ready to get started with this data visualization library with the help of a handy one-page reference. We also have a Seaborn beginners tutorial and a Seaborn line plot tutorial that can help you as you learn.
You'll see that this cheat sheet presents you with the five basic steps that you can go through to make beautiful statistical graphs in Python.
Check out the infographic by clicking on the button below: