HomeCheat sheetsData Analysis

Python Seaborn Cheat Sheet

This Python Seaborn cheat sheet with code samples guides you through the data visualization library that is based on Matplotlib.
Jul 2021  · 2 min read

You most probably will know by now that data storytelling, accomplished by data visualization, amongst other things, is an essential skill for every data scientist: after you have turned the raw data into understanding, insights and knowledge, you also need to communicate these findings effectively to your audience.

For most beginners, the first Python data visualization library that they use is, naturally, Matplotlib. It is a Python 2D plotting library that enables users to make publication-quality figures. It is quite an extensive library where a cheat sheet will definitely come in handy when you're learning, but when you manage to use this library effectively, you'll also be able to get insights and work better with other packages, such as Pandas, that intend to build more plotting integration with Matplotlib as time goes on.

Another package that you'll be able to tackle easily is Seaborn, the statistical data visualization library of Python.

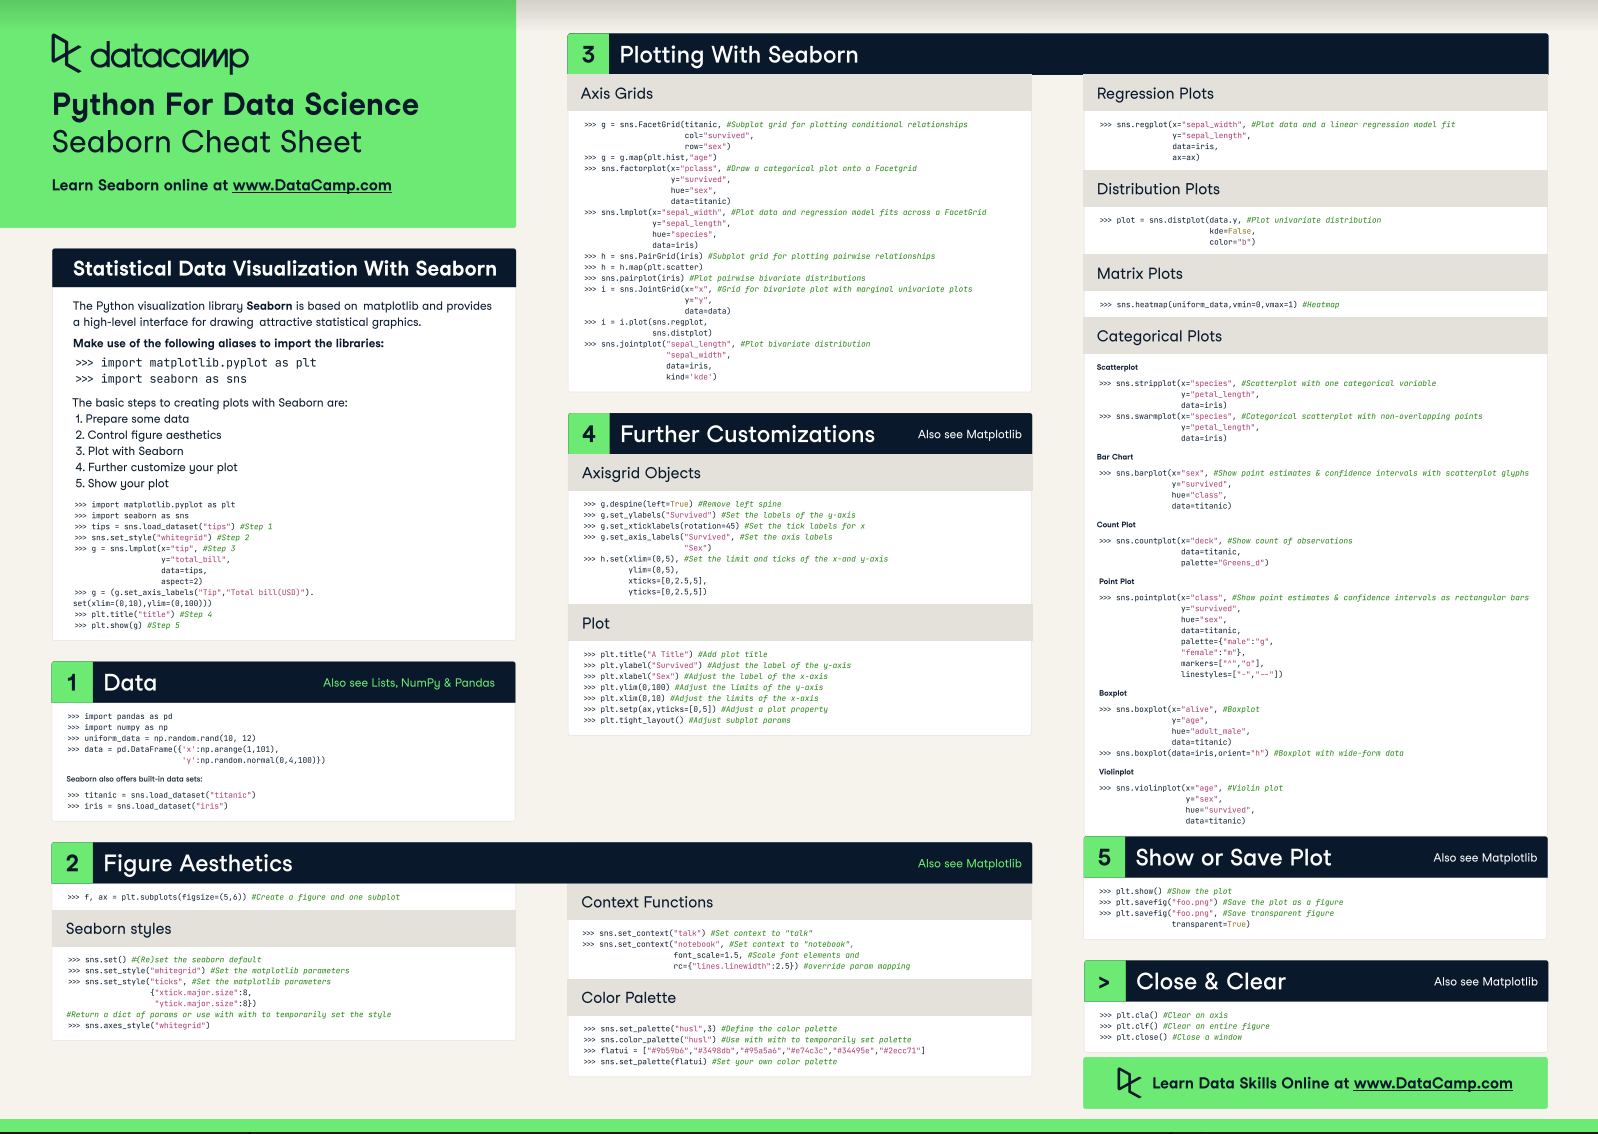
DataCamp has created a Seaborn cheat sheet for those who are ready to get started with this data visualization library with the help of a handy one-page reference. We also have a Seaborn beginners tutorial and a Seaborn line plot tutorial that can help you as you learn. 

You'll see that this cheat sheet presents you with the five basic steps that you can go through to make beautiful statistical graphs in Python.

Check out the infographic by clicking on the button below:

Seaborn Python cheat sheet

Have this cheat sheet at your fingertips

Download PDF

This cheat sheet will walk you through the five steps that you need to go through to make these plots: you'll see how you can load in data, set the figure aesthetics, plot, customize and eventually, show or save your plot with Seaborn.

What might have looked difficult before will definitely be more clear once you start using this cheat sheet! Use it in combination with the Seaborn Gallery, the documentation, and our Seaborn tutorial.

Also, don't miss out on our other cheat sheets for data science that cover SciPy, NumPy, Scikit-Learn, Bokeh, Pandas and the Python basics.
Learn more about Seaborn

Introduction to Data Visualization with Seaborn

Intermediate Data Visualization with Seaborn

Related

Building Your Data Science Portfolio with DataCamp Workspace (Part 1)

Learn how to build a comprehensive data science portfolio by exploring examples different examples, mastering tips to make your work stand out, and utilizing the DataCamp Workspace effectively to showcase your results.
Justin Saddlemyer's photo

Justin Saddlemyer

9 min

Pandas 2.0: What’s New and Top Tips

Dive into pandas 2.0, the latest update of the essential data analysis library, with new features like PyArrow integration, nullable data types, and non-nanosecond datetime resolution for better performance and efficiency.
Moez Ali's photo

Moez Ali

9 min

Building a Safer Internet with Data Science

Learn the key drivers of a data strategy that helps ensure online safety and consumer protection with Richard Davis, the Chief Data Officer at Ofcom, the UK’s government-approved regulatory and competition authority. 
Adel Nehme's photo

Adel Nehme

43 min

Conda Cheat Sheet

In this cheat sheet, learn all about the basics of working with Conda. From managing and installing packages, to working with channels & environments, learn the fundamentals of the conda package management tool suite.
Richie Cotton's photo

Richie Cotton

Matplotlib time series line plot

This tutorial explores how to create and customize time series line plots in matplotlib.
Elena Kosourova's photo

Elena Kosourova

8 min

Introduction to LangChain for Data Engineering & Data Applications

LangChain is a framework for including AI from large language models inside data pipelines and applications. This tutorial provides an overview of what you can do with LangChain, including the problems that LangChain solves and examples of data use cases.
Richie Cotton's photo

Richie Cotton

11 min

See MoreSee More