

什么是 GLM Image?
GLM-Image 是 Z.ai 的文本生成图像模型(通过 glm-image 模型 ID 提供),专为处理知识密集、版式敏感的生成任务而构建,例如海报、PPT 风格视觉与科学示意图。
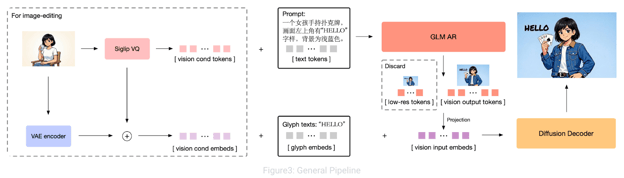
图:GLM-Image:面向密集知识与高保真图像生成的自回归方法
在底层,它采用混合的自回归与扩散解码器设计:自回归骨干负责指令理解与全局版式,扩散解码器用于细化高频细节(包括更锐利的文字笔画)。这种混合架构是 GLM-Image 在文本密集型视觉上比许多纯扩散生成器更可靠的重要原因。
在本教程中,我们将 GLM-Image 用作每页幻灯片的渲染引擎。我们不做模糊提示,而是向其提供严格、具版式意识的提示,明确以下要素:
- 单一纯色背景(无渐变),
- 配色约束(背景 / 强调 / 文本),
- 清晰的字体层级(标题 vs 正文 vs 注脚),
- 按幻灯片类型的明确版式规则(统计、对比、时间线、流程、列表),
- 可选的图表绘制指令(柱状 / 饼图 / 折线),
- 页脚注释与页码。
注意:GLM-Image 返回图像 URL,支持常见的演示长宽比(如 16:9),并在推荐尺寸(如 1728×960)下效果最佳。
GLM Image 教程:构建实时信息图生成器
本节我们将构建一个由 Gemini 2.5 Flash 和 GLM-Image 驱动、封装在 Streamlit 应用中的“从提示到信息图幻灯片集”的流水线。整体上,应用执行三项核心任务:
- 基于最新网络数据研究主题,使幻灯片反映当前数字与趋势,而非陈旧的模型记忆
- 将研究结果转换为结构化的幻灯片方案,包括严格的 JSON 架构,定义统计、时间线、对比、流程与总结等版式
- 使用 GLM-Image 将每页渲染为完整的信息图图像,包括字体层级、主题配色、版式约束、可选图表与页码。
在幕后,工作流由两个关键阶段驱动:
- 阶段 1:
research_topic(topic)函数使用启用网络搜索的 Gemini 2.5 Flash,生成针对该主题的数据丰富的研究摘要。 - 阶段 2:
structure_slides()函数将研究结果转为 JSON 幻灯片集,然后进一步转换为详细的 GLM-Image 提示,并逐页渲染。
步骤 1:获取 API 密钥
在构建信息图生成器之前,我们需要访问支撑核心流水线的两个外部服务:
- OpenRouter 提供对 Gemini 2.5 Flash 的访问,我们用它进行基于网络的研究与幻灯片结构化。
- Z.ai 通过 API 与 HuggingFace 托管 GLM-Image 模型,用于生成最终的信息图幻灯片。
这种分工是有意为之。文本模型负责数据采集与规划,而 GLM-Image 专注于视觉生成。
步骤 1.1:OpenRouter API 密钥
OpenRouter 充当统一网关,使用一把密钥即可访问多种模型(Gemini、OpenAI、Claude 等)。
- 在 OpenRouter 创建账户并生成 API 密钥。
- 充值少量额度(约 5 美元)。这足以支持多次本演示与后续试验。
本教程选择使用 Gemini 2.5 Flash,因为它支持网络搜索,使应用能够检索最新数据与统计,而不只依赖模型的训练知识。如有需要,您也可替换为其他受支持的模型。
步骤 1.2:Z.ai API 密钥
接下来,在 Z.ai 创建账户以访问 GLM Image 模型。
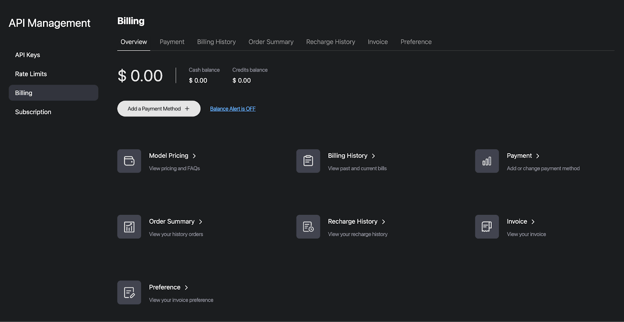
- 进入 API Management 并选择 Billing
- 点击 Add Payment Method,填写卡片信息
- 为图像生成端点生成 API 密钥
此密钥将用于调用 glm-image 模型以渲染每张幻灯片。
步骤 1.3:将密钥存为环境变量
创建两把密钥后,使用以下命令将它们保存为环境变量:
export OPENROUTER_API_KEY="Your_OpenRouter_API_Key"
export ZAI_API_KEY="Your_ZAI_API_Key"通过环境变量可将凭据与代码库隔离,并使部署到 Streamlit Cloud、Docker 或其他环境更加容易。
步骤 2:安装依赖
接下来,我们安装所需依赖并开始构建 Streamlit 应用。
pip install streamlit requests Pillow安装完这些包后,我们导入应用中用到的标准库,并定义两个 API 端点的常量。
import streamlit as st
import json
import time
import requests
import os
import io
import re
import zipfile
from datetime import date
from PIL import Image
from typing import Optional, List, Dict
OPENROUTER_API_URL = "https://openrouter.ai/api/v1/chat/completions"
OPENROUTER_MODEL = "google/gemini-2.5-flash"
GLM_IMAGE_API_URL = "https://api.z.ai/api/paas/v4/images/generations"
GLM_IMAGE_MODEL = "glm-image"这些库构成了应用的运行时层。Streamlit 提供交互式网页界面,Requests 负责对 OpenRouter(Gemini 2.5 Flash)与 Z.ai(GLM-Image)的 API 调用,Pillow 用于加载并显示生成的图像。其他标准库用于管理 JSON 解析、环境变量、计时与将结果导出为 ZIP 文件。
我们还为 OpenRouter 与 GLM-Image 端点定义了常量,使应用知道向何处发送研究、结构化与图像生成请求。此设置让本地环境保持轻量,所有重计算都交由 API 完成。
步骤 3:定义分辨率与演示主题
此步骤我们定义一小组分辨率预设与主题库,用于控制背景色、强调色、字体风格,以及将注入每个 GLM-Image 提示中的信息图风格描述。
RESOLUTIONS = {
"16:9 Landscape (1728×960)": "1728x960",
"3:2 Landscape (1568×1056)": "1568x1056",
"1:1 Square (1280×1280)": "1280x1280",
"2:3 Portrait (1056×1568)": "1056x1568",
}
THEMES = {
"Corporate Navy": {
"desc": "Professional dark blue palette, clean sans-serif, data-driven",
"colors": {"bg": "#0F172A", "accent": "#38BDF8", "text": "#F1F5F9"},
"style": (
"professional corporate infographic, dark navy blue (#0F172A) background, "
"cyan (#38BDF8) accent color, clean white (#F1F5F9) text, "
"modern sans-serif typography, clean grid layout, subtle geometric decorations, "
"professional data visualization elements, business presentation quality"
),
},
"Neon Noir": {
"desc": "Dark mode with vivid neon pink accents, tech-forward aesthetic",
"colors": {"bg": "#1A1A2E", "accent": "#E94560", "text": "#EAEAEA"},
"style": (
"dark mode tech infographic, deep dark (#1A1A2E) background, "
"vivid neon pink (#E94560) accent color, light gray (#EAEAEA) text, "
"bold modern typography with sharp edges, neon glow effects, "
"futuristic layout with geometric shapes, startup pitch deck aesthetic"
),
},
"Warm Paper": {
"desc": "Cream textured backgrounds, burnt orange accents, editorial feel",
"colors": {"bg": "#F8F5F0", "accent": "#D4641A", "text": "#1C1917"},
"style": (
"warm editorial infographic on cream (#F8F5F0) textured paper background, "
"burnt orange (#D4641A) accent color, dark brown (#1C1917) text, "
"elegant serif typography mixed with clean sans-serif, "
"magazine editorial layout, hand-drawn illustration elements, "
"warm earth tones, scholarly professional design"
),
},
"Cyber Teal": {
"desc": "Black backgrounds, electric teal highlights, terminal-inspired",
"colors": {"bg": "#0C0A09", "accent": "#22D3EE", "text": "#FAFAF9"},
"style": (
"cyberpunk infographic, black (#0C0A09) background, "
"electric teal (#22D3EE) accent color, white (#FAFAF9) text, "
"monospace and tech typography, terminal-inspired layout elements, "
"circuit board patterns, data stream visuals, hacker aesthetic, "
"sharp angular design elements"
),
},
"Indigo Dream": {
"desc": "Deep purple base with soft violet accents, premium feel",
"colors": {"bg": "#1E1B4B", "accent": "#A78BFA", "text": "#EDE9FE"},
"style": (
"premium luxury infographic, deep indigo (#1E1B4B) background, "
"soft violet (#A78BFA) accent color, lavender (#EDE9FE) text, "
"elegant modern typography, gradient overlays, "
"smooth rounded shapes, glassmorphism effects, "
"high-end presentation quality with subtle glow effects"
),
},
"Solar Gold": {
"desc": "Warm cream with golden accents, confident and bold",
"colors": {"bg": "#FEFCE8", "accent": "#A16207", "text": "#1C1917"},
"style": (
"premium golden infographic, warm cream (#FEFCE8) background, "
"rich gold (#A16207) accent color, dark (#1C1917) text, "
"bold confident typography, art deco inspired geometric patterns, "
"luxury brand aesthetic, clean information hierarchy, "
"warm highlights and gold foil style embellishments"
),
},
"Forest Green": {
"desc": "Dark green palette, nature-inspired, calming data storytelling",
"colors": {"bg": "#052E16", "accent": "#4ADE80", "text": "#F0FDF4"},
"style": (
"nature-inspired infographic, deep forest green (#052E16) background, "
"bright green (#4ADE80) accent color, light mint (#F0FDF4) text, "
"organic flowing typography, leaf and nature motif decorations, "
"sustainability report aesthetic, calming visual design, "
"clean environmental data presentation"
),
},
"Crimson Bold": {
"desc": "High contrast red on dark, attention-grabbing poster style",
"colors": {"bg": "#1C1917", "accent": "#EF4444", "text": "#FAFAF9"},
"style": (
"bold poster-style infographic, dark charcoal (#1C1917) background, "
"vivid crimson red (#EF4444) accent color, white (#FAFAF9) text, "
"oversized impactful numbers, bold condensed typography, "
"high contrast design, attention-grabbing layout, "
"social media optimized visual hierarchy"
),
},
}
EXAMPLE_TOPICS = [
"AI Industry Market Trends January 2026",
"Global Electric Vehicle Sales 2025",
"SpaceX Starship Progress 2025-2026",
"State of Remote Work 2026",
"Bitcoin & Crypto Market February 2026",
"Climate Change Key Metrics 2025",
]RESOLUTIONS 字典将标签映射为 Z.ai 图像生成端点所需的精确 宽x高 字符串。好处在于可预期性,即无需更改任何提示逻辑即可切换格式(宽屏幻灯片 vs 正方形社媒素材 vs 竖版)。长宽比说明:
- 16:9 最适合经典幻灯片与演示风信息图。
- 1:1 适用于 LinkedIn/Twitter 的轮播式视觉。
- 2:3 适合移动端优先的信息图海报。
我们还定义了 THEMES,每个主题是一个紧凑的设计系统,由三部分构成:
desc:侧边栏展示的简短 UI 描述colors:严格的配色(背景、强调、文本)style:可提示的风格块,引导 GLM-Image 在版式、字体与装饰上保持一致
实践中,这个主题对象就是每张幻灯片的“提示前缀”,使整套幻灯片像一个统一产品,而不是 7 张彼此无关的图片。
步骤 4:阶段一——使用 Gemini 2.5 Flash 进行研究
在生成幻灯片之前,我们需要相关主题的最新数据。本步骤不依赖模型静态知识,而是通过 OpenRouter 启用网络搜索的 Gemini 2.5 Flash,收集新鲜的统计、时间线与关键信息。
def call_openrouter(
messages: List[Dict],
api_key: str,
use_web_search: bool = False,
temperature: float = 0.7,
max_tokens: int = 4096,
) -> str:
headers = {
"Authorization": f"Bearer {api_key}",
"Content-Type": "application/json",
"HTTP-Referer": "https://glm-image-infographic-demo.streamlit.app",
"X-Title": "GLM-Image Infographic Generator",
}
payload = {
"model": OPENROUTER_MODEL,
"messages": messages,
"temperature": temperature,
"max_tokens": max_tokens,
}
if use_web_search:
today = date.today().strftime("%B %d, %Y")
payload["plugins"] = [{
"id": "web",
"max_results": 10,
"search_prompt": (
f"Use these recent web search results (searched on {today}) to answer "
f"with the most up-to-date information available:"
),
}]
resp = requests.post(OPENROUTER_API_URL, headers=headers, json=payload, timeout=120)
resp.raise_for_status()
data = resp.json()
content = data.get("choices", [{}])[0].get("message", {}).get("content", "")
if not content:
raise ValueError(f"Empty response from OpenRouter: {json.dumps(data, indent=2)[:500]}")
return content
def research_topic(topic: str, api_key: str) -> str:
today = date.today().strftime("%B %d, %Y") # e.g. "February 13, 2026"
current_year = date.today().year
messages = [
{
"role": "system",
"content": (
f"You are a focused research analyst. Today's date is {today}. "
f"CRITICAL: You must research ONLY the specific topic provided. Do NOT include "
f"information about unrelated topics, industries, or subjects. If web search returns "
f"irrelevant results, ignore them completely. "
f"Your training data may be outdated. Rely primarily on the web search results "
f"provided to you for current data. Prioritize sources from {current_year} and "
f"late {current_year - 1}. If a data point comes from an older source, note the year. "
f"Compile comprehensive, data-rich research on the given topic. Include specific "
f"numbers, percentages, dollar amounts, growth rates, timelines, and key players. "
f"Provide data suitable for multiple visualization formats: charts, comparisons, "
f"timelines, and processes. Be thorough but concise. Stay strictly on topic."
),
},
{
"role": "user",
"content": (
f"Research ONLY this specific topic and provide a data-rich summary:\n\n"
f"**{topic}**\n\n"
f"CRITICAL INSTRUCTIONS:\n"
f"1. Research EXCLUSIVELY about '{topic}' - nothing else\n"
f"2. Ignore any web search results not directly related to '{topic}'\n"
f"3. Do NOT include data about semiconductors, smartphones, grooming products, or other "
f"unrelated industries unless they are directly part of '{topic}'\n"
f"4. Search for the most recent data available as of {today}\n"
f"5. Prefer sources published in {current_year}\n\n"
f"For '{topic}' specifically, include:\n"
f"- Key statistics with specific numbers, percentages, or dollar amounts\n"
f"- Comparison data directly relevant to '{topic}'\n"
f"- Timeline or chronological events related to '{topic}'\n"
f"- Process or methodology descriptions relevant to '{topic}'\n"
f"- Market sizes, growth rates, and future outlook for '{topic}'\n"
f"- Major players/entities involved in '{topic}'\n\n"
f"Structure the data so it can be visualized as bar charts, pie charts, "
f"timelines, comparison tables, and process diagrams - all focused on '{topic}'."
),
},
]
return call_openrouter(messages, api_key, use_web_search=True, temperature=0.5)上述代码定义了构成研究层的两个关键辅助函数。
call_openrouter()函数充当与 OpenRouter(Gemini 2.5 Flash 模型)交互的接口。它构建包含模型名、消息、温度与 token 限制的请求载荷,并通过 API 密钥进行认证。- 当
use_web_search=True时,函数启用网络插件并注入搜索提示,使模型优先使用最新信息。发送请求后,它会验证响应并提取生成文本,确保流水线不会在空输出或失败时继续。 research_topic()函数构建一个专为信息图生成设计的研究提示。提示明确要求定量信息,如统计、增速、市场规模、时间线、对比与关键参与者,以便后续可视化为图表、表格或示意图。函数随后以较低温度调用call_openrouter(),使输出更事实化、结构化。
您可以调整温度、网络结果数量或研究指令的严格程度,以控制数据的广度、时效性与精确度之间的平衡。
下一步我们将把原始研究转化为结构化的幻灯片架构(JSON),在发送给 GLM-Image 前,为每页定义版式、关键指标与视觉元素。
步骤 5:阶段二——将研究转换为结构化幻灯片 JSON
研究完成后,下一步是将其转换为 GLM-Image 可一致渲染的结构化蓝图。我们不直接传段落文本,而是生成严格的 JSON 方案,让每一页明确其版式、关键信息与可选图表数据。
def structure_slides(topic: str, research: str, num_slides: int, api_key: str) -> List[Dict]:
system_prompt = f"""You create structured infographic slide decks. Return ONLY a valid JSON array with exactly {num_slides} slide objects. No markdown backticks. No explanation. Just the JSON.
SLIDE FORMATS:
Slide 1 — Title:
{{"type":"title","slide_number":1,"headline":"Bold Title (max 8 words)","subheadline":"One-liner with a key stat","tag":"CATEGORY LABEL","visual_elements":"2-3 topic-relevant decorative motifs (e.g. globe icon, circuit pattern for tech topics)"}}
Slides 2 to {num_slides-1} — Content (pick ONE layout per slide):
Layout "stat" — Use when there is one standout number to feature:
{{"type":"content","slide_number":N,"layout":"stat","headline":"Section Title (max 6 words)","key_stat":"$4.2T or +340%","key_stat_label":"What the stat means","bullets":["3-4 bullets with specific numbers"],"visual_elements":"2-3 topic-relevant icons","chart_data":{{"type":"bar|pie|line","title":"Chart title","data":[{{"label":"Category","value":"123"}}]}},"bottom_note":"Source"}}
Layout "comparison" — Use for side-by-side comparisons:
{{"type":"content","slide_number":N,"layout":"comparison","headline":"Section Title","items":[{{"label":"Item A","points":["fact 1 with number","fact 2 with number"]}},{{"label":"Item B","points":["fact 1","fact 2"]}}],"visual_elements":"topic-relevant icons","bottom_note":"Source"}}
Layout "timeline" — Use for chronological progressions:
{{"type":"content","slide_number":N,"layout":"timeline","headline":"Section Title","milestones":[{{"date":"2020","event":"Event description with metric"}},{{"date":"2023","event":"Another event"}}],"visual_elements":"topic-relevant icons","bottom_note":"Source"}}
Layout "process" — Use for step-by-step flows:
{{"type":"content","slide_number":N,"layout":"process","headline":"Section Title","steps":[{{"step":"1","title":"Step Name","detail":"Description with metric"}},{{"step":"2","title":"Next Step","detail":"Description"}}],"visual_elements":"topic-relevant icons","bottom_note":"Source"}}
Layout "list" — Use for data-rich bullets without a dominant stat:
{{"type":"content","slide_number":N,"layout":"list","headline":"Section Title","bullets":["4-5 bullets each with a specific number/metric"],"visual_elements":"topic-relevant icons","chart_data":{{"type":"bar|pie|line","title":"Chart title","data":[{{"label":"Category","value":"123"}}]}},"bottom_note":"Source"}}
Slide {num_slides} — Summary:
{{"type":"summary","slide_number":{num_slides},"headline":"Key Takeaways","takeaways":["4-5 punchy takeaway lines with data"],"outlook":"One sentence future outlook","visual_elements":"topic-relevant closing motif"}}
RULES:
- Every bullet MUST contain a specific number, percentage, or dollar amount
- Use a MIX of layouts across the deck. Do NOT use "stat" for every slide. Choose the layout that best fits the content. At most half of content slides should use "stat" layout.
- key_stat is ONLY used with "stat" layout. Other layouts do NOT have key_stat.
- visual_elements MUST be topic-specific (e.g. for EV topic: "electric car silhouette, battery icon, charging station"; for AI topic: "neural network diagram, robot icon, chip illustration"; for climate: "globe, thermometer, polar bear"). NEVER use generic shapes.
- chart_data is OPTIONAL. Include it when the slide's data naturally fits a chart. Fields:
* type: "bar", "pie", or "line"
* title: short chart title
* data: array of {{"label":"...","value":"..."}} with real numbers from the research
* axis_label: (optional) label for the value axis
Not every slide needs chart_data. Use it for stat and list layouts when data is quantitative.
- Each slide covers a distinct aspect — no repetition
- Ensure logical narrative flow across slides"""
messages = [
{"role": "system", "content": system_prompt},
{
"role": "user",
"content": (
f"Create a {num_slides}-slide infographic deck about:\n\n"
f"**{topic}**\n\n"
f"RESEARCH DATA:\n{research}\n\n"
f"Return ONLY the JSON array."
),
},
]
raw = call_openrouter(messages, api_key, use_web_search=False, temperature=0.2)
raw = re.sub(r"^```(?:json)?\s*", "", raw.strip())
raw = re.sub(r"\s*```$", "", raw.strip())
return json.loads(raw)
def _build_chart_instruction(chart_data: Dict, accent_hex: str) -> str:
if not chart_data or not chart_data.get("type"):
return ""
chart_type = chart_data["type"]
title = chart_data.get("title", "Chart")
data = chart_data.get("data", [])
axis_label = chart_data.get("axis_label", "")
if not data:
return ""
if chart_type == "bar":
bars = ", ".join([f"'{d['label']}': {d['value']}" for d in data])
axis_part = f" Y-axis label: '{axis_label}'." if axis_label else ""
return (
f"Draw a vertical bar chart titled '{title}' in the lower-right area of the slide, "
f"taking up about 40% of the slide width. "
f"Bars: [{bars}]. Label each bar clearly below it with its category name. "
f"Display the value on top of each bar.{axis_part} "
f"Use {accent_hex} color for the bars with slight shade variation between them. "
)
elif chart_type == "pie":
segments = ", ".join([f"'{d['label']}': {d['value']}%" for d in data])
return (
f"Draw a pie chart titled '{title}' in the lower-right area of the slide, "
f"taking up about 35% of the slide width. "
f"Segments: [{segments}]. Label each segment with its name and percentage value. "
f"Use {accent_hex} as the primary segment color with contrasting shades for other segments. "
)
elif chart_type == "line":
points = ", ".join([f"({d['label']}, {d['value']})" for d in data])
axis_part = f" Y-axis: '{axis_label}'." if axis_label else ""
return (
f"Draw a line chart titled '{title}' in the lower-right area of the slide, "
f"taking up about 40% of the slide width. "
f"Data points: [{points}]. Mark each data point with a dot and label its value. "
f"Connect points with a smooth line in {accent_hex} color.{axis_part} "
)
elif chart_type == "table":
rows = " | ".join([f"{d['label']}: {d['value']}" for d in data])
return (
f"Draw a data table titled '{title}' in the lower portion of the slide. "
f"Data: [{rows}]. Use alternating row shading with {accent_hex} colored header row. "
f"Keep text small but legible. "
)
return ""
在阶段二中,我们定义两个主要函数:一个用于结构化幻灯片,另一个用于生成图表/示意图指令。具体包括:
structure_slides()函数:该函数使用 Gemini(不启用网络搜索)作为结构化引擎。它构建系统提示,强制模型仅返回包含恰好所需张数的有效 JSON 数组。每套幻灯片遵循固定叙事模式:标题页、多页内容页与最终总结。内容页可采用多种版式(stat、comparison、timeline、process 或 list),并严格约束:- 每条项目符号必须包含具体数值(数字、百分比或金额)
- 版式需混合使用,避免重复
- 视觉元素必须与主题相关
- 当内容天然适配图表时,包含可选的
chart_data - 随后以低温度调用
call_openrouter()获取稳定输出,去除可能的 Markdown 包裹,并将响应解析为 Python 字典以便下游使用。 _build_chart_instruction()函数:该辅助函数将 JSON 中可选的chart_data转换为 GLM-Image 的绘制指令。根据图表类型(柱状、饼图、折线或表格),它生成关于位置、标注、尺寸与配色(基于主题强调色)的清晰指导。
至此,我们已得到干净的逐页规格,既定义了叙事流程,也定义了整套幻灯片的视觉结构。
步骤 6:将幻灯片 JSON 转换为 GLM-Image 提示
本步骤将每个幻灯片对象翻译为严格约束的提示,明确告知图像模型要画什么、放在哪里、如何设定风格。
def build_glm_prompt(slide: Dict, theme: Dict, total: int, topic: str) -> str:
style = theme["style"]
colors = theme["colors"]
bg_hex = colors["bg"]
accent_hex = colors["accent"]
text_hex = colors["text"]
bg_anchor = (
f"BACKGROUND: Use a solid, uniform {bg_hex} background across the entire image. "
f"Do not add gradients, varying tones, or alternate background colors. "
f"The background must be exactly {bg_hex}. "
)
common_footer = (
f"Typography hierarchy: Headlines in bold large font, subheadings in semibold medium font, "
f"body text in regular smaller font, footnotes in small font. "
f"All text must be {text_hex} color unless it is an accent element using {accent_hex}. "
f"In the bottom-right corner, display '{slide.get('slide_number', 1)} / {total}' in small text using {text_hex} at 50% opacity. "
f"The overall design should be a single cohesive infographic slide image, "
f"high resolution, crisp text rendering, professional quality. "
f"All text in the image must be clearly legible and accurately spelled."
)
visual_elements = slide.get("visual_elements", "")
visual_elements_instruction = (
f"Include these topic-relevant visual elements as subtle icons or illustrations: {visual_elements}. "
if visual_elements else ""
)
if slide["type"] == "title":
return (
f"{bg_anchor}"
f"Create a professional infographic title slide. {style}. "
f"Display these text elements in the image:\n"
f"- Small uppercase tag at the top-center: '{slide.get('tag', 'REPORT')}'\n"
f"- Large bold headline centered in the middle of the slide: '{slide['headline']}'\n"
f"- Smaller subtitle centered below the headline: '{slide['subheadline']}'\n\n"
f"The headline should be the dominant visual element. "
f"{visual_elements_instruction}"
f"{common_footer}"
)
elif slide["type"] == "summary":
items = "\n".join(
[f" {i+1}. '{t}'" for i, t in enumerate(slide.get("takeaways", []))]
)
return (
f"{bg_anchor}"
f"Create a professional infographic summary slide. {style}. "
f"Display these text elements in the image:\n"
f"- Header at top-left: '{slide['headline']}'\n"
f"- Numbered takeaway list in the center area:\n{items}\n"
f"- Italic footer outlook at bottom-left: '{slide.get('outlook', '')}'\n\n"
f"Use numbered circles in {accent_hex} color or checkmarks for each takeaway. "
f"Make the layout clean and conclusive. "
f"{visual_elements_instruction}"
f"{common_footer}"
)
else:
layout = slide.get("layout", "stat")
chart_instruction = _build_chart_instruction(slide.get("chart_data", {}), accent_hex)
if layout == "stat":
bullets_text = "\n".join([f" • '{b}'" for b in slide.get("bullets", [])])
has_chart = bool(chart_instruction)
bullet_position = "in the left half of the slide" if has_chart else "below the statistic"
return (
f"{bg_anchor}"
f"Create a professional infographic content slide. {style}. "
f"Display these text elements in the image:\n"
f"- Section header at top-left: '{slide['headline']}'\n"
f"- One large featured statistic displayed very prominently in the center: '{slide.get('key_stat', '')}'\n"
f"- Label below the stat in smaller text: '{slide.get('key_stat_label', '')}'\n"
f"- Bullet points with data {bullet_position}:\n{bullets_text}\n"
f"- Footer at bottom: '{slide.get('bottom_note', '')}'\n\n"
f"The key statistic should be the most visually dominant element — "
f"displayed in a very large, bold font in {accent_hex} color inside a highlight box. "
f"Bullets should use small {accent_hex} colored icons or dot indicators. "
f"{chart_instruction}"
f"{visual_elements_instruction}"
f"{common_footer}"
)
elif layout == "comparison":
items = slide.get("items", [])
items_text = ""
for idx, item in enumerate(items):
label = item.get("label", f"Item {idx+1}")
points = item.get("points", [])
points_text = "\n".join([f" - '{p}'" for p in points])
col_pos = "left column" if idx == 0 else "right column"
items_text += f" [{col_pos}] '{label}':\n{points_text}\n"
return (
f"{bg_anchor}"
f"Create a professional infographic comparison slide. {style}. "
f"Display these text elements in the image:\n"
f"- Section header at top-left: '{slide['headline']}'\n"
f"- Side-by-side comparison layout with a vertical divider line in {accent_hex}:\n{items_text}"
f"- Footer at bottom: '{slide.get('bottom_note', '')}'\n\n"
f"Use a clean two-column layout. Each column header should be bold and in {accent_hex}. "
f"Bullet points under each column should have small icons. "
f"Add a 'VS' or divider element between the columns. "
f"{visual_elements_instruction}"
f"{common_footer}"
)
elif layout == "timeline":
milestones = slide.get("milestones", [])
milestones_text = "\n".join(
[f" [{m.get('date', '')}] → '{m.get('event', '')}'" for m in milestones]
)
return (
f"{bg_anchor}"
f"Create a professional infographic timeline slide. {style}. "
f"Display these text elements in the image:\n"
f"- Section header at top-left: '{slide['headline']}'\n"
f"- Horizontal timeline with these milestones connected by a line:\n{milestones_text}\n"
f"- Footer at bottom: '{slide.get('bottom_note', '')}'\n\n"
f"Draw a horizontal timeline line in {accent_hex} running across the center of the slide. "
f"Place milestone dates above the line and event descriptions below, connected by vertical dots. "
f"Each milestone dot should be a circle in {accent_hex}. "
f"{visual_elements_instruction}"
f"{common_footer}"
)
elif layout == "process":
steps = slide.get("steps", [])
steps_text = "\n".join(
[f" Step {s.get('step', idx+1)}: '{s.get('title', '')}' — {s.get('detail', '')}" for idx, s in enumerate(steps)]
)
return (
f"{bg_anchor}"
f"Create a professional infographic process flow slide. {style}. "
f"Display these text elements in the image:\n"
f"- Section header at top-left: '{slide['headline']}'\n"
f"- Process flow with numbered steps connected by arrows:\n{steps_text}\n"
f"- Footer at bottom: '{slide.get('bottom_note', '')}'\n\n"
f"Arrange steps horizontally or in a flow diagram with arrows between them. "
f"Each step should have a numbered circle in {accent_hex} with the step title in bold below it "
f"and the detail text in smaller font underneath. "
f"Connect steps with directional arrows in {accent_hex}. "
f"{visual_elements_instruction}"
f"{common_footer}"
)
else:
bullets_text = "\n".join([f" • '{b}'" for b in slide.get("bullets", [])])
has_chart = bool(chart_instruction)
bullet_position = "in the left half of the slide" if has_chart else "in the center area"
return (
f"{bg_anchor}"
f"Create a professional infographic content slide. {style}. "
f"Display these text elements in the image:\n"
f"- Section header at top-left: '{slide['headline']}'\n"
f"- Data-rich bullet points {bullet_position}:\n{bullets_text}\n"
f"- Footer at bottom: '{slide.get('bottom_note', '')}'\n\n"
f"Bullets should use small {accent_hex} colored icons or numbered indicators. "
f"Focus on clean information hierarchy and data-rich visual presentation. "
f"{chart_instruction}"
f"{visual_elements_instruction}"
f"{common_footer}"
)build_glm_prompt() 函数将单个幻灯片 JSON 对象转换为一个 GLM-Image 提示字符串,分三层执行:
- 主题与背景控制:函数提取主题的
style与配色,并应用严格的背景锚定,强制使用单一纯色背景,防止出现渐变或变化。 - 版式规则:共享的指令块强制字体层级、一致的文本颜色与渲染质量。它还添加小型页码计数
N / total,让每张图像更像整套幻灯片的一页,而非独立图片。 - 面向版式的结构:函数根据幻灯片类型调整提示:
- 标题:让主标题成为主导视觉元素,瞬间建立主题,标签与副标题提供背景与关键指标。
- 总结:将最重要洞见凝练为简洁有力的要点。
- 内容页:支持多种版式。
stat突出一个关键大数并辅以要点;comparison使用干净的双列结构;timeline与process可视化时间序列;list呈现数据密集的项目符号,并可选配图表。
若存在 chart_data,则由 _build_chart_instruction() 转换为明确的绘制指令。这样能提升可靠性,因为模型被精确告知要画什么、画在哪里。
步骤 7:使用 GLM-Image 生成图像
现在,最后一步就是将上述提示实际渲染为信息图图像。
def generate_glm_image(prompt: str, api_key: str, size: str = "1728x960") -> Optional[Image.Image]:
headers = {
"Authorization": f"Bearer {api_key}",
"Content-Type": "application/json",
}
payload = {
"model": GLM_IMAGE_MODEL,
"prompt": prompt,
"size": size,
}
try:
resp = requests.post(GLM_IMAGE_API_URL, headers=headers, json=payload, timeout=180)
resp.raise_for_status()
data = resp.json()
url = data.get("data", [{}])[0].get("url")
if not url:
st.error(f"GLM-Image returned no URL. Response: {json.dumps(data)[:300]}")
return None
img_resp = requests.get(url, timeout=60)
img_resp.raise_for_status()
return Image.open(io.BytesIO(img_resp.content)).convert("RGB")
except requests.exceptions.Timeout:
st.error("GLM-Image request timed out (180s). The model may be under heavy load.")
return None
except requests.exceptions.HTTPError as e:
st.error(f"GLM-Image HTTP error: {e} — {e.response.text[:300] if e.response else ''}")
return None
except Exception as e:
st.error(f"GLM-Image error: {e}")
return None上述函数按如下方式处理 GLM-Image 的完整图像生成流程:
generate_glm_image()是每张幻灯片的入口。它先构建请求载荷,包含glm-image模型标识、幻灯片提示(已包含版式、文本、主题与图表指令)以及目标输出分辨率,如 1728x960。- 随后使用
requests.post()将载荷发送到 Z.ai 图像生成端点,并设置更长超时时间,因为图像生成通常比文本响应更耗时。 - 请求成功后,函数从 API 响应中提取图像 URL,使用
requests.get()下载图像字节,校验响应,并将内容转换为 RGB 的PIL.Image对象。
您可以尝试不同分辨率,探索画质—延迟的权衡,并了解输出尺寸如何影响生成时长与清晰度。
步骤 8:构建 Streamlit 界面
最后,我们将把所有函数整合进 Streamlit 工作流,按序生成幻灯片、跟踪进度,并将最终幻灯片集打包供下载。
def render_theme_preview(name: str, theme: Dict):
c = theme["colors"]
return (
f'<div style="display:inline-flex;align-items:center;gap:6px;">'
f'<span style="display:inline-block;width:14px;height:14px;border-radius:3px;background:{c["bg"]};border:1px solid #555;"></span>'
f'<span style="display:inline-block;width:14px;height:14px;border-radius:3px;background:{c["accent"]};"></span>'
f'<span style="display:inline-block;width:14px;height:14px;border-radius:3px;background:{c["text"]};border:1px solid #555;"></span>'
f'<span style="">{name}</span>'
f'</div>'
)
def main():
st.set_page_config(
page_title="GLM-Image Infographic Generator",
page_icon="📊",
layout="wide",
initial_sidebar_state="expanded",
)
st.markdown("""
<style>
@import url('https://fonts.googleapis.com/css2?family=DM+Sans:wght@400;500;600;700;800&display=swap');
@import url('https://fonts.googleapis.com/css2?family=JetBrains+Mono:wght@400;600&display=swap');
.stApp {}
.hero-banner {
background: linear-gradient(135deg, #0F172A 0%, #1E293B 50%, #0F172A 100%);
border-radius: 16px;
border: 1px solid #334155;
position: relative;
overflow: hidden;
}
.hero-banner::before {
content: '';
position: absolute;
top: -50%;
right: -20%;
width: 400px;
height: 400px;
background: radial-gradient(circle, rgba(56,189,248,0.08) 0%, transparent 70%);
border-radius: 50%;
}
.hero-banner h1 {
font-weight: 800;
letter-spacing: -0.5px;
}
.hero-banner .subtitle {
font-size: 0.95rem;
}
.pipeline-tag {
display: inline-block;
background: rgba(56,189,248,0.1);
border-radius: 20px;
font-weight: 600;
letter-spacing: 0.3px;
border: 1px solid rgba(56,189,248,0.2);
}
.phase-header {
letter-spacing: 1px;
text-transform: uppercase;
}
.cost-card {
background: #1E293B;
border: 1px solid #334155;
border-radius: 10px;
}
.cost-card .total {
font-weight: 800;
}
.slide-nav-btn {
background: #1E293B;
border: 1px solid #334155;
border-radius: 8px;
cursor: pointer;
font-weight: 600;
}
#MainMenu {visibility: hidden;}
footer {visibility: hidden;}
</style>
""", unsafe_allow_html=True)
st.markdown("""
<div class="hero-banner">
<h1>GLM-Image Infographic Generator</h1>
<p class="subtitle">Enter any topic → AI researches the web → GLM-Image generates a full infographic slide deck</p>
<div class="pipeline-tag">GEMINI 2.5 FLASH and GLM-IMAGE </div>
</div>
""", unsafe_allow_html=True)
with st.sidebar:
openrouter_key = os.environ.get("OPENROUTER_API_KEY", "")
zai_key = os.environ.get("ZAI_API_KEY", "")
st.markdown("#### Visual Theme")
theme_name = st.selectbox(
"Select Theme",
list(THEMES.keys()),
index=0,
)
theme = THEMES[theme_name]
st.caption(theme["desc"])
c = theme["colors"]
st.markdown(
f'<div style="display:flex;gap:8px;">'
f'<div style="flex:1;height:32px;border-radius:6px;background:{c["bg"]};border:1px solid #555;" title="Background"></div>'
f'<div style="flex:1;height:32px;border-radius:6px;background:{c["accent"]};" title="Accent"></div>'
f'<div style="flex:1;height:32px;border-radius:6px;background:{c["text"]};border:1px solid #555;" title="Text"></div>'
f'</div>',
unsafe_allow_html=True,
)
st.markdown("#### Slide Settings")
resolution = st.selectbox("Resolution", list(RESOLUTIONS.keys()), index=0)
num_slides = st.slider("Number of Slides", 4, 10, 5)
st.divider()
if "selected_example" in st.session_state:
default_topic = st.session_state.pop("selected_example")
else:
default_topic = ""
topic = st.text_input(
"Enter a topic to research and visualize",
value=default_topic,
placeholder="e.g. AI Industry Market Trends January 2026",
)
st.markdown("**Quick examples:**")
cols = st.columns(3)
for i, ex in enumerate(EXAMPLE_TOPICS):
with cols[i % 3]:
if st.button(ex, key=f"ex_{i}", use_container_width=True):
st.session_state["selected_example"] = ex
st.rerun()
st.markdown("---")
generate = st.button(
"Generate Infographic Deck",
type="primary",
use_container_width=True,
disabled=(not topic or not openrouter_key or not zai_key),
)
if generate:
if not openrouter_key:
st.error("Please enter your **OpenRouter API Key** in the sidebar.")
st.stop()
if not zai_key:
st.error("Please enter your **Z.ai API Key** in the sidebar.")
st.stop()
size = RESOLUTIONS[resolution]
st.markdown('<div class="phase-header">Phase 1 — Research & Structure</div>', unsafe_allow_html=True)
with st.status("Researching topic with Gemini 2.5 Flash + Web Search...", expanded=True) as status:
st.markdown(f"**Topic:** {topic}")
st.markdown(f"**Model:** {OPENROUTER_MODEL}")
t0 = time.time()
try:
research = research_topic(topic, openrouter_key)
t_research = time.time() - t0
st.success(f"Research complete in {t_research:.1f}s")
status.update(label="Research complete", state="complete")
except Exception as e:
st.error(f"Research failed: {e}")
status.update(label="Research failed", state="error")
st.stop()
with st.status("Structuring slide content...", expanded=False) as status:
try:
slides_data = structure_slides(topic, research, num_slides, openrouter_key)
st.success(f"Structured {len(slides_data)} slides")
status.update(label=f"{len(slides_data)} slides structured", state="complete")
except Exception as e:
st.error(f"Structuring failed: {e}")
status.update(label="Structuring failed", state="error")
st.stop()
with st.expander("Research Summary", expanded=False):
st.markdown(research)
with st.expander("Slide JSON", expanded=False):
st.json(slides_data)
st.markdown("---")
st.markdown('<div class="phase-header">Phase 2 — GLM-Image Generation</div>', unsafe_allow_html=True)
progress = st.progress(0, text="Starting image generation...")
images: List[Optional[Image.Image]] = []
prompts: List[str] = []
timings: List[float] = []
for i, slide in enumerate(slides_data):
headline = slide.get("headline", f"Slide {i+1}")
progress.progress(
i / len(slides_data),
text=f"Generating slide {i+1}/{len(slides_data)}: {headline}",
)
prompt = build_glm_prompt(slide, theme, len(slides_data), topic)
prompts.append(prompt)
t0 = time.time()
img = generate_glm_image(prompt, zai_key, size)
elapsed = time.time() - t0
timings.append(elapsed)
images.append(img)
if img:
st.toast(f"Slide {i+1} generated ({elapsed:.1f}s)")
else:
st.toast(f"Slide {i+1} failed", icon="")
progress.progress(1.0, text="All slides generated!")
time.sleep(0.3)
progress.empty()
st.session_state["images"] = images
st.session_state["slides_data"] = slides_data
st.session_state["prompts"] = prompts
st.session_state["timings"] = timings
st.session_state["research"] = research
st.session_state["gen_topic"] = topic
st.session_state["gen_theme"] = theme_name
if "images" in st.session_state and st.session_state["images"]:
images = st.session_state["images"]
slides_data = st.session_state["slides_data"]
prompts = st.session_state.get("prompts", [])
timings = st.session_state.get("timings", [])
st.markdown("---")
gen_topic = st.session_state.get("gen_topic", "")
gen_theme = st.session_state.get("gen_theme", "")
success_count = sum(1 for img in images if img is not None)
st.markdown(
f"### Infographic Deck: *{gen_topic}*\n"
f"{success_count}/{len(images)} slides · {gen_theme} theme · "
f"{list(RESOLUTIONS.keys())[0]} resolution"
)
slide_idx = st.select_slider(
"Navigate Slides",
options=list(range(1, len(images) + 1)),
value=1,
format_func=lambda x: f"Slide {x}: {slides_data[x-1].get('headline', '') if x-1 < len(slides_data) else ''}",
)
idx = slide_idx - 1
col_img, col_meta = st.columns([3, 1])
with col_img:
if images[idx] is not None:
st.image(images[idx], use_container_width=True)
else:
st.warning(
f"Slide {slide_idx} failed to generate. "
"Check your Z.ai API key and quota."
)
with col_meta:
slide = slides_data[idx] if idx < len(slides_data) else {}
st.markdown(f"**Slide {slide_idx} / {len(images)}**")
slide_type = slide.get('type', 'N/A')
layout = slide.get('layout', '')
type_label = f"{slide_type}" + (f" · {layout}" if layout else "")
st.markdown(f"**Type:** {type_label}")
if slide.get("key_stat"):
tc = THEMES.get(gen_theme, THEMES["Corporate Navy"])["colors"]
st.markdown(
f'<div style="background:{tc["bg"]};border:2px solid {tc["accent"]}; '
f'border-radius:12px;text-align:center;">'
f'<div style="font-weight:800;color:{tc["accent"]};">'
f'{slide["key_stat"]}</div>'
f'<div style="color:{tc["text"]};opacity:0.7;">'
f'{slide.get("key_stat_label","")}</div></div>',
unsafe_allow_html=True,
)
if slide.get("bullets"):
st.markdown("**Data Points:**")
for b in slide["bullets"]:
st.markdown(f"• {b}")
if slide.get("items"):
st.markdown("**Comparison:**")
for item in slide["items"]:
st.markdown(f"**{item.get('label', '')}**")
for p in item.get("points", []):
st.markdown(f" • {p}")
if slide.get("milestones"):
st.markdown("**Timeline:**")
for m in slide["milestones"]:
st.markdown(f"• **{m.get('date', '')}** — {m.get('event', '')}")
if slide.get("steps"):
st.markdown("**Process:**")
for s in slide["steps"]:
st.markdown(f"{s.get('step', '')}. **{s.get('title', '')}** — {s.get('detail', '')}")
if slide.get("takeaways"):
st.markdown("**Takeaways:**")
for i, t in enumerate(slide["takeaways"], 1):
st.markdown(f"{i}. {t}")
if idx < len(timings):
st.caption(f"Generated in {timings[idx]:.1f}s")
if idx < len(prompts):
with st.expander(f"GLM-Image Prompt — Slide {slide_idx}"):
st.code(prompts[idx], language="text")
st.markdown("---")
st.markdown("**All Slides:**")
thumb_cols = st.columns(min(len(images), 8))
for i, img in enumerate(images):
with thumb_cols[i % len(thumb_cols)]:
if img is not None:
st.image(img, caption=f"Slide {i+1}", use_container_width=True)
else:
st.caption(f"Slide {i+1}")
st.markdown("---")
dl_col1, dl_col2, dl_col3, _ = st.columns([1, 1, 1, 1])
with dl_col1:
zip_buf = io.BytesIO()
with zipfile.ZipFile(zip_buf, "w", zipfile.ZIP_DEFLATED) as zf:
for i, img in enumerate(images):
if img is not None:
buf = io.BytesIO()
img.save(buf, format="PNG", quality=95)
zf.writestr(f"slide_{i+1:02d}.png", buf.getvalue())
zf.writestr("slide_data.json", json.dumps(slides_data, indent=2, ensure_ascii=False))
zf.writestr("prompts.json", json.dumps(prompts, indent=2, ensure_ascii=False))
safe_name = re.sub(r"[^a-zA-Z0-9]+", "_", gen_topic)[:40]
st.download_button(
"Download ZIP (all slides)",
data=zip_buf.getvalue(),
file_name=f"infographic_{safe_name}.zip",
mime="application/zip",
use_container_width=True,
)
with dl_col2:
st.download_button(
"Download Slide JSON",
data=json.dumps(slides_data, indent=2, ensure_ascii=False),
file_name=f"slides_{safe_name}.json",
mime="application/json",
use_container_width=True,
)
elif "images" not in st.session_state:
st.markdown(
'<div style="text-align:center;">'
'<div style="opacity:0.3;">📊</div>'
'<p style="max-width:500px;">'
"Enter any topic above, and the system will search the web for the latest data, "
"structure it into slides, and generate a complete infographic deck using GLM-Image."
"</p></div>",
unsafe_allow_html=True,
)
if __name__ == "__main__":
main()以上代码定义了完整的 Streamlit 应用,将流水线各阶段连接为单一工作流。
main()函数为入口,配置页面布局、应用自定义样式并渲染横幅。侧边栏作为配置面板,允许用户选择视觉主题、预览其配色、选择输出分辨率并控制幻灯片数量。这些设置将直接影响提示构建与图像生成。- 主界面收集主题输入,并提供快捷示例按钮以便快速试验。点击Generate Infographic Deck 按钮将校验主题与必需的 API 密钥是否就绪,随后开始执行。
- 执行后,工作流分两阶段运行。首先进行网络研究,并用语言模型将结果转换为结构化幻灯片 JSON,配有进度指示与可展开区块以查看研究摘要和结构化输出。随后应用使用 GLM-Image 逐页生成图像,显示进度条、单页用时与提示通知,并将图像、提示与元数据保存到
st.session_state,以便结果在重运行间持久。 - 生成完成后,界面切换为幻灯片查看器,用户可导航浏览、查看结构化内容详情、检查精确的生成提示并预览缩略图。
- 最后,应用将包括幻灯片图像、幻灯片 JSON 与提示在内的所有输出打包为可下载的 ZIP,同时提供单独的 JSON 导出选项。
若要亲自试用,将代码保存为 app.py 并启动:
Streamlit run app.py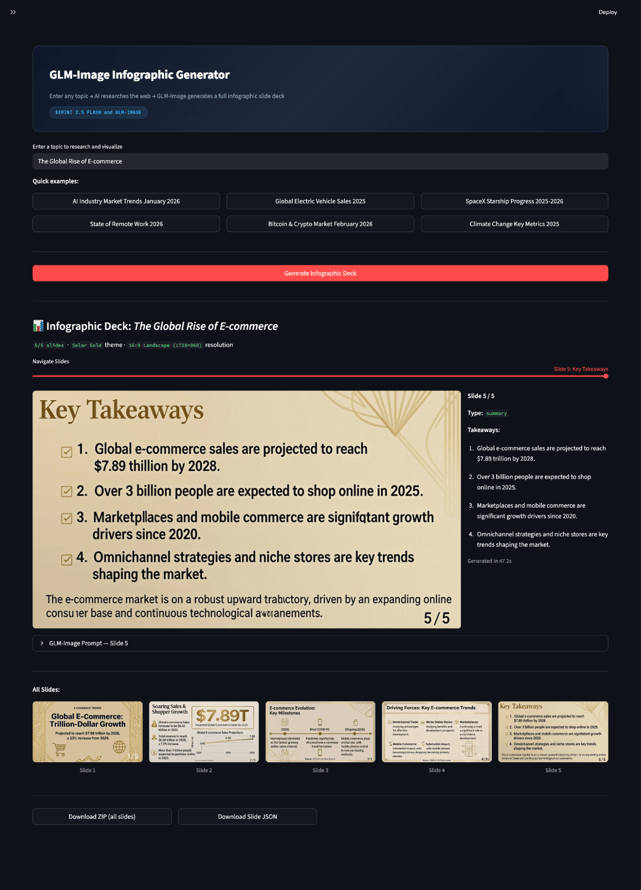
结语
在本教程中,我们构建了一个实时信息图幻灯片生成器:用户输入主题,Gemini 2.5 Flash 进行基于网络的研究并将内容结构化为幻灯片方案,GLM-Image 将每页渲染为高分辨率信息图。促成其成功的关键在于构建一条将非结构化信息转换为受约束渲染规范的流水线。
不过仍有改进空间。GLM-Image 模型偶尔会拼写错误,这在生成包含长篇、密集文本的图像时,是大多数图像生成模型的常见失效模式。
接下来,您可以通过添加引用处理、重复检查与按页重生成,将本演示升级为生产级系统。但即使在当前形态,该应用也很好地展示了如何将图像生成模型用作数据叙事的视觉渲染引擎。
别忘了查看我们关于 Google 新图像生成模型 Nano Banana 2 的指南!
GLM Image 常见问题
我需要 GPU 才能运行这个 GLM Image 项目吗?
不需要。应用完全通过 API 运行(OpenRouter 处理文本,GLM-Image 处理视觉),无需本地 GPU。具备稳定网络连接的标准机器即可。
使用 GLM Image 生成一套幻灯片要花多少钱?
成本取决于幻灯片数量与 API 使用量。对于典型运行(4–8 张),OpenRouter 与 Z.ai 的少量额度即可,通常各账户约 5 美元足以支持多次试验。
我能否使用其他文本模型替代 Gemini 2.5 Flash?
可以。由于项目使用 OpenRouter,您可以切换到其他受支持的模型,如 OpenAI、Claude 或其他 Gemini 变体。只需根据偏好的供应商与性价比更新模型名称即可。
我可以自定义幻灯片的视觉风格吗?
可以。应用包含主题选择(背景、强调与文本颜色)、分辨率设置与幻灯片数量控制。您也可以扩展主题字典或修改提示模板,创建自定义设计风格。
我可以直接使用 Gemini,而不通过 OpenRouter 吗?
可以。此处出于便捷使用了 OpenRouter,但您也可以通过 Google AI Studio 或 Vertex AI 直接调用 Gemini 2.5 Flash。只需将 OpenRouter 端点替换为官方 Gemini API,并保持相同消息结构。

我是一名 Google Developers 机器学习(生成式 AI)领域的专家、Kaggle 三项专家,以及 Women Techmakers 大使,拥有 3 年以上的技术从业经验。2020 年我共同创办了一家健康科技初创公司,目前在佐治亚理工学院攻读计算机科学硕士,专攻机器学习。
信息图与幻灯片是最难的图像生成任务之一,因为您不只是生成视觉内容,还要在保持文本与版式一致的前提下,生成标题、项目符号、图表和页脚等结构化信息。GLM-Image 是 Z.ai 的图像生成模型,在给定明确的设计约束时,能够生成高分辨率、文本密集且具版式理解的图像。
在本教程中,我将带您使用一个简洁的 Streamlit 应用,构建从提示到信息图幻灯片集的生成器。您可以输入几乎任意主题。Gemini 2.5 Flash 进行基于网络的研究以提取最新数据与趋势,LLM 将研究结果转化为严格的幻灯片 JSON 方案,而 GLM-Image 则将每一页渲染为高分辨率信息图。
最终,您将拥有一条完整的流水线,把一个提示转换为可下载的幻灯片集,无需本地 GPU,因为所有繁重计算都通过 API 完成。查看加速版演示视频了解工作流: