Lernpfad
Grundlagen von Hugging Face
12 Std.
GLM-Image is Z.ai’s text-to-image model (served via the glm-image model ID) built specifically to handle knowledge-dense, layout-sensitive generation like posters, PPT-style visuals, and science diagrams.
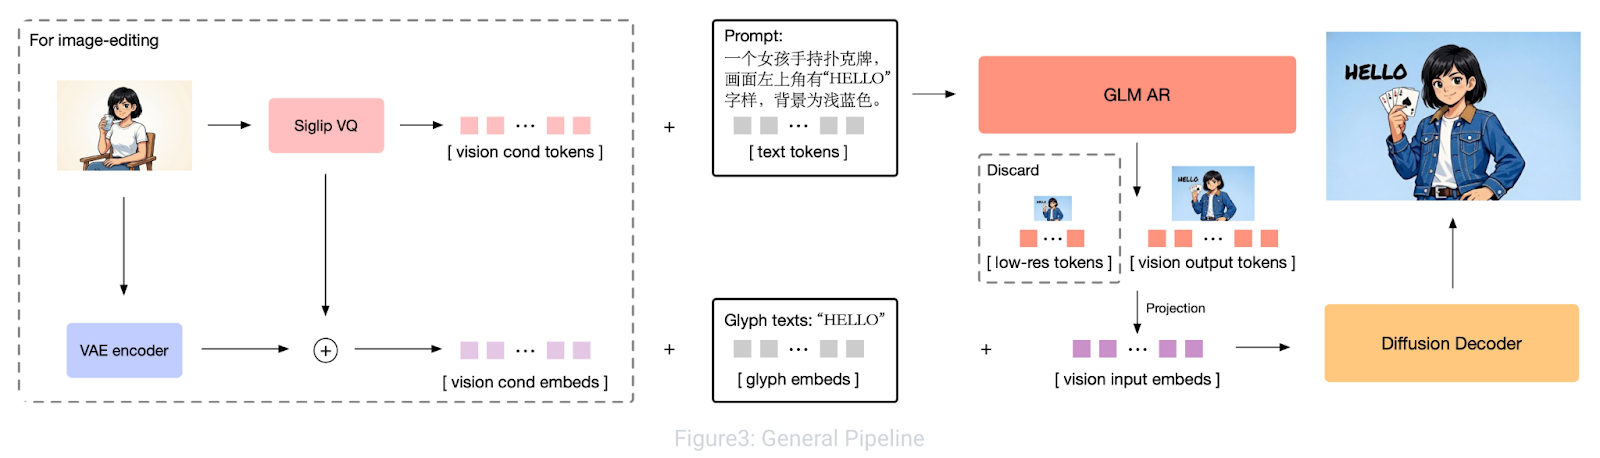
Figure: GLM-Image: Auto-regressive for Dense-knowledge and High-fidelity Image Generation
Under the hood, it uses a hybrid autoregressive and diffusion decoder design where an autoregressive backbone focuses on instruction understanding and global layout, while the diffusion decoder refines high-frequency details (including sharper text strokes). This hybrid setup is a big reason GLM-Image tends to be more reliable for text-heavy visuals than many pure diffusion generators.
In this tutorial, we use GLM-Image as the rendering engine for each slide. Instead of prompting it vaguely, we feed it a strict, layout-aware prompt that locks down:
Note: GLM-Image returns an image URL, supports common presentation aspect ratios like 16:9, and works best with recommended sizes such as 1728×960.
In this section, we’ll build a prompt-to-infographic slide deck pipeline powered by Gemini 2.5 Flash and GLM-Image, wrapped inside a Streamlit application. At a high level, the app performs three core tasks:
Behind the scenes, the workflow is driven by two key phases:
research_topic(topic) function uses Gemini 2.5 Flash with web search enabled to produce a data-rich research summary tailored to the exact topic.structure_slides() function turns that research into a JSON deck, which is then transformed into detailed GLM-Image prompts and rendered slide-by-slide.Before we build the infographic generator, we need access to two external services that power the core pipeline:
This separation is intentional. The text model handles data gathering and planning, while GLM-Image focuses entirely on visual generation.
OpenRouter acts as a unified gateway that gives you access to multiple models (Gemini, OpenAI, Claude, and others) using a single key.
In this tutorial, we use Gemini 2.5 Flash because it supports web search, allowing the app to retrieve up-to-date data and statistics instead of relying only on model training knowledge. You can substitute any other supported model if preferred.
Next, create an account on Z.ai to access the GLM Image model.
This key will be used to call the glm-imagemodel for rendering each slide.
Once both keys are created, store them as environment variables using the following commands:
export OPENROUTER_API_KEY="Your_OpenRouter_API_Key"
export ZAI_API_KEY="Your_ZAI_API_Key"
These environment variables keep credentials out of your codebase and make deployment to Streamlit Cloud, Docker, or other environments much easier.
Next, we’ll install the required dependencies and start building the Streamlit application.
pip install streamlit requests PillowOnce the packages are installed, we import the standard libraries we’ll use throughout the app, along with a few constants that define the two API endpoints.
import streamlit as st
import json
import time
import requests
import os
import io
import re
import zipfile
from datetime import date
from PIL import Image
from typing import Optional, List, Dict
OPENROUTER_API_URL = "https://openrouter.ai/api/v1/chat/completions"
OPENROUTER_MODEL = "google/gemini-2.5-flash"
GLM_IMAGE_API_URL = "https://api.z.ai/api/paas/v4/images/generations"
GLM_IMAGE_MODEL = "glm-image"
These libraries form the runtime layer of the application. Streamlit powers the interactive web interface, Requests handles API calls to OpenRouter (Gemini 2.5 Flash) and Z.ai (GLM-Image), and Pillow allows us to load and display generated images. Additional standard libraries manage JSON parsing, environment variables, timing, and exporting results as ZIP files.
We also define constants for the OpenRouter and GLM-Image endpoints so the app knows where to send research, structuring, and image generation requests. This setup keeps the environment lightweight, with all heavy computation handled through APIs.
In this step, we define a small set of resolution presets and a theme library that controls background color, accent color, typography vibe, and the infographic style phrasing we’ll inject into every GLM-Image prompt.
RESOLUTIONS = {
    "16:9 Landscape (1728×960)": "1728x960",
    "3:2 Landscape (1568×1056)": "1568x1056",
    "1:1 Square (1280×1280)": "1280x1280",
    "2:3 Portrait (1056×1568)": "1056x1568",
}
THEMES = {
    "Corporate Navy": {
        "desc": "Professional dark blue palette, clean sans-serif, data-driven",
        "colors": {"bg": "#0F172A", "accent": "#38BDF8", "text": "#F1F5F9"},
        "style": (
            "professional corporate infographic, dark navy blue (#0F172A) background, "
            "cyan (#38BDF8) accent color, clean white (#F1F5F9) text, "
            "modern sans-serif typography, clean grid layout, subtle geometric decorations, "
            "professional data visualization elements, business presentation quality"
        ),
    },
    "Neon Noir": {
        "desc": "Dark mode with vivid neon pink accents, tech-forward aesthetic",
        "colors": {"bg": "#1A1A2E", "accent": "#E94560", "text": "#EAEAEA"},
        "style": (
            "dark mode tech infographic, deep dark (#1A1A2E) background, "
            "vivid neon pink (#E94560) accent color, light gray (#EAEAEA) text, "
            "bold modern typography with sharp edges, neon glow effects, "
            "futuristic layout with geometric shapes, startup pitch deck aesthetic"
        ),
    },
    "Warm Paper": {
        "desc": "Cream textured backgrounds, burnt orange accents, editorial feel",
        "colors": {"bg": "#F8F5F0", "accent": "#D4641A", "text": "#1C1917"},
        "style": (
            "warm editorial infographic on cream (#F8F5F0) textured paper background, "
            "burnt orange (#D4641A) accent color, dark brown (#1C1917) text, "
            "elegant serif typography mixed with clean sans-serif, "
            "magazine editorial layout, hand-drawn illustration elements, "
            "warm earth tones, scholarly professional design"
        ),
    },
    "Cyber Teal": {
        "desc": "Black backgrounds, electric teal highlights, terminal-inspired",
        "colors": {"bg": "#0C0A09", "accent": "#22D3EE", "text": "#FAFAF9"},
        "style": (
            "cyberpunk infographic, black (#0C0A09) background, "
            "electric teal (#22D3EE) accent color, white (#FAFAF9) text, "
            "monospace and tech typography, terminal-inspired layout elements, "
            "circuit board patterns, data stream visuals, hacker aesthetic, "
            "sharp angular design elements"
        ),
    },
    "Indigo Dream": {
        "desc": "Deep purple base with soft violet accents, premium feel",
        "colors": {"bg": "#1E1B4B", "accent": "#A78BFA", "text": "#EDE9FE"},
        "style": (
            "premium luxury infographic, deep indigo (#1E1B4B) background, "
            "soft violet (#A78BFA) accent color, lavender (#EDE9FE) text, "
            "elegant modern typography, gradient overlays, "
            "smooth rounded shapes, glassmorphism effects, "
            "high-end presentation quality with subtle glow effects"
        ),
    },
    "Solar Gold": {
        "desc": "Warm cream with golden accents, confident and bold",
        "colors": {"bg": "#FEFCE8", "accent": "#A16207", "text": "#1C1917"},
        "style": (
            "premium golden infographic, warm cream (#FEFCE8) background, "
            "rich gold (#A16207) accent color, dark (#1C1917) text, "
            "bold confident typography, art deco inspired geometric patterns, "
            "luxury brand aesthetic, clean information hierarchy, "
            "warm highlights and gold foil style embellishments"
        ),
    },
    "Forest Green": {
        "desc": "Dark green palette, nature-inspired, calming data storytelling",
        "colors": {"bg": "#052E16", "accent": "#4ADE80", "text": "#F0FDF4"},
        "style": (
            "nature-inspired infographic, deep forest green (#052E16) background, "
            "bright green (#4ADE80) accent color, light mint (#F0FDF4) text, "
            "organic flowing typography, leaf and nature motif decorations, "
            "sustainability report aesthetic, calming visual design, "
            "clean environmental data presentation"
        ),
    },
    "Crimson Bold": {
        "desc": "High contrast red on dark, attention-grabbing poster style",
        "colors": {"bg": "#1C1917", "accent": "#EF4444", "text": "#FAFAF9"},
        "style": (
            "bold poster-style infographic, dark charcoal (#1C1917) background, "
            "vivid crimson red (#EF4444) accent color, white (#FAFAF9) text, "
            "oversized impactful numbers, bold condensed typography, "
            "high contrast design, attention-grabbing layout, "
            "social media optimized visual hierarchy"
        ),
    },
}
EXAMPLE_TOPICS = [
    "AI Industry Market Trends January 2026",
    "Global Electric Vehicle Sales 2025",
    "SpaceX Starship Progress 2025-2026",
    "State of Remote Work 2026",
    "Bitcoin & Crypto Market February 2026",
    "Climate Change Key Metrics 2025",
]
The RESOLUTIONS dictionary maps a label to the exact WxH string expected by the Z.ai image generation endpoint. The key benefit here is predictability, i.e., you can switch formats (wide slides vs square social assets vs portrait) without changing any prompt logic. The aspect ratios:
We also define THEMES where each theme is a compact design system with three parts:
desc: This includes a short UI description shown in the sidebarcolors: This comprises our strict palette (background, accent, text)style: This is the promptable style block that pushes GLM-Image toward consistent layout, typography, and decorationPractically, this theme object becomes a reusable “prompt prefix” for every slide, so the deck reads like a single product instead of 7 unrelated images.
Before we generate any slides, we need up-to-date data about the topic. Instead of relying on a model’s static knowledge, this step uses Gemini 2.5 Flash via OpenRouter with web search enabled to collect fresh statistics, timelines, and key insights.
def call_openrouter(
    messages: List[Dict],
    api_key: str,
    use_web_search: bool = False,
    temperature: float = 0.7,
    max_tokens: int = 4096,
) -> str:
    headers = {
        "Authorization": f"Bearer {api_key}",
        "Content-Type": "application/json",
        "HTTP-Referer": "https://glm-image-infographic-demo.streamlit.app",
        "X-Title": "GLM-Image Infographic Generator",
    }

    payload = {
        "model": OPENROUTER_MODEL,
        "messages": messages,
        "temperature": temperature,
        "max_tokens": max_tokens,
    }
    if use_web_search:
        today = date.today().strftime("%B %d, %Y")
        payload["plugins"] = [{
            "id": "web",
            "max_results": 10,
            "search_prompt": (
                f"Use these recent web search results (searched on {today}) to answer "
                f"with the most up-to-date information available:"
            ),
        }]

    resp = requests.post(OPENROUTER_API_URL, headers=headers, json=payload, timeout=120)
    resp.raise_for_status()
    data = resp.json()
    content = data.get("choices", [{}])[0].get("message", {}).get("content", "")
    if not content:
        raise ValueError(f"Empty response from OpenRouter: {json.dumps(data, indent=2)[:500]}")
    return content
def research_topic(topic: str, api_key: str) -> str:
    today = date.today().strftime("%B %d, %Y")  # e.g. "February 13, 2026"
    current_year = date.today().year

    messages = [
        {
            "role": "system",
            "content": (
                f"You are a focused research analyst. Today's date is {today}. "
                f"CRITICAL: You must research ONLY the specific topic provided. Do NOT include "
                f"information about unrelated topics, industries, or subjects. If web search returns "
                f"irrelevant results, ignore them completely. "
                f"Your training data may be outdated. Rely primarily on the web search results "
                f"provided to you for current data. Prioritize sources from {current_year} and "
                f"late {current_year - 1}. If a data point comes from an older source, note the year. "
                f"Compile comprehensive, data-rich research on the given topic. Include specific "
                f"numbers, percentages, dollar amounts, growth rates, timelines, and key players. "
                f"Provide data suitable for multiple visualization formats: charts, comparisons, "
                f"timelines, and processes. Be thorough but concise. Stay strictly on topic."
            ),
        },
        {
            "role": "user",
            "content": (
                f"Research ONLY this specific topic and provide a data-rich summary:\n\n"
                f"**{topic}**\n\n"
                f"CRITICAL INSTRUCTIONS:\n"
                f"1. Research EXCLUSIVELY about '{topic}' - nothing else\n"
                f"2. Ignore any web search results not directly related to '{topic}'\n"
                f"3. Do NOT include data about semiconductors, smartphones, grooming products, or other "
                f"unrelated industries unless they are directly part of '{topic}'\n"
                f"4. Search for the most recent data available as of {today}\n"
                f"5. Prefer sources published in {current_year}\n\n"
                f"For '{topic}' specifically, include:\n"
                f"- Key statistics with specific numbers, percentages, or dollar amounts\n"
                f"- Comparison data directly relevant to '{topic}'\n"
                f"- Timeline or chronological events related to '{topic}'\n"
                f"- Process or methodology descriptions relevant to '{topic}'\n"
                f"- Market sizes, growth rates, and future outlook for '{topic}'\n"
                f"- Major players/entities involved in '{topic}'\n\n"
                f"Structure the data so it can be visualized as bar charts, pie charts, "
                f"timelines, comparison tables, and process diagrams - all focused on '{topic}'."
            ),
        },
    ]
    return call_openrouter(messages, api_key, use_web_search=True, temperature=0.5)
The above code defines two key helper functions that form the research layer of the pipeline.
call_openrouter() function acts as an interface for sending chat requests to OpenRouter using the Gemini 2.5 Flash model. It constructs the request payload with the model name, messages, temperature, and token limits, and handles authentication through the API key. use_web_search=True, the function enables the web plugin and injects a search prompt so the model prioritizes the most recent information. After sending the request, it validates the response and extracts the generated text, ensuring the pipeline doesn’t proceed with empty or failed outputs.research_topic() function builds a task-specific research prompt designed for infographic generation. The prompt explicitly asks for quantitative information such as statistics, growth rates, market sizes, timelines, comparisons, and key entities, so that they can later be visualized as charts, tables, or diagrams. The function then calls call_openrouter() with a lower temperature to keep the output factual and structured rather than creative.You can experiment with parameters such as temperature, the number of web results, or the strictness of the research instructions to control the balance between breadth, recency, and precision of the collected data.
In the next step, we’ll transform this raw research into a structured slide schema (JSON) to define the layout, key metrics, and visual elements for each slide before sending them to the GLM-Image model.
Once the research is ready, the next step is to transform it into a structured blueprint that GLM-Image can render consistently. Instead of passing paragraphs, we generate a strict JSON plan where each slide specifies its layout, key text, and optional chart data.
def structure_slides(topic: str, research: str, num_slides: int, api_key: str) -> List[Dict]:
    system_prompt = f"""You create structured infographic slide decks. Return ONLY a valid JSON array with exactly {num_slides} slide objects. No markdown backticks. No explanation. Just the JSON.
SLIDE FORMATS:
Slide 1 — Title:
{{"type":"title","slide_number":1,"headline":"Bold Title (max 8 words)","subheadline":"One-liner with a key stat","tag":"CATEGORY LABEL","visual_elements":"2-3 topic-relevant decorative motifs (e.g. globe icon, circuit pattern for tech topics)"}}
Slides 2 to {num_slides-1} — Content (pick ONE layout per slide):
Layout "stat" — Use when there is one standout number to feature:
{{"type":"content","slide_number":N,"layout":"stat","headline":"Section Title (max 6 words)","key_stat":"$4.2T or +340%","key_stat_label":"What the stat means","bullets":["3-4 bullets with specific numbers"],"visual_elements":"2-3 topic-relevant icons","chart_data":{{"type":"bar|pie|line","title":"Chart title","data":[{{"label":"Category","value":"123"}}]}},"bottom_note":"Source"}}
Layout "comparison" — Use for side-by-side comparisons:
{{"type":"content","slide_number":N,"layout":"comparison","headline":"Section Title","items":[{{"label":"Item A","points":["fact 1 with number","fact 2 with number"]}},{{"label":"Item B","points":["fact 1","fact 2"]}}],"visual_elements":"topic-relevant icons","bottom_note":"Source"}}
Layout "timeline" — Use for chronological progressions:
{{"type":"content","slide_number":N,"layout":"timeline","headline":"Section Title","milestones":[{{"date":"2020","event":"Event description with metric"}},{{"date":"2023","event":"Another event"}}],"visual_elements":"topic-relevant icons","bottom_note":"Source"}}
Layout "process" — Use for step-by-step flows:
{{"type":"content","slide_number":N,"layout":"process","headline":"Section Title","steps":[{{"step":"1","title":"Step Name","detail":"Description with metric"}},{{"step":"2","title":"Next Step","detail":"Description"}}],"visual_elements":"topic-relevant icons","bottom_note":"Source"}}
Layout "list" — Use for data-rich bullets without a dominant stat:
{{"type":"content","slide_number":N,"layout":"list","headline":"Section Title","bullets":["4-5 bullets each with a specific number/metric"],"visual_elements":"topic-relevant icons","chart_data":{{"type":"bar|pie|line","title":"Chart title","data":[{{"label":"Category","value":"123"}}]}},"bottom_note":"Source"}}
Slide {num_slides} — Summary:
{{"type":"summary","slide_number":{num_slides},"headline":"Key Takeaways","takeaways":["4-5 punchy takeaway lines with data"],"outlook":"One sentence future outlook","visual_elements":"topic-relevant closing motif"}}
RULES:
- Every bullet MUST contain a specific number, percentage, or dollar amount
- Use a MIX of layouts across the deck. Do NOT use "stat" for every slide. Choose the layout that best fits the content. At most half of content slides should use "stat" layout.
- key_stat is ONLY used with "stat" layout. Other layouts do NOT have key_stat.
- visual_elements MUST be topic-specific (e.g. for EV topic: "electric car silhouette, battery icon, charging station"; for AI topic: "neural network diagram, robot icon, chip illustration"; for climate: "globe, thermometer, polar bear"). NEVER use generic shapes.
- chart_data is OPTIONAL. Include it when the slide's data naturally fits a chart. Fields:
  * type: "bar", "pie", or "line"
  * title: short chart title
  * data: array of {{"label":"...","value":"..."}} with real numbers from the research
  * axis_label: (optional) label for the value axis
  Not every slide needs chart_data. Use it for stat and list layouts when data is quantitative.
- Each slide covers a distinct aspect — no repetition
- Ensure logical narrative flow across slides"""
    messages = [
        {"role": "system", "content": system_prompt},
        {
            "role": "user",
            "content": (
                f"Create a {num_slides}-slide infographic deck about:\n\n"
                f"**{topic}**\n\n"
                f"RESEARCH DATA:\n{research}\n\n"
                f"Return ONLY the JSON array."
            ),
        },
    ]
    raw = call_openrouter(messages, api_key, use_web_search=False, temperature=0.2)
    raw = re.sub(r"^```(?:json)?\s*", "", raw.strip())
    raw = re.sub(r"\s*```$", "", raw.strip())
    return json.loads(raw)
def _build_chart_instruction(chart_data: Dict, accent_hex: str) -> str:
    if not chart_data or not chart_data.get("type"):
        return ""
    chart_type = chart_data["type"]
    title = chart_data.get("title", "Chart")
    data = chart_data.get("data", [])
    axis_label = chart_data.get("axis_label", "")
    if not data:
        return ""
    if chart_type == "bar":
        bars = ", ".join([f"'{d['label']}': {d['value']}" for d in data])
        axis_part = f" Y-axis label: '{axis_label}'." if axis_label else ""
        return (
            f"Draw a vertical bar chart titled '{title}' in the lower-right area of the slide, "
            f"taking up about 40% of the slide width. "
            f"Bars: [{bars}]. Label each bar clearly below it with its category name. "
            f"Display the value on top of each bar.{axis_part} "
            f"Use {accent_hex} color for the bars with slight shade variation between them. "
        )
    elif chart_type == "pie":
        segments = ", ".join([f"'{d['label']}': {d['value']}%" for d in data])
        return (
            f"Draw a pie chart titled '{title}' in the lower-right area of the slide, "
            f"taking up about 35% of the slide width. "
            f"Segments: [{segments}]. Label each segment with its name and percentage value. "
            f"Use {accent_hex} as the primary segment color with contrasting shades for other segments. "
        )
    elif chart_type == "line":
        points = ", ".join([f"({d['label']}, {d['value']})" for d in data])
        axis_part = f" Y-axis: '{axis_label}'." if axis_label else ""
        return (
            f"Draw a line chart titled '{title}' in the lower-right area of the slide, "
            f"taking up about 40% of the slide width. "
            f"Data points: [{points}]. Mark each data point with a dot and label its value. "
            f"Connect points with a smooth line in {accent_hex} color.{axis_part} "
        )
    elif chart_type == "table":
        rows = " | ".join([f"{d['label']}: {d['value']}" for d in data])
        return (
            f"Draw a data table titled '{title}' in the lower portion of the slide. "
            f"Data: [{rows}]. Use alternating row shading with {accent_hex} colored header row. "
            f"Keep text small but legible. "
        )
    return ""
In phase 2, we define two main functions: one to structure our slides and the other to build charts or diagram instructions. These functions include:
structure_slides() function: This function uses Gemini (without web search) as a structuring engine. It builds a system prompt that forces the model to return only a valid JSON array with exactly the requested number of slides. Each deck follows a fixed narrative pattern: a title slide, multiple content slides, and a final summary. Content slides can use different layouts such as stat, comparison, timeline, process, or list, and the prompt enforces important constraints like:chart_data is included when the content naturally fits a chartcall_openrouter() with a low temperature for stable output, removes any accidental markdown wrappers, and parses the response into a Python dictionary for downstream use._build_chart_instruction() function: This helper converts the optional chart_data from the JSON into drawing instructions for GLM-Image. Depending on the chart type (bar, pie, line, or table), it generates clear guidance on placement, labeling, sizing, and color usage based on the theme’s accent color. By the end of this step, we have a clean slide-level specification that defines both the narrative flow and the visual structure of the deck.
In this step, we translate each slide object into a highly constrained prompt that tells the image model exactly what to draw, where to place it, and how to style it.
def build_glm_prompt(slide: Dict, theme: Dict, total: int, topic: str) -> str:
    style = theme["style"]
    colors = theme["colors"]
    bg_hex = colors["bg"]
    accent_hex = colors["accent"]
    text_hex = colors["text"]
    bg_anchor = (
        f"BACKGROUND: Use a solid, uniform {bg_hex} background across the entire image. "
        f"Do not add gradients, varying tones, or alternate background colors. "
        f"The background must be exactly {bg_hex}. "
    )
    common_footer = (
        f"Typography hierarchy: Headlines in bold large font, subheadings in semibold medium font, "
        f"body text in regular smaller font, footnotes in small font. "
        f"All text must be {text_hex} color unless it is an accent element using {accent_hex}. "
        f"In the bottom-right corner, display '{slide.get('slide_number', 1)} / {total}' in small text using {text_hex} at 50% opacity. "
        f"The overall design should be a single cohesive infographic slide image, "
        f"high resolution, crisp text rendering, professional quality. "
        f"All text in the image must be clearly legible and accurately spelled."
    )
    visual_elements = slide.get("visual_elements", "")
    visual_elements_instruction = (
        f"Include these topic-relevant visual elements as subtle icons or illustrations: {visual_elements}. "
        if visual_elements else ""
    )
    if slide["type"] == "title":
        return (
            f"{bg_anchor}"
            f"Create a professional infographic title slide. {style}. "
            f"Display these text elements in the image:\n"
            f"- Small uppercase tag at the top-center: '{slide.get('tag', 'REPORT')}'\n"
            f"- Large bold headline centered in the middle of the slide: '{slide['headline']}'\n"
            f"- Smaller subtitle centered below the headline: '{slide['subheadline']}'\n\n"
            f"The headline should be the dominant visual element. "
            f"{visual_elements_instruction}"
            f"{common_footer}"
        )
    elif slide["type"] == "summary":
        items = "\n".join(
            [f"  {i+1}. '{t}'" for i, t in enumerate(slide.get("takeaways", []))]
        )
        return (
            f"{bg_anchor}"
            f"Create a professional infographic summary slide. {style}. "
            f"Display these text elements in the image:\n"
            f"- Header at top-left: '{slide['headline']}'\n"
            f"- Numbered takeaway list in the center area:\n{items}\n"
            f"- Italic footer outlook at bottom-left: '{slide.get('outlook', '')}'\n\n"
            f"Use numbered circles in {accent_hex} color or checkmarks for each takeaway. "
            f"Make the layout clean and conclusive. "
            f"{visual_elements_instruction}"
            f"{common_footer}"
        )
    else:
        layout = slide.get("layout", "stat")
        chart_instruction = _build_chart_instruction(slide.get("chart_data", {}), accent_hex)
        if layout == "stat":
            bullets_text = "\n".join([f"  • '{b}'" for b in slide.get("bullets", [])])
            has_chart = bool(chart_instruction)
            bullet_position = "in the left half of the slide" if has_chart else "below the statistic"
            return (
                f"{bg_anchor}"
                f"Create a professional infographic content slide. {style}. "
                f"Display these text elements in the image:\n"
                f"- Section header at top-left: '{slide['headline']}'\n"
                f"- One large featured statistic displayed very prominently in the center: '{slide.get('key_stat', '')}'\n"
                f"- Label below the stat in smaller text: '{slide.get('key_stat_label', '')}'\n"
                f"- Bullet points with data {bullet_position}:\n{bullets_text}\n"
                f"- Footer at bottom: '{slide.get('bottom_note', '')}'\n\n"
                f"The key statistic should be the most visually dominant element — "
                f"displayed in a very large, bold font in {accent_hex} color inside a highlight box. "
                f"Bullets should use small {accent_hex} colored icons or dot indicators. "
                f"{chart_instruction}"
                f"{visual_elements_instruction}"
                f"{common_footer}"
            )
        elif layout == "comparison":
            items = slide.get("items", [])
            items_text = ""
            for idx, item in enumerate(items):
                label = item.get("label", f"Item {idx+1}")
                points = item.get("points", [])
                points_text = "\n".join([f"    - '{p}'" for p in points])
                col_pos = "left column" if idx == 0 else "right column"
                items_text += f"  [{col_pos}] '{label}':\n{points_text}\n"
            return (
                f"{bg_anchor}"
                f"Create a professional infographic comparison slide. {style}. "
                f"Display these text elements in the image:\n"
                f"- Section header at top-left: '{slide['headline']}'\n"
                f"- Side-by-side comparison layout with a vertical divider line in {accent_hex}:\n{items_text}"
                f"- Footer at bottom: '{slide.get('bottom_note', '')}'\n\n"
                f"Use a clean two-column layout. Each column header should be bold and in {accent_hex}. "
                f"Bullet points under each column should have small icons. "
                f"Add a 'VS' or divider element between the columns. "
                f"{visual_elements_instruction}"
                f"{common_footer}"
            )
        elif layout == "timeline":
            milestones = slide.get("milestones", [])
            milestones_text = "\n".join(
                [f"  [{m.get('date', '')}] → '{m.get('event', '')}'" for m in milestones]
            )
            return (
                f"{bg_anchor}"
                f"Create a professional infographic timeline slide. {style}. "
                f"Display these text elements in the image:\n"
                f"- Section header at top-left: '{slide['headline']}'\n"
                f"- Horizontal timeline with these milestones connected by a line:\n{milestones_text}\n"
                f"- Footer at bottom: '{slide.get('bottom_note', '')}'\n\n"
                f"Draw a horizontal timeline line in {accent_hex} running across the center of the slide. "
                f"Place milestone dates above the line and event descriptions below, connected by vertical dots. "
                f"Each milestone dot should be a circle in {accent_hex}. "
                f"{visual_elements_instruction}"
                f"{common_footer}"
            )
        elif layout == "process":
            steps = slide.get("steps", [])
            steps_text = "\n".join(
                [f"  Step {s.get('step', idx+1)}: '{s.get('title', '')}' — {s.get('detail', '')}" for idx, s in enumerate(steps)]
            )
            return (
                f"{bg_anchor}"
                f"Create a professional infographic process flow slide. {style}. "
                f"Display these text elements in the image:\n"
                f"- Section header at top-left: '{slide['headline']}'\n"
                f"- Process flow with numbered steps connected by arrows:\n{steps_text}\n"
                f"- Footer at bottom: '{slide.get('bottom_note', '')}'\n\n"
                f"Arrange steps horizontally or in a flow diagram with arrows between them. "
                f"Each step should have a numbered circle in {accent_hex} with the step title in bold below it "
                f"and the detail text in smaller font underneath. "
                f"Connect steps with directional arrows in {accent_hex}. "
                f"{visual_elements_instruction}"
                f"{common_footer}"
            )
        else:
            bullets_text = "\n".join([f"  • '{b}'" for b in slide.get("bullets", [])])
            has_chart = bool(chart_instruction)
            bullet_position = "in the left half of the slide" if has_chart else "in the center area"
            return (
                f"{bg_anchor}"
                f"Create a professional infographic content slide. {style}. "
                f"Display these text elements in the image:\n"
                f"- Section header at top-left: '{slide['headline']}'\n"
                f"- Data-rich bullet points {bullet_position}:\n{bullets_text}\n"
                f"- Footer at bottom: '{slide.get('bottom_note', '')}'\n\n"
                f"Bullets should use small {accent_hex} colored icons or numbered indicators. "
                f"Focus on clean information hierarchy and data-rich visual presentation. "
                f"{chart_instruction}"
                f"{visual_elements_instruction}"
                f"{common_footer}"
            )
The build_glm_prompt() function converts one slide JSON object into one GLM-Image prompt string. It does this in three layers:
style and color palette, then applies a strict background anchor. This locks the slide to a single solid background color and prevents gradients or variation.N / total so each image feels like a page from a deck rather than a standalone graphic.stat layout highlights one large key number with supporting bullets, comparison uses a clean two-column structure, timeline and process visualize chronological events, while list presents data-rich bullet points that can optionally be paired with a chart.If chart_data is present, then the _build_chart_instruction() function converts it into explicit drawing instructions. This improves reliability because the model is told exactly what to draw and where.
Now, the final step is to actually render the above prompts into infographic images.
def generate_glm_image(prompt: str, api_key: str, size: str = "1728x960") -> Optional[Image.Image]:
    headers = {
        "Authorization": f"Bearer {api_key}",
        "Content-Type": "application/json",
    }
    payload = {
        "model": GLM_IMAGE_MODEL,
        "prompt": prompt,
        "size": size,
    }
    try:
        resp = requests.post(GLM_IMAGE_API_URL, headers=headers, json=payload, timeout=180)
        resp.raise_for_status()
        data = resp.json()
        url = data.get("data", [{}])[0].get("url")
        if not url:
            st.error(f"GLM-Image returned no URL. Response: {json.dumps(data)[:300]}")
            return None
        img_resp = requests.get(url, timeout=60)
        img_resp.raise_for_status()
        return Image.open(io.BytesIO(img_resp.content)).convert("RGB")
    except requests.exceptions.Timeout:
        st.error("GLM-Image request timed out (180s). The model may be under heavy load.")
        return None
    except requests.exceptions.HTTPError as e:
        st.error(f"GLM-Image HTTP error: {e} — {e.response.text[:300] if e.response else ''}")
        return None
    except Exception as e:
        st.error(f"GLM-Image error: {e}")
        return None
Here is how the above function handles the complete image generation workflow for GLM-Image:
generate_glm_image() function is the entry point for each slide. It first builds the request payload with the required fields like the glm-image model identifier, the slide prompt (which already contains layout, text, theme, and chart instructions), and the target output resolution, such as 1728x960. requests.post() with an extended timeout, since image generation typically takes longer than text responses.requests.get(), validates the response, and converts the content into a RGB PIL.Image object. You can experiment with different resolution values to explore the quality–latency trade-off and understand how output size impacts generation time and visual clarity.
Finally, we’ll integrate all functions into the Streamlit workflow to generate slides sequentially, track progress, and package the final deck for downloading.
def render_theme_preview(name: str, theme: Dict):
    c = theme["colors"]
    return (
        f'<div style="display:inline-flex;align-items:center;gap:6px;">'
        f'<span style="display:inline-block;width:14px;height:14px;border-radius:3px;background:{c["bg"]};border:1px solid #555;"></span>'
        f'<span style="display:inline-block;width:14px;height:14px;border-radius:3px;background:{c["accent"]};"></span>'
        f'<span style="display:inline-block;width:14px;height:14px;border-radius:3px;background:{c["text"]};border:1px solid #555;"></span>'
        f'<span style="">{name}</span>'
        f'</div>'
    )
def main():
    st.set_page_config(
        page_title="GLM-Image Infographic Generator",
        page_icon="📊",
        layout="wide",
        initial_sidebar_state="expanded",
    )
    st.markdown("""
    <style>
    @import url('https://fonts.googleapis.com/css2?family=DM+Sans:wght@400;500;600;700;800&display=swap');
    @import url('https://fonts.googleapis.com/css2?family=JetBrains+Mono:wght@400;600&display=swap');
    .stApp {}
    .hero-banner {
        background: linear-gradient(135deg, #0F172A 0%, #1E293B 50%, #0F172A 100%);

        border-radius: 16px;

        border: 1px solid #334155;
        position: relative;
        overflow: hidden;
    }
    .hero-banner::before {
        content: '';
        position: absolute;
        top: -50%;
        right: -20%;
        width: 400px;
        height: 400px;
        background: radial-gradient(circle, rgba(56,189,248,0.08) 0%, transparent 70%);
        border-radius: 50%;
    }
    .hero-banner h1 {


        font-weight: 800;

        letter-spacing: -0.5px;
    }
    .hero-banner .subtitle {

        font-size: 0.95rem;

    }
    .pipeline-tag {
        display: inline-block;

        background: rgba(56,189,248,0.1);


        border-radius: 20px;

        font-weight: 600;

        letter-spacing: 0.3px;
        border: 1px solid rgba(56,189,248,0.2);
    }
    .phase-header {


        letter-spacing: 1px;

        text-transform: uppercase;

    }
    .cost-card {
        background: #1E293B;
        border: 1px solid #334155;
        border-radius: 10px;


    }
    .cost-card .total {

        font-weight: 800;

    }
    .slide-nav-btn {
        background: #1E293B;
        border: 1px solid #334155;


        border-radius: 8px;
        cursor: pointer;
        font-weight: 600;
    }
    #MainMenu {visibility: hidden;}
    footer {visibility: hidden;}
    </style>
    """, unsafe_allow_html=True)
    st.markdown("""
    <div class="hero-banner">
        <h1>GLM-Image Infographic Generator</h1>
        <p class="subtitle">Enter any topic → AI researches the web → GLM-Image generates a full infographic slide deck</p>
        <div class="pipeline-tag">GEMINI 2.5 FLASH and GLM-IMAGE </div>
    </div>
    """, unsafe_allow_html=True)
    with st.sidebar:
        openrouter_key = os.environ.get("OPENROUTER_API_KEY", "")
        zai_key = os.environ.get("ZAI_API_KEY", "")
        st.markdown("#### Visual Theme")
        theme_name = st.selectbox(
            "Select Theme",
            list(THEMES.keys()),
            index=0,
        )
        theme = THEMES[theme_name]
        st.caption(theme["desc"])
        c = theme["colors"]
        st.markdown(
            f'<div style="display:flex;gap:8px;">'
            f'<div style="flex:1;height:32px;border-radius:6px;background:{c["bg"]};border:1px solid #555;" title="Background"></div>'
            f'<div style="flex:1;height:32px;border-radius:6px;background:{c["accent"]};" title="Accent"></div>'
            f'<div style="flex:1;height:32px;border-radius:6px;background:{c["text"]};border:1px solid #555;" title="Text"></div>'
            f'</div>',
            unsafe_allow_html=True,
        )
        st.markdown("#### Slide Settings")
        resolution = st.selectbox("Resolution", list(RESOLUTIONS.keys()), index=0)
        num_slides = st.slider("Number of Slides", 4, 10, 5)
        st.divider()
    if "selected_example" in st.session_state:
        default_topic = st.session_state.pop("selected_example")
    else:
        default_topic = ""
    topic = st.text_input(
        "Enter a topic to research and visualize",
        value=default_topic,
        placeholder="e.g. AI Industry Market Trends January 2026",
    )
    st.markdown("**Quick examples:**")
    cols = st.columns(3)
    for i, ex in enumerate(EXAMPLE_TOPICS):
        with cols[i % 3]:
            if st.button(ex, key=f"ex_{i}", use_container_width=True):
                st.session_state["selected_example"] = ex
                st.rerun()
    st.markdown("---")
    generate = st.button(
        "Generate Infographic Deck",
        type="primary",
        use_container_width=True,
        disabled=(not topic or not openrouter_key or not zai_key),
    )
    if generate:
        if not openrouter_key:
            st.error("Please enter your **OpenRouter API Key** in the sidebar.")
            st.stop()
        if not zai_key:
            st.error("Please enter your **Z.ai API Key** in the sidebar.")
            st.stop()
        size = RESOLUTIONS[resolution]
        st.markdown('<div class="phase-header">Phase 1 — Research & Structure</div>', unsafe_allow_html=True)
        with st.status("Researching topic with Gemini 2.5 Flash + Web Search...", expanded=True) as status:
            st.markdown(f"**Topic:** {topic}")
            st.markdown(f"**Model:** {OPENROUTER_MODEL}")
            t0 = time.time()
            try:
                research = research_topic(topic, openrouter_key)
                t_research = time.time() - t0
                st.success(f"Research complete in {t_research:.1f}s")
                status.update(label="Research complete", state="complete")
            except Exception as e:
                st.error(f"Research failed: {e}")
                status.update(label="Research failed", state="error")
                st.stop()
        with st.status("Structuring slide content...", expanded=False) as status:
            try:
                slides_data = structure_slides(topic, research, num_slides, openrouter_key)
                st.success(f"Structured {len(slides_data)} slides")
                status.update(label=f"{len(slides_data)} slides structured", state="complete")
            except Exception as e:
                st.error(f"Structuring failed: {e}")
                status.update(label="Structuring failed", state="error")
                st.stop()
        with st.expander("Research Summary", expanded=False):
            st.markdown(research)
        with st.expander("Slide JSON", expanded=False):
            st.json(slides_data)
        st.markdown("---")
        st.markdown('<div class="phase-header">Phase 2 — GLM-Image Generation</div>', unsafe_allow_html=True)
        progress = st.progress(0, text="Starting image generation...")
        images: List[Optional[Image.Image]] = []
        prompts: List[str] = []
        timings: List[float] = []
        for i, slide in enumerate(slides_data):
            headline = slide.get("headline", f"Slide {i+1}")
            progress.progress(
                i / len(slides_data),
                text=f"Generating slide {i+1}/{len(slides_data)}: {headline}",
            )
            prompt = build_glm_prompt(slide, theme, len(slides_data), topic)
            prompts.append(prompt)
            t0 = time.time()
            img = generate_glm_image(prompt, zai_key, size)
            elapsed = time.time() - t0
            timings.append(elapsed)
            images.append(img)
            if img:
                st.toast(f"Slide {i+1} generated ({elapsed:.1f}s)")
            else:
                st.toast(f"Slide {i+1} failed", icon="")
        progress.progress(1.0, text="All slides generated!")
        time.sleep(0.3)
        progress.empty()
        st.session_state["images"] = images
        st.session_state["slides_data"] = slides_data
        st.session_state["prompts"] = prompts
        st.session_state["timings"] = timings
        st.session_state["research"] = research
        st.session_state["gen_topic"] = topic
        st.session_state["gen_theme"] = theme_name
    if "images" in st.session_state and st.session_state["images"]:
        images = st.session_state["images"]
        slides_data = st.session_state["slides_data"]
        prompts = st.session_state.get("prompts", [])
        timings = st.session_state.get("timings", [])
        st.markdown("---")
        gen_topic = st.session_state.get("gen_topic", "")
        gen_theme = st.session_state.get("gen_theme", "")
        success_count = sum(1 for img in images if img is not None)
        st.markdown(
            f"### Infographic Deck: *{gen_topic}*\n"
            f"{success_count}/{len(images)} slides · {gen_theme} theme · "
            f"{list(RESOLUTIONS.keys())[0]} resolution"
        )
        slide_idx = st.select_slider(
            "Navigate Slides",
            options=list(range(1, len(images) + 1)),
            value=1,
            format_func=lambda x: f"Slide {x}: {slides_data[x-1].get('headline', '') if x-1 < len(slides_data) else ''}",
        )
        idx = slide_idx - 1
        col_img, col_meta = st.columns([3, 1])
        with col_img:
            if images[idx] is not None:
                st.image(images[idx], use_container_width=True)
            else:
                st.warning(
                    f"Slide {slide_idx} failed to generate. "
                    "Check your Z.ai API key and quota."
                )
        with col_meta:
            slide = slides_data[idx] if idx < len(slides_data) else {}
            st.markdown(f"**Slide {slide_idx} / {len(images)}**")
            slide_type = slide.get('type', 'N/A')
            layout = slide.get('layout', '')
            type_label = f"{slide_type}" + (f" · {layout}" if layout else "")
            st.markdown(f"**Type:** {type_label}")
            if slide.get("key_stat"):
                tc = THEMES.get(gen_theme, THEMES["Corporate Navy"])["colors"]
                st.markdown(
                    f'<div style="background:{tc["bg"]};border:2px solid {tc["accent"]}; '
                    f'border-radius:12px;text-align:center;">'
                    f'<div style="font-weight:800;color:{tc["accent"]};">'
                    f'{slide["key_stat"]}</div>'
                    f'<div style="color:{tc["text"]};opacity:0.7;">'
                    f'{slide.get("key_stat_label","")}</div></div>',
                    unsafe_allow_html=True,
                )
            if slide.get("bullets"):
                st.markdown("**Data Points:**")
                for b in slide["bullets"]:
                    st.markdown(f"• {b}")
            if slide.get("items"):
                st.markdown("**Comparison:**")
                for item in slide["items"]:
                    st.markdown(f"**{item.get('label', '')}**")
                    for p in item.get("points", []):
                        st.markdown(f"  • {p}")
            if slide.get("milestones"):
                st.markdown("**Timeline:**")
                for m in slide["milestones"]:
                    st.markdown(f"• **{m.get('date', '')}** — {m.get('event', '')}")
            if slide.get("steps"):
                st.markdown("**Process:**")
                for s in slide["steps"]:
                    st.markdown(f"{s.get('step', '')}. **{s.get('title', '')}** — {s.get('detail', '')}")
            if slide.get("takeaways"):
                st.markdown("**Takeaways:**")
                for i, t in enumerate(slide["takeaways"], 1):
                    st.markdown(f"{i}. {t}")
            if idx < len(timings):
                st.caption(f"Generated in {timings[idx]:.1f}s")
        if idx < len(prompts):
            with st.expander(f"GLM-Image Prompt — Slide {slide_idx}"):
                st.code(prompts[idx], language="text")
        st.markdown("---")
        st.markdown("**All Slides:**")
        thumb_cols = st.columns(min(len(images), 8))
        for i, img in enumerate(images):
            with thumb_cols[i % len(thumb_cols)]:
                if img is not None:
                    st.image(img, caption=f"Slide {i+1}", use_container_width=True)
                else:
                    st.caption(f"Slide {i+1}")
        st.markdown("---")
        dl_col1, dl_col2, dl_col3, _ = st.columns([1, 1, 1, 1])
        with dl_col1:
            zip_buf = io.BytesIO()
            with zipfile.ZipFile(zip_buf, "w", zipfile.ZIP_DEFLATED) as zf:
                for i, img in enumerate(images):
                    if img is not None:
                        buf = io.BytesIO()
                        img.save(buf, format="PNG", quality=95)
                        zf.writestr(f"slide_{i+1:02d}.png", buf.getvalue())
                zf.writestr("slide_data.json", json.dumps(slides_data, indent=2, ensure_ascii=False))
                zf.writestr("prompts.json", json.dumps(prompts, indent=2, ensure_ascii=False))
            safe_name = re.sub(r"[^a-zA-Z0-9]+", "_", gen_topic)[:40]
            st.download_button(
                "Download ZIP (all slides)",
                data=zip_buf.getvalue(),
                file_name=f"infographic_{safe_name}.zip",
                mime="application/zip",
                use_container_width=True,
            )
        with dl_col2:
            st.download_button(
                "Download Slide JSON",
                data=json.dumps(slides_data, indent=2, ensure_ascii=False),
                file_name=f"slides_{safe_name}.json",
                mime="application/json",
                use_container_width=True,
            )
    elif "images" not in st.session_state:
        st.markdown(
            '<div style="text-align:center;">'
            '<div style="opacity:0.3;">📊</div>'
            '<p style="max-width:500px;">'
            "Enter any topic above, and the system will search the web for the latest data, "
            "structure it into slides, and generate a complete infographic deck using GLM-Image."
            "</p></div>",
            unsafe_allow_html=True,
        )
if __name__ == "__main__":
    main()
The above code defines the complete Streamlit application that connects all stages of the pipeline into a single workflow.
main() function is the entry point that configures the page layout, applies custom styling, and renders the banner. The sidebar then acts as the configuration panel, allowing users to select a visual theme, preview its colors, choose the output resolution, and control the number of slides. These settings directly influence prompt construction and image generation.st.session_state so results persist across reruns.To try it yourself, save the code as app.py and launch:
Streamlit run app.py
In this tutorial, we built a real-time infographic deck generator where a user enters a topic, Gemini 2.5 Flash performs web-backed research and structures the content into a slide plan, and GLM-Image renders each slide as a high-resolution infographic image. The key to making this work is building a pipeline that converts unstructured information into a constrained render specification.
However, there’s still room for improvement. The GLM-Image model occasionally misspells words, which is a common failure mode for most image generation models when producing long, dense text inside images.
From here, you can turn this demo into a production-grade system by adding citation handling, repetition checks, and per-slide regeneration. But even in its current form, the app is a strong example of how image generation models can be used as visual rendering engines for data storytelling.
Make sure to check out our guide on Google's new image generation model, Nano Banana 2, as well!
Top DataCamp Courses
Lernpfad
Kurs
Kurs
Tutorial
François Aubry
Tutorial
François Aubry
Tutorial
Abid Ali Awan
Tutorial
Abid Ali Awan
Tutorial
DataCamp Team
Tutorial
DataCamp Team