

GLM Image là gì?
GLM-Image là mô hình text-to-image của Z.ai (cung cấp qua mã mô hình glm-image) được xây dựng chuyên để xử lý tạo sinh dày đặc tri thức và nhạy bố cục như poster, hình kiểu PPT, và sơ đồ khoa học.
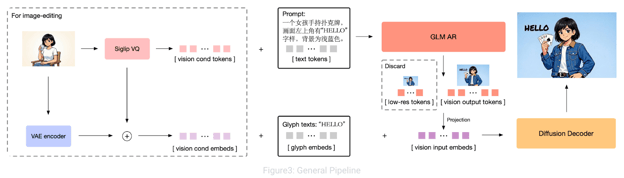
Hình: GLM-Image: Tự hồi quy cho tạo ảnh dày đặc tri thức và độ trung thực cao
Bên trong, mô hình dùng thiết kế bộ giải mã lai giữa autoregressive và diffusion, trong đó backbone autoregressive tập trung hiểu chỉ dẫn và bố cục tổng thể, còn bộ giải mã diffusion tinh chỉnh chi tiết tần số cao (bao gồm nét chữ sắc hơn). Cấu hình lai này là lý do lớn khiến GLM-Image thường đáng tin cậy hơn cho hình ảnh nhiều chữ so với nhiều bộ tạo diffusion thuần.
Trong hướng dẫn này, chúng ta dùng GLM-Image làm động cơ kết xuất cho từng slide. Thay vì prompt chung chung, ta cung cấp prompt chặt chẽ, nhận biết bố cục, khóa chặt:
- Một màu nền đặc duy nhất (không gradient),
- Ràng buộc bảng màu (nền / nhấn / chữ),
- Thang phân cấp kiểu chữ rõ ràng (tiêu đề vs nội dung vs chú thích),
- Quy tắc bố cục rõ cho từng loại slide (số liệu, so sánh, dòng thời gian, quy trình, danh sách),
- Hướng dẫn vẽ biểu đồ tùy chọn (cột / tròn / đường),
- Ghi chú chân trang và đánh số slide.
Lưu ý: GLM-Image trả về URL ảnh, hỗ trợ các tỷ lệ khung trình chiếu phổ biến như 16:9, và hoạt động tốt nhất với kích thước khuyến nghị như 1728×960.
Hướng dẫn GLM Image: Xây dựng bộ tạo Infographic thời gian thực
Phần này, ta sẽ xây dựng pipeline biến prompt thành slide infographic được hỗ trợ bởi Gemini 2.5 Flash và GLM-Image, gói trong ứng dụng Streamlit. Ở mức cao, ứng dụng thực hiện ba nhiệm vụ cốt lõi:
- Nghiên cứu chủ đề với dữ liệu web mới để deck phản ánh số liệu và xu hướng hiện tại, không phải ký ức mô hình cũ
- Chuyển nghiên cứu thành kế hoạch slide có cấu trúc gồm JSON schema nghiêm ngặt định nghĩa bố cục slide như số liệu, dòng thời gian, so sánh, quy trình và tóm tắt
- Kết xuất mỗi slide thành ảnh infographic đầy đủ bằng GLM-Image, bao gồm phân cấp kiểu chữ, màu sắc chủ đề, ràng buộc bố cục, biểu đồ tùy chọn và đánh số slide.
Ẩn sau đó, quy trình được dẫn dắt bởi hai pha chính:
- Pha 1: Hàm
research_topic(topic)dùng Gemini 2.5 Flash kèm tìm kiếm web để tạo bản tóm tắt nghiên cứu giàu dữ liệu, phù hợp chính xác chủ đề. - Pha 2: Hàm
structure_slides()biến nghiên cứu thành JSON deck, sau đó chuyển thành prompt GLM-Image chi tiết và kết xuất từng slide.
Bước 1: Lấy khóa API
Trước khi xây dựng bộ tạo infographic, ta cần truy cập hai dịch vụ bên ngoài cung cấp năng lực cốt lõi cho pipeline:
- OpenRouter cung cấp quyền truy cập Gemini 2.5 Flash, dùng để nghiên cứu có đối chiếu web và cấu trúc slide.
- Z.ai lưu trữ mô hình GLM-Image qua API và HuggingFace, dùng để tạo các slide infographic cuối cùng.
Sự tách biệt này là chủ ý. Mô hình văn bản xử lý thu thập dữ liệu và lập kế hoạch, còn GLM-Image tập trung hoàn toàn vào tạo hình ảnh.
Bước 1.1: Khóa API OpenRouter
OpenRouter hoạt động như cổng hợp nhất cho phép bạn truy cập nhiều mô hình (Gemini, OpenAI, Claude và các mô hình khác) bằng một khóa duy nhất.
- Tạo tài khoản trên OpenRouter và tạo khóa API.
- Nạp một khoản nhỏ (khoảng $5). Mức này đủ cho nhiều lượt chạy demo và thử nghiệm sau.
Trong hướng dẫn này, chúng ta dùng Gemini 2.5 Flash vì hỗ trợ tìm kiếm web, cho phép ứng dụng lấy dữ liệu và thống kê cập nhật thay vì chỉ dựa vào tri thức huấn luyện. Bạn có thể thay bằng mô hình được hỗ trợ khác nếu muốn.
Bước 1.2: Khóa API Z.ai
Tiếp theo, tạo tài khoản trên Z.ai để truy cập mô hình GLM Image.
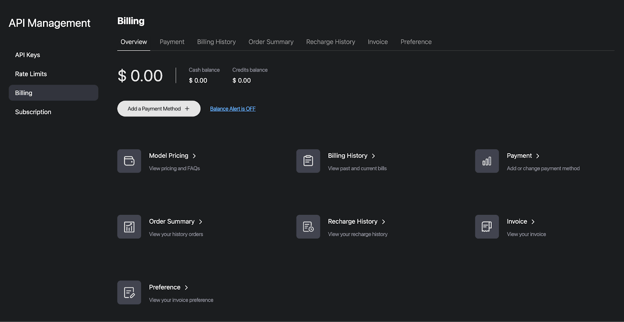
- Đi tới API Management và chọn Billing
- Nhấp Add Payment Method và nhập thông tin thẻ
- Tạo khóa API cho endpoint tạo ảnh
Khóa này sẽ dùng để gọi mô hình glm-image nhằm kết xuất từng slide.
Bước 1.3: Lưu khóa dưới dạng biến môi trường
Sau khi tạo cả hai khóa, lưu chúng thành biến môi trường bằng các lệnh sau:
export OPENROUTER_API_KEY="Your_OpenRouter_API_Key"
export ZAI_API_KEY="Your_ZAI_API_Key"Các biến môi trường giúp giữ thông tin xác thực ngoài codebase và giúp triển khai lên Streamlit Cloud, Docker hoặc môi trường khác dễ dàng hơn.
Bước 2: Cài đặt phụ thuộc
Tiếp theo, ta sẽ cài đặt các phụ thuộc cần thiết và bắt đầu xây dựng ứng dụng Streamlit.
pip install streamlit requests PillowSau khi cài xong các gói, ta import các thư viện chuẩn sẽ dùng xuyên suốt ứng dụng, cùng vài hằng số xác định hai endpoint API.
import streamlit as st
import json
import time
import requests
import os
import io
import re
import zipfile
from datetime import date
from PIL import Image
from typing import Optional, List, Dict
OPENROUTER_API_URL = "https://openrouter.ai/api/v1/chat/completions"
OPENROUTER_MODEL = "google/gemini-2.5-flash"
GLM_IMAGE_API_URL = "https://api.z.ai/api/paas/v4/images/generations"
GLM_IMAGE_MODEL = "glm-image"Các thư viện này tạo lớp runtime cho ứng dụng. Streamlit cung cấp giao diện web tương tác, Requests xử lý gọi API tới OpenRouter (Gemini 2.5 Flash) và Z.ai (GLM-Image), còn Pillow cho phép tải và hiển thị ảnh được tạo. Các thư viện chuẩn bổ sung quản lý phân tích JSON, biến môi trường, thời gian và xuất kết quả thành tệp ZIP.
Chúng ta cũng định nghĩa hằng số cho endpoint OpenRouter và GLM-Image để ứng dụng biết gửi yêu cầu nghiên cứu, cấu trúc và tạo ảnh tới đâu. Cấu hình này giữ môi trường nhẹ, mọi tính toán nặng được xử lý qua API.
Bước 3: Định nghĩa độ phân giải và chủ đề trình bày
Ở bước này, ta định nghĩa một số preset độ phân giải và thư viện chủ đề kiểm soát màu nền, màu nhấn, phong cách kiểu chữ và cụm từ mô tả phong cách infographic sẽ được chèn vào mọi prompt GLM-Image.
RESOLUTIONS = {
"16:9 Landscape (1728×960)": "1728x960",
"3:2 Landscape (1568×1056)": "1568x1056",
"1:1 Square (1280×1280)": "1280x1280",
"2:3 Portrait (1056×1568)": "1056x1568",
}
THEMES = {
"Corporate Navy": {
"desc": "Professional dark blue palette, clean sans-serif, data-driven",
"colors": {"bg": "#0F172A", "accent": "#38BDF8", "text": "#F1F5F9"},
"style": (
"professional corporate infographic, dark navy blue (#0F172A) background, "
"cyan (#38BDF8) accent color, clean white (#F1F5F9) text, "
"modern sans-serif typography, clean grid layout, subtle geometric decorations, "
"professional data visualization elements, business presentation quality"
),
},
"Neon Noir": {
"desc": "Dark mode with vivid neon pink accents, tech-forward aesthetic",
"colors": {"bg": "#1A1A2E", "accent": "#E94560", "text": "#EAEAEA"},
"style": (
"dark mode tech infographic, deep dark (#1A1A2E) background, "
"vivid neon pink (#E94560) accent color, light gray (#EAEAEA) text, "
"bold modern typography with sharp edges, neon glow effects, "
"futuristic layout with geometric shapes, startup pitch deck aesthetic"
),
},
"Warm Paper": {
"desc": "Cream textured backgrounds, burnt orange accents, editorial feel",
"colors": {"bg": "#F8F5F0", "accent": "#D4641A", "text": "#1C1917"},
"style": (
"warm editorial infographic on cream (#F8F5F0) textured paper background, "
"burnt orange (#D4641A) accent color, dark brown (#1C1917) text, "
"elegant serif typography mixed with clean sans-serif, "
"magazine editorial layout, hand-drawn illustration elements, "
"warm earth tones, scholarly professional design"
),
},
"Cyber Teal": {
"desc": "Black backgrounds, electric teal highlights, terminal-inspired",
"colors": {"bg": "#0C0A09", "accent": "#22D3EE", "text": "#FAFAF9"},
"style": (
"cyberpunk infographic, black (#0C0A09) background, "
"electric teal (#22D3EE) accent color, white (#FAFAF9) text, "
"monospace and tech typography, terminal-inspired layout elements, "
"circuit board patterns, data stream visuals, hacker aesthetic, "
"sharp angular design elements"
),
},
"Indigo Dream": {
"desc": "Deep purple base with soft violet accents, premium feel",
"colors": {"bg": "#1E1B4B", "accent": "#A78BFA", "text": "#EDE9FE"},
"style": (
"premium luxury infographic, deep indigo (#1E1B4B) background, "
"soft violet (#A78BFA) accent color, lavender (#EDE9FE) text, "
"elegant modern typography, gradient overlays, "
"smooth rounded shapes, glassmorphism effects, "
"high-end presentation quality with subtle glow effects"
),
},
"Solar Gold": {
"desc": "Warm cream with golden accents, confident and bold",
"colors": {"bg": "#FEFCE8", "accent": "#A16207", "text": "#1C1917"},
"style": (
"premium golden infographic, warm cream (#FEFCE8) background, "
"rich gold (#A16207) accent color, dark (#1C1917) text, "
"bold confident typography, art deco inspired geometric patterns, "
"luxury brand aesthetic, clean information hierarchy, "
"warm highlights and gold foil style embellishments"
),
},
"Forest Green": {
"desc": "Dark green palette, nature-inspired, calming data storytelling",
"colors": {"bg": "#052E16", "accent": "#4ADE80", "text": "#F0FDF4"},
"style": (
"nature-inspired infographic, deep forest green (#052E16) background, "
"bright green (#4ADE80) accent color, light mint (#F0FDF4) text, "
"organic flowing typography, leaf and nature motif decorations, "
"sustainability report aesthetic, calming visual design, "
"clean environmental data presentation"
),
},
"Crimson Bold": {
"desc": "High contrast red on dark, attention-grabbing poster style",
"colors": {"bg": "#1C1917", "accent": "#EF4444", "text": "#FAFAF9"},
"style": (
"bold poster-style infographic, dark charcoal (#1C1917) background, "
"vivid crimson red (#EF4444) accent color, white (#FAFAF9) text, "
"oversized impactful numbers, bold condensed typography, "
"high contrast design, attention-grabbing layout, "
"social media optimized visual hierarchy"
),
},
}
EXAMPLE_TOPICS = [
"AI Industry Market Trends January 2026",
"Global Electric Vehicle Sales 2025",
"SpaceX Starship Progress 2025-2026",
"State of Remote Work 2026",
"Bitcoin & Crypto Market February 2026",
"Climate Change Key Metrics 2025",
]Từ điển RESOLUTIONS ánh xạ nhãn tới chuỗi WxH chính xác mà endpoint tạo ảnh của Z.ai mong đợi. Lợi ích chính là tính dự đoán: bạn có thể chuyển định dạng (slide ngang rộng vs ảnh vuông mạng xã hội vs dọc) mà không cần đổi logic prompt. Tỷ lệ khung hình:
- 16:9 phù hợp nhất cho deck trình bày cổ điển và infographic kiểu thuyết trình.
- 1:1 phù hợp cho carousel kiểu LinkedIn/Twitter.
- 2:3 hữu ích cho poster infographic ưu tiên di động.
Chúng ta cũng định nghĩa THEMES trong đó mỗi chủ đề là một hệ thống thiết kế cô đọng gồm ba phần:
desc: mô tả UI ngắn hiển thị ở sidebarcolors: bảng màu nghiêm ngặt (nền, nhấn, chữ)style: khối phong cách có thể dùng trong prompt để hướng GLM-Image tới bố cục, kiểu chữ và trang trí nhất quán
Thực tiễn, đối tượng chủ đề này trở thành “tiền tố prompt” tái sử dụng cho mọi slide, giúp deck liền mạch như một sản phẩm thay vì 7 ảnh rời rạc.
Bước 4: Pha 1 - Nghiên cứu với Gemini 2.5 Flash
Trước khi tạo bất kỳ slide nào, ta cần dữ liệu cập nhật về chủ đề. Thay vì dựa vào tri thức tĩnh của mô hình, bước này dùng Gemini 2.5 Flash qua OpenRouter với tìm kiếm web bật để thu thập thống kê, dòng thời gian và insight mới.
def call_openrouter(
messages: List[Dict],
api_key: str,
use_web_search: bool = False,
temperature: float = 0.7,
max_tokens: int = 4096,
) -> str:
headers = {
"Authorization": f"Bearer {api_key}",
"Content-Type": "application/json",
"HTTP-Referer": "https://glm-image-infographic-demo.streamlit.app",
"X-Title": "GLM-Image Infographic Generator",
}
payload = {
"model": OPENROUTER_MODEL,
"messages": messages,
"temperature": temperature,
"max_tokens": max_tokens,
}
if use_web_search:
today = date.today().strftime("%B %d, %Y")
payload["plugins"] = [{
"id": "web",
"max_results": 10,
"search_prompt": (
f"Use these recent web search results (searched on {today}) to answer "
f"with the most up-to-date information available:"
),
}]
resp = requests.post(OPENROUTER_API_URL, headers=headers, json=payload, timeout=120)
resp.raise_for_status()
data = resp.json()
content = data.get("choices", [{}])[0].get("message", {}).get("content", "")
if not content:
raise ValueError(f"Empty response from OpenRouter: {json.dumps(data, indent=2)[:500]}")
return content
def research_topic(topic: str, api_key: str) -> str:
today = date.today().strftime("%B %d, %Y") # e.g. "February 13, 2026"
current_year = date.today().year
messages = [
{
"role": "system",
"content": (
f"You are a focused research analyst. Today's date is {today}. "
f"CRITICAL: You must research ONLY the specific topic provided. Do NOT include "
f"information about unrelated topics, industries, or subjects. If web search returns "
f"irrelevant results, ignore them completely. "
f"Your training data may be outdated. Rely primarily on the web search results "
f"provided to you for current data. Prioritize sources from {current_year} and "
f"late {current_year - 1}. If a data point comes from an older source, note the year. "
f"Compile comprehensive, data-rich research on the given topic. Include specific "
f"numbers, percentages, dollar amounts, growth rates, timelines, and key players. "
f"Provide data suitable for multiple visualization formats: charts, comparisons, "
f"timelines, and processes. Be thorough but concise. Stay strictly on topic."
),
},
{
"role": "user",
"content": (
f"Research ONLY this specific topic and provide a data-rich summary:\n\n"
f"**{topic}**\n\n"
f"CRITICAL INSTRUCTIONS:\n"
f"1. Research EXCLUSIVELY about '{topic}' - nothing else\n"
f"2. Ignore any web search results not directly related to '{topic}'\n"
f"3. Do NOT include data about semiconductors, smartphones, grooming products, or other "
f"unrelated industries unless they are directly part of '{topic}'\n"
f"4. Search for the most recent data available as of {today}\n"
f"5. Prefer sources published in {current_year}\n\n"
f"For '{topic}' specifically, include:\n"
f"- Key statistics with specific numbers, percentages, or dollar amounts\n"
f"- Comparison data directly relevant to '{topic}'\n"
f"- Timeline or chronological events related to '{topic}'\n"
f"- Process or methodology descriptions relevant to '{topic}'\n"
f"- Market sizes, growth rates, and future outlook for '{topic}'\n"
f"- Major players/entities involved in '{topic}'\n\n"
f"Structure the data so it can be visualized as bar charts, pie charts, "
f"timelines, comparison tables, and process diagrams - all focused on '{topic}'."
),
},
]
return call_openrouter(messages, api_key, use_web_search=True, temperature=0.5)Đoạn code trên định nghĩa hai hàm trợ giúp chính tạo lớp nghiên cứu cho pipeline.
- Hàm
call_openrouter()đóng vai trò giao diện gửi yêu cầu chat tới OpenRouter dùng mô hình Gemini 2.5 Flash. Nó tạo payload yêu cầu với tên mô hình, messages, temperature và giới hạn token, và xử lý xác thực qua khóa API. - Khi
use_web_search=True, hàm bật plugin web và chèn prompt tìm kiếm để mô hình ưu tiên thông tin mới nhất. Sau khi gửi yêu cầu, hàm xác thực phản hồi và trích xuất văn bản sinh ra, đảm bảo pipeline không tiếp tục với đầu ra rỗng hoặc lỗi. - Hàm
research_topic()xây dựng prompt nghiên cứu theo tác vụ dành cho tạo infographic. Prompt yêu cầu rõ ràng thông tin định lượng như thống kê, tốc độ tăng trưởng, quy mô thị trường, dòng thời gian, so sánh và thực thể chính, để sau này có thể trực quan hóa thành biểu đồ, bảng hoặc sơ đồ. Hàm sau đó gọicall_openrouter()với temperature thấp để đầu ra có tính thực tế và có cấu trúc hơn là sáng tạo.
Bạn có thể thử nghiệm các tham số như temperature, số kết quả web hoặc độ nghiêm ngặt của chỉ dẫn nghiên cứu để điều chỉnh cân bằng giữa độ rộng, tính cập nhật và độ chính xác của dữ liệu thu thập.
Ở bước tiếp theo, ta sẽ chuyển nghiên cứu thô này thành schema slide có cấu trúc (JSON) để định nghĩa bố cục, chỉ số chính và thành phần trực quan cho từng slide trước khi gửi tới mô hình GLM-Image.
Bước 5: Pha 2 - Chuyển nghiên cứu thành JSON slide có cấu trúc
Khi nghiên cứu đã sẵn sàng, bước tiếp theo là biến nó thành bản thiết kế có cấu trúc để GLM-Image có thể kết xuất nhất quán. Thay vì truyền các đoạn văn, ta tạo kế hoạch JSON nghiêm ngặt, trong đó mỗi slide chỉ rõ bố cục, văn bản chính và dữ liệu biểu đồ tùy chọn.
def structure_slides(topic: str, research: str, num_slides: int, api_key: str) -> List[Dict]:
system_prompt = f"""You create structured infographic slide decks. Return ONLY a valid JSON array with exactly {num_slides} slide objects. No markdown backticks. No explanation. Just the JSON.
SLIDE FORMATS:
Slide 1 — Title:
{{"type":"title","slide_number":1,"headline":"Bold Title (max 8 words)","subheadline":"One-liner with a key stat","tag":"CATEGORY LABEL","visual_elements":"2-3 topic-relevant decorative motifs (e.g. globe icon, circuit pattern for tech topics)"}}
Slides 2 to {num_slides-1} — Content (pick ONE layout per slide):
Layout "stat" — Use when there is one standout number to feature:
{{"type":"content","slide_number":N,"layout":"stat","headline":"Section Title (max 6 words)","key_stat":"$4.2T or +340%","key_stat_label":"What the stat means","bullets":["3-4 bullets with specific numbers"],"visual_elements":"2-3 topic-relevant icons","chart_data":{{"type":"bar|pie|line","title":"Chart title","data":[{{"label":"Category","value":"123"}}]}},"bottom_note":"Source"}}
Layout "comparison" — Use for side-by-side comparisons:
{{"type":"content","slide_number":N,"layout":"comparison","headline":"Section Title","items":[{{"label":"Item A","points":["fact 1 with number","fact 2 with number"]}},{{"label":"Item B","points":["fact 1","fact 2"]}}],"visual_elements":"topic-relevant icons","bottom_note":"Source"}}
Layout "timeline" — Use for chronological progressions:
{{"type":"content","slide_number":N,"layout":"timeline","headline":"Section Title","milestones":[{{"date":"2020","event":"Event description with metric"}},{{"date":"2023","event":"Another event"}}],"visual_elements":"topic-relevant icons","bottom_note":"Source"}}
Layout "process" — Use for step-by-step flows:
{{"type":"content","slide_number":N,"layout":"process","headline":"Section Title","steps":[{{"step":"1","title":"Step Name","detail":"Description with metric"}},{{"step":"2","title":"Next Step","detail":"Description"}}],"visual_elements":"topic-relevant icons","bottom_note":"Source"}}
Layout "list" — Use for data-rich bullets without a dominant stat:
{{"type":"content","slide_number":N,"layout":"list","headline":"Section Title","bullets":["4-5 bullets each with a specific number/metric"],"visual_elements":"topic-relevant icons","chart_data":{{"type":"bar|pie|line","title":"Chart title","data":[{{"label":"Category","value":"123"}}]}},"bottom_note":"Source"}}
Slide {num_slides} — Summary:
{{"type":"summary","slide_number":{num_slides},"headline":"Key Takeaways","takeaways":["4-5 punchy takeaway lines with data"],"outlook":"One sentence future outlook","visual_elements":"topic-relevant closing motif"}}
RULES:
- Every bullet MUST contain a specific number, percentage, or dollar amount
- Use a MIX of layouts across the deck. Do NOT use "stat" for every slide. Choose the layout that best fits the content. At most half of content slides should use "stat" layout.
- key_stat is ONLY used with "stat" layout. Other layouts do NOT have key_stat.
- visual_elements MUST be topic-specific (e.g. for EV topic: "electric car silhouette, battery icon, charging station"; for AI topic: "neural network diagram, robot icon, chip illustration"; for climate: "globe, thermometer, polar bear"). NEVER use generic shapes.
- chart_data is OPTIONAL. Include it when the slide's data naturally fits a chart. Fields:
* type: "bar", "pie", or "line"
* title: short chart title
* data: array of {{"label":"...","value":"..."}} with real numbers from the research
* axis_label: (optional) label for the value axis
Not every slide needs chart_data. Use it for stat and list layouts when data is quantitative.
- Each slide covers a distinct aspect — no repetition
- Ensure logical narrative flow across slides"""
messages = [
{"role": "system", "content": system_prompt},
{
"role": "user",
"content": (
f"Create a {num_slides}-slide infographic deck about:\n\n"
f"**{topic}**\n\n"
f"RESEARCH DATA:\n{research}\n\n"
f"Return ONLY the JSON array."
),
},
]
raw = call_openrouter(messages, api_key, use_web_search=False, temperature=0.2)
raw = re.sub(r"^```(?:json)?\s*", "", raw.strip())
raw = re.sub(r"\s*```$", "", raw.strip())
return json.loads(raw)
def _build_chart_instruction(chart_data: Dict, accent_hex: str) -> str:
if not chart_data or not chart_data.get("type"):
return ""
chart_type = chart_data["type"]
title = chart_data.get("title", "Chart")
data = chart_data.get("data", [])
axis_label = chart_data.get("axis_label", "")
if not data:
return ""
if chart_type == "bar":
bars = ", ".join([f"'{d['label']}': {d['value']}" for d in data])
axis_part = f" Y-axis label: '{axis_label}'." if axis_label else ""
return (
f"Draw a vertical bar chart titled '{title}' in the lower-right area of the slide, "
f"taking up about 40% of the slide width. "
f"Bars: [{bars}]. Label each bar clearly below it with its category name. "
f"Display the value on top of each bar.{axis_part} "
f"Use {accent_hex} color for the bars with slight shade variation between them. "
)
elif chart_type == "pie":
segments = ", ".join([f"'{d['label']}': {d['value']}%" for d in data])
return (
f"Draw a pie chart titled '{title}' in the lower-right area of the slide, "
f"taking up about 35% of the slide width. "
f"Segments: [{segments}]. Label each segment with its name and percentage value. "
f"Use {accent_hex} as the primary segment color with contrasting shades for other segments. "
)
elif chart_type == "line":
points = ", ".join([f"({d['label']}, {d['value']})" for d in data])
axis_part = f" Y-axis: '{axis_label}'." if axis_label else ""
return (
f"Draw a line chart titled '{title}' in the lower-right area of the slide, "
f"taking up about 40% of the slide width. "
f"Data points: [{points}]. Mark each data point with a dot and label its value. "
f"Connect points with a smooth line in {accent_hex} color.{axis_part} "
)
elif chart_type == "table":
rows = " | ".join([f"{d['label']}: {d['value']}" for d in data])
return (
f"Draw a data table titled '{title}' in the lower portion of the slide. "
f"Data: [{rows}]. Use alternating row shading with {accent_hex} colored header row. "
f"Keep text small but legible. "
)
return ""
Trong pha 2, ta định nghĩa hai hàm chính: một để cấu trúc slide và một để xây dựng hướng dẫn vẽ biểu đồ/sơ đồ. Các hàm gồm:
- Hàm
structure_slides(): Dùng Gemini (không bật tìm kiếm web) làm bộ máy cấu trúc. Nó xây dựng system prompt buộc mô hình trả về duy nhất một mảng JSON hợp lệ với đúng số lượng slide yêu cầu. Mỗi deck theo mẫu tường thuật cố định: một slide tiêu đề, nhiều slide nội dung và một slide tóm tắt. Slide nội dung có thể dùng các bố cục khác nhau như stat, comparison, timeline, process hoặc list, và prompt áp đặt các ràng buộc quan trọng như: - Mỗi gạch đầu dòng phải có số liệu cụ thể (con số, phần trăm hoặc giá trị tiền tệ)
- Pha trộn bố cục để tránh lặp lại
- Thành phần trực quan phải đặc thù theo chủ đề
chart_datatùy chọn được thêm khi nội dung tự nhiên phù hợp biểu đồ- Hàm sau đó gọi
call_openrouter()với temperature thấp để đầu ra ổn định, loại bỏ mọi bao bọc markdown vô tình, và phân tích phản hồi thành từ điển Python cho bước sau. - Hàm
_build_chart_instruction(): Trợ giúp chuyểnchart_datatùy chọn từ JSON thành hướng dẫn vẽ cho GLM-Image. Tùy loại biểu đồ (cột, tròn, đường, hoặc bảng), hàm tạo chỉ dẫn rõ ràng về vị trí, nhãn, kích thước và cách dùng màu dựa trên màu nhấn của chủ đề.
Kết thúc bước này, ta có đặc tả cấp slide rõ ràng, xác định cả dòng chảy nội dung lẫn cấu trúc thị giác của deck.
Bước 6: Chuyển JSON slide thành prompt GLM-Image
Bước này, ta dịch từng đối tượng slide thành prompt ràng buộc cao, chỉ cho mô hình ảnh biết chính xác cần vẽ gì, đặt ở đâu và phong cách ra sao.
def build_glm_prompt(slide: Dict, theme: Dict, total: int, topic: str) -> str:
style = theme["style"]
colors = theme["colors"]
bg_hex = colors["bg"]
accent_hex = colors["accent"]
text_hex = colors["text"]
bg_anchor = (
f"BACKGROUND: Use a solid, uniform {bg_hex} background across the entire image. "
f"Do not add gradients, varying tones, or alternate background colors. "
f"The background must be exactly {bg_hex}. "
)
common_footer = (
f"Typography hierarchy: Headlines in bold large font, subheadings in semibold medium font, "
f"body text in regular smaller font, footnotes in small font. "
f"All text must be {text_hex} color unless it is an accent element using {accent_hex}. "
f"In the bottom-right corner, display '{slide.get('slide_number', 1)} / {total}' in small text using {text_hex} at 50% opacity. "
f"The overall design should be a single cohesive infographic slide image, "
f"high resolution, crisp text rendering, professional quality. "
f"All text in the image must be clearly legible and accurately spelled."
)
visual_elements = slide.get("visual_elements", "")
visual_elements_instruction = (
f"Include these topic-relevant visual elements as subtle icons or illustrations: {visual_elements}. "
if visual_elements else ""
)
if slide["type"] == "title":
return (
f"{bg_anchor}"
f"Create a professional infographic title slide. {style}. "
f"Display these text elements in the image:\n"
f"- Small uppercase tag at the top-center: '{slide.get('tag', 'REPORT')}'\n"
f"- Large bold headline centered in the middle of the slide: '{slide['headline']}'\n"
f"- Smaller subtitle centered below the headline: '{slide['subheadline']}'\n\n"
f"The headline should be the dominant visual element. "
f"{visual_elements_instruction}"
f"{common_footer}"
)
elif slide["type"] == "summary":
items = "\n".join(
[f" {i+1}. '{t}'" for i, t in enumerate(slide.get("takeaways", []))]
)
return (
f"{bg_anchor}"
f"Create a professional infographic summary slide. {style}. "
f"Display these text elements in the image:\n"
f"- Header at top-left: '{slide['headline']}'\n"
f"- Numbered takeaway list in the center area:\n{items}\n"
f"- Italic footer outlook at bottom-left: '{slide.get('outlook', '')}'\n\n"
f"Use numbered circles in {accent_hex} color or checkmarks for each takeaway. "
f"Make the layout clean and conclusive. "
f"{visual_elements_instruction}"
f"{common_footer}"
)
else:
layout = slide.get("layout", "stat")
chart_instruction = _build_chart_instruction(slide.get("chart_data", {}), accent_hex)
if layout == "stat":
bullets_text = "\n".join([f" • '{b}'" for b in slide.get("bullets", [])])
has_chart = bool(chart_instruction)
bullet_position = "in the left half of the slide" if has_chart else "below the statistic"
return (
f"{bg_anchor}"
f"Create a professional infographic content slide. {style}. "
f"Display these text elements in the image:\n"
f"- Section header at top-left: '{slide['headline']}'\n"
f"- One large featured statistic displayed very prominently in the center: '{slide.get('key_stat', '')}'\n"
f"- Label below the stat in smaller text: '{slide.get('key_stat_label', '')}'\n"
f"- Bullet points with data {bullet_position}:\n{bullets_text}\n"
f"- Footer at bottom: '{slide.get('bottom_note', '')}'\n\n"
f"The key statistic should be the most visually dominant element — "
f"displayed in a very large, bold font in {accent_hex} color inside a highlight box. "
f"Bullets should use small {accent_hex} colored icons or dot indicators. "
f"{chart_instruction}"
f"{visual_elements_instruction}"
f"{common_footer}"
)
elif layout == "comparison":
items = slide.get("items", [])
items_text = ""
for idx, item in enumerate(items):
label = item.get("label", f"Item {idx+1}")
points = item.get("points", [])
points_text = "\n".join([f" - '{p}'" for p in points])
col_pos = "left column" if idx == 0 else "right column"
items_text += f" [{col_pos}] '{label}':\n{points_text}\n"
return (
f"{bg_anchor}"
f"Create a professional infographic comparison slide. {style}. "
f"Display these text elements in the image:\n"
f"- Section header at top-left: '{slide['headline']}'\n"
f"- Side-by-side comparison layout with a vertical divider line in {accent_hex}:\n{items_text}"
f"- Footer at bottom: '{slide.get('bottom_note', '')}'\n\n"
f"Use a clean two-column layout. Each column header should be bold and in {accent_hex}. "
f"Bullet points under each column should have small icons. "
f"Add a 'VS' or divider element between the columns. "
f"{visual_elements_instruction}"
f"{common_footer}"
)
elif layout == "timeline":
milestones = slide.get("milestones", [])
milestones_text = "\n".join(
[f" [{m.get('date', '')}] → '{m.get('event', '')}'" for m in milestones]
)
return (
f"{bg_anchor}"
f"Create a professional infographic timeline slide. {style}. "
f"Display these text elements in the image:\n"
f"- Section header at top-left: '{slide['headline']}'\n"
f"- Horizontal timeline with these milestones connected by a line:\n{milestones_text}\n"
f"- Footer at bottom: '{slide.get('bottom_note', '')}'\n\n"
f"Draw a horizontal timeline line in {accent_hex} running across the center of the slide. "
f"Place milestone dates above the line and event descriptions below, connected by vertical dots. "
f"Each milestone dot should be a circle in {accent_hex}. "
f"{visual_elements_instruction}"
f"{common_footer}"
)
elif layout == "process":
steps = slide.get("steps", [])
steps_text = "\n".join(
[f" Step {s.get('step', idx+1)}: '{s.get('title', '')}' — {s.get('detail', '')}" for idx, s in enumerate(steps)]
)
return (
f"{bg_anchor}"
f"Create a professional infographic process flow slide. {style}. "
f"Display these text elements in the image:\n"
f"- Section header at top-left: '{slide['headline']}'\n"
f"- Process flow with numbered steps connected by arrows:\n{steps_text}\n"
f"- Footer at bottom: '{slide.get('bottom_note', '')}'\n\n"
f"Arrange steps horizontally or in a flow diagram with arrows between them. "
f"Each step should have a numbered circle in {accent_hex} with the step title in bold below it "
f"and the detail text in smaller font underneath. "
f"Connect steps with directional arrows in {accent_hex}. "
f"{visual_elements_instruction}"
f"{common_footer}"
)
else:
bullets_text = "\n".join([f" • '{b}'" for b in slide.get("bullets", [])])
has_chart = bool(chart_instruction)
bullet_position = "in the left half of the slide" if has_chart else "in the center area"
return (
f"{bg_anchor}"
f"Create a professional infographic content slide. {style}. "
f"Display these text elements in the image:\n"
f"- Section header at top-left: '{slide['headline']}'\n"
f"- Data-rich bullet points {bullet_position}:\n{bullets_text}\n"
f"- Footer at bottom: '{slide.get('bottom_note', '')}'\n\n"
f"Bullets should use small {accent_hex} colored icons or numbered indicators. "
f"Focus on clean information hierarchy and data-rich visual presentation. "
f"{chart_instruction}"
f"{visual_elements_instruction}"
f"{common_footer}"
)Hàm build_glm_prompt() chuyển một đối tượng JSON slide thành một chuỗi prompt GLM-Image. Nó làm điều này theo ba lớp:
- Kiểm soát chủ đề và nền: Hàm lấy
stylevà bảng màu của chủ đề, rồi áp dụng chốt nền nghiêm ngặt. Điều này khóa slide vào một màu nền đặc duy nhất và ngăn gradient hay biến thiên. - Quy tắc bố cục: Một khối chỉ dẫn dùng chung áp đặt thứ bậc văn bản, màu chữ nhất quán và chất lượng kết xuất. Nó cũng thêm bộ đếm slide nhỏ
N / totalđể mỗi ảnh có cảm giác như một trang trong deck thay vì đồ họa đơn lẻ. - Cấu trúc theo bố cục: Hàm điều chỉnh prompt dựa trên loại slide:
- Tiêu đề: Tiêu đề được thiết kế là yếu tố thị giác trội, xác lập chủ đề ngay, còn nhãn và phụ đề cung cấp ngữ cảnh và chỉ số chính.
- Tóm tắt: Slide này cô đọng insight quan trọng thành các ý ngắn gọn, tác động cao.
- Slide nội dung: Hỗ trợ nhiều bố cục. Bố cục
statlàm nổi bật một con số lớn với gạch đầu dòng hỗ trợ,comparisondùng cấu trúc hai cột sạch,timelinevàprocesstrực quan hóa sự kiện theo thời gian, cònlisttrình bày các gạch đầu dòng giàu dữ liệu có thể ghép biểu đồ tùy chọn.
Nếu có chart_data, thì hàm _build_chart_instruction() chuyển nó thành hướng dẫn vẽ rõ ràng. Điều này cải thiện độ tin cậy vì mô hình được chỉ định chính xác cần vẽ gì và ở đâu.
Bước 7: Tạo ảnh bằng GLM-Image
Giờ là bước cuối: thật sự kết xuất các prompt trên thành ảnh infographic.
def generate_glm_image(prompt: str, api_key: str, size: str = "1728x960") -> Optional[Image.Image]:
headers = {
"Authorization": f"Bearer {api_key}",
"Content-Type": "application/json",
}
payload = {
"model": GLM_IMAGE_MODEL,
"prompt": prompt,
"size": size,
}
try:
resp = requests.post(GLM_IMAGE_API_URL, headers=headers, json=payload, timeout=180)
resp.raise_for_status()
data = resp.json()
url = data.get("data", [{}])[0].get("url")
if not url:
st.error(f"GLM-Image returned no URL. Response: {json.dumps(data)[:300]}")
return None
img_resp = requests.get(url, timeout=60)
img_resp.raise_for_status()
return Image.open(io.BytesIO(img_resp.content)).convert("RGB")
except requests.exceptions.Timeout:
st.error("GLM-Image request timed out (180s). The model may be under heavy load.")
return None
except requests.exceptions.HTTPError as e:
st.error(f"GLM-Image HTTP error: {e} — {e.response.text[:300] if e.response else ''}")
return None
except Exception as e:
st.error(f"GLM-Image error: {e}")
return NoneHàm trên xử lý trọn quy trình tạo ảnh với GLM-Image như sau:
- Hàm
generate_glm_image()là điểm vào cho mỗi slide. Nó xây dựng payload yêu cầu với các trường cần thiết như định danh mô hìnhglm-image, prompt slide (đã chứa hướng dẫn bố cục, văn bản, chủ đề và biểu đồ) và độ phân giải đầu ra mục tiêu, ví dụ 1728x960. - Hàm gửi payload này tới endpoint tạo ảnh của Z.ai bằng
requests.post()với timeout kéo dài, vì tạo ảnh thường lâu hơn phản hồi văn bản. - Khi yêu cầu thành công, hàm trích URL ảnh được lưu trữ từ phản hồi API, tải byte ảnh bằng
requests.get(), xác thực phản hồi và chuyển nội dung thành đối tượngPIL.ImageRGB.
Bạn có thể thử nghiệm các giá trị độ phân giải khác để khám phá đánh đổi chất lượng–độ trễ và hiểu cách kích thước đầu ra ảnh hưởng thời gian tạo và độ rõ nét.
Bước 8: Xây dựng giao diện Streamlit
Cuối cùng, ta tích hợp tất cả hàm vào quy trình Streamlit để tạo slide tuần tự, theo dõi tiến độ và đóng gói deck cuối để tải về.
def render_theme_preview(name: str, theme: Dict):
c = theme["colors"]
return (
f'<div style="display:inline-flex;align-items:center;gap:6px;">'
f'<span style="display:inline-block;width:14px;height:14px;border-radius:3px;background:{c["bg"]};border:1px solid #555;"></span>'
f'<span style="display:inline-block;width:14px;height:14px;border-radius:3px;background:{c["accent"]};"></span>'
f'<span style="display:inline-block;width:14px;height:14px;border-radius:3px;background:{c["text"]};border:1px solid #555;"></span>'
f'<span style="">{name}</span>'
f'</div>'
)
def main():
st.set_page_config(
page_title="GLM-Image Infographic Generator",
page_icon="📊",
layout="wide",
initial_sidebar_state="expanded",
)
st.markdown("""
<style>
@import url('https://fonts.googleapis.com/css2?family=DM+Sans:wght@400;500;600;700;800&display=swap');
@import url('https://fonts.googleapis.com/css2?family=JetBrains+Mono:wght@400;600&display=swap');
.stApp {}
.hero-banner {
background: linear-gradient(135deg, #0F172A 0%, #1E293B 50%, #0F172A 100%);
border-radius: 16px;
border: 1px solid #334155;
position: relative;
overflow: hidden;
}
.hero-banner::before {
content: '';
position: absolute;
top: -50%;
right: -20%;
width: 400px;
height: 400px;
background: radial-gradient(circle, rgba(56,189,248,0.08) 0%, transparent 70%);
border-radius: 50%;
}
.hero-banner h1 {
font-weight: 800;
letter-spacing: -0.5px;
}
.hero-banner .subtitle {
font-size: 0.95rem;
}
.pipeline-tag {
display: inline-block;
background: rgba(56,189,248,0.1);
border-radius: 20px;
font-weight: 600;
letter-spacing: 0.3px;
border: 1px solid rgba(56,189,248,0.2);
}
.phase-header {
letter-spacing: 1px;
text-transform: uppercase;
}
.cost-card {
background: #1E293B;
border: 1px solid #334155;
border-radius: 10px;
}
.cost-card .total {
font-weight: 800;
}
.slide-nav-btn {
background: #1E293B;
border: 1px solid #334155;
border-radius: 8px;
cursor: pointer;
font-weight: 600;
}
#MainMenu {visibility: hidden;}
footer {visibility: hidden;}
</style>
""", unsafe_allow_html=True)
st.markdown("""
<div class="hero-banner">
<h1>GLM-Image Infographic Generator</h1>
<p class="subtitle">Enter any topic → AI researches the web → GLM-Image generates a full infographic slide deck</p>
<div class="pipeline-tag">GEMINI 2.5 FLASH and GLM-IMAGE </div>
</div>
""", unsafe_allow_html=True)
with st.sidebar:
openrouter_key = os.environ.get("OPENROUTER_API_KEY", "")
zai_key = os.environ.get("ZAI_API_KEY", "")
st.markdown("#### Visual Theme")
theme_name = st.selectbox(
"Select Theme",
list(THEMES.keys()),
index=0,
)
theme = THEMES[theme_name]
st.caption(theme["desc"])
c = theme["colors"]
st.markdown(
f'<div style="display:flex;gap:8px;">'
f'<div style="flex:1;height:32px;border-radius:6px;background:{c["bg"]};border:1px solid #555;" title="Background"></div>'
f'<div style="flex:1;height:32px;border-radius:6px;background:{c["accent"]};" title="Accent"></div>'
f'<div style="flex:1;height:32px;border-radius:6px;background:{c["text"]};border:1px solid #555;" title="Text"></div>'
f'</div>',
unsafe_allow_html=True,
)
st.markdown("#### Slide Settings")
resolution = st.selectbox("Resolution", list(RESOLUTIONS.keys()), index=0)
num_slides = st.slider("Number of Slides", 4, 10, 5)
st.divider()
if "selected_example" in st.session_state:
default_topic = st.session_state.pop("selected_example")
else:
default_topic = ""
topic = st.text_input(
"Enter a topic to research and visualize",
value=default_topic,
placeholder="e.g. AI Industry Market Trends January 2026",
)
st.markdown("**Quick examples:**")
cols = st.columns(3)
for i, ex in enumerate(EXAMPLE_TOPICS):
with cols[i % 3]:
if st.button(ex, key=f"ex_{i}", use_container_width=True):
st.session_state["selected_example"] = ex
st.rerun()
st.markdown("---")
generate = st.button(
"Generate Infographic Deck",
type="primary",
use_container_width=True,
disabled=(not topic or not openrouter_key or not zai_key),
)
if generate:
if not openrouter_key:
st.error("Please enter your **OpenRouter API Key** in the sidebar.")
st.stop()
if not zai_key:
st.error("Please enter your **Z.ai API Key** in the sidebar.")
st.stop()
size = RESOLUTIONS[resolution]
st.markdown('<div class="phase-header">Phase 1 — Research & Structure</div>', unsafe_allow_html=True)
with st.status("Researching topic with Gemini 2.5 Flash + Web Search...", expanded=True) as status:
st.markdown(f"**Topic:** {topic}")
st.markdown(f"**Model:** {OPENROUTER_MODEL}")
t0 = time.time()
try:
research = research_topic(topic, openrouter_key)
t_research = time.time() - t0
st.success(f"Research complete in {t_research:.1f}s")
status.update(label="Research complete", state="complete")
except Exception as e:
st.error(f"Research failed: {e}")
status.update(label="Research failed", state="error")
st.stop()
with st.status("Structuring slide content...", expanded=False) as status:
try:
slides_data = structure_slides(topic, research, num_slides, openrouter_key)
st.success(f"Structured {len(slides_data)} slides")
status.update(label=f"{len(slides_data)} slides structured", state="complete")
except Exception as e:
st.error(f"Structuring failed: {e}")
status.update(label="Structuring failed", state="error")
st.stop()
with st.expander("Research Summary", expanded=False):
st.markdown(research)
with st.expander("Slide JSON", expanded=False):
st.json(slides_data)
st.markdown("---")
st.markdown('<div class="phase-header">Phase 2 — GLM-Image Generation</div>', unsafe_allow_html=True)
progress = st.progress(0, text="Starting image generation...")
images: List[Optional[Image.Image]] = []
prompts: List[str] = []
timings: List[float] = []
for i, slide in enumerate(slides_data):
headline = slide.get("headline", f"Slide {i+1}")
progress.progress(
i / len(slides_data),
text=f"Generating slide {i+1}/{len(slides_data)}: {headline}",
)
prompt = build_glm_prompt(slide, theme, len(slides_data), topic)
prompts.append(prompt)
t0 = time.time()
img = generate_glm_image(prompt, zai_key, size)
elapsed = time.time() - t0
timings.append(elapsed)
images.append(img)
if img:
st.toast(f"Slide {i+1} generated ({elapsed:.1f}s)")
else:
st.toast(f"Slide {i+1} failed", icon="")
progress.progress(1.0, text="All slides generated!")
time.sleep(0.3)
progress.empty()
st.session_state["images"] = images
st.session_state["slides_data"] = slides_data
st.session_state["prompts"] = prompts
st.session_state["timings"] = timings
st.session_state["research"] = research
st.session_state["gen_topic"] = topic
st.session_state["gen_theme"] = theme_name
if "images" in st.session_state and st.session_state["images"]:
images = st.session_state["images"]
slides_data = st.session_state["slides_data"]
prompts = st.session_state.get("prompts", [])
timings = st.session_state.get("timings", [])
st.markdown("---")
gen_topic = st.session_state.get("gen_topic", "")
gen_theme = st.session_state.get("gen_theme", "")
success_count = sum(1 for img in images if img is not None)
st.markdown(
f"### Infographic Deck: *{gen_topic}*\n"
f"{success_count}/{len(images)} slides · {gen_theme} theme · "
f"{list(RESOLUTIONS.keys())[0]} resolution"
)
slide_idx = st.select_slider(
"Navigate Slides",
options=list(range(1, len(images) + 1)),
value=1,
format_func=lambda x: f"Slide {x}: {slides_data[x-1].get('headline', '') if x-1 < len(slides_data) else ''}",
)
idx = slide_idx - 1
col_img, col_meta = st.columns([3, 1])
with col_img:
if images[idx] is not None:
st.image(images[idx], use_container_width=True)
else:
st.warning(
f"Slide {slide_idx} failed to generate. "
"Check your Z.ai API key and quota."
)
with col_meta:
slide = slides_data[idx] if idx < len(slides_data) else {}
st.markdown(f"**Slide {slide_idx} / {len(images)}**")
slide_type = slide.get('type', 'N/A')
layout = slide.get('layout', '')
type_label = f"{slide_type}" + (f" · {layout}" if layout else "")
st.markdown(f"**Type:** {type_label}")
if slide.get("key_stat"):
tc = THEMES.get(gen_theme, THEMES["Corporate Navy"])["colors"]
st.markdown(
f'<div style="background:{tc["bg"]};border:2px solid {tc["accent"]}; '
f'border-radius:12px;text-align:center;">'
f'<div style="font-weight:800;color:{tc["accent"]};">'
f'{slide["key_stat"]}</div>'
f'<div style="color:{tc["text"]};opacity:0.7;">'
f'{slide.get("key_stat_label","")}</div></div>',
unsafe_allow_html=True,
)
if slide.get("bullets"):
st.markdown("**Data Points:**")
for b in slide["bullets"]:
st.markdown(f"• {b}")
if slide.get("items"):
st.markdown("**Comparison:**")
for item in slide["items"]:
st.markdown(f"**{item.get('label', '')}**")
for p in item.get("points", []):
st.markdown(f" • {p}")
if slide.get("milestones"):
st.markdown("**Timeline:**")
for m in slide["milestones"]:
st.markdown(f"• **{m.get('date', '')}** — {m.get('event', '')}")
if slide.get("steps"):
st.markdown("**Process:**")
for s in slide["steps"]:
st.markdown(f"{s.get('step', '')}. **{s.get('title', '')}** — {s.get('detail', '')}")
if slide.get("takeaways"):
st.markdown("**Takeaways:**")
for i, t in enumerate(slide["takeaways"], 1):
st.markdown(f"{i}. {t}")
if idx < len(timings):
st.caption(f"Generated in {timings[idx]:.1f}s")
if idx < len(prompts):
with st.expander(f"GLM-Image Prompt — Slide {slide_idx}"):
st.code(prompts[idx], language="text")
st.markdown("---")
st.markdown("**All Slides:**")
thumb_cols = st.columns(min(len(images), 8))
for i, img in enumerate(images):
with thumb_cols[i % len(thumb_cols)]:
if img is not None:
st.image(img, caption=f"Slide {i+1}", use_container_width=True)
else:
st.caption(f"Slide {i+1}")
st.markdown("---")
dl_col1, dl_col2, dl_col3, _ = st.columns([1, 1, 1, 1])
with dl_col1:
zip_buf = io.BytesIO()
with zipfile.ZipFile(zip_buf, "w", zipfile.ZIP_DEFLATED) as zf:
for i, img in enumerate(images):
if img is not None:
buf = io.BytesIO()
img.save(buf, format="PNG", quality=95)
zf.writestr(f"slide_{i+1:02d}.png", buf.getvalue())
zf.writestr("slide_data.json", json.dumps(slides_data, indent=2, ensure_ascii=False))
zf.writestr("prompts.json", json.dumps(prompts, indent=2, ensure_ascii=False))
safe_name = re.sub(r"[^a-zA-Z0-9]+", "_", gen_topic)[:40]
st.download_button(
"Download ZIP (all slides)",
data=zip_buf.getvalue(),
file_name=f"infographic_{safe_name}.zip",
mime="application/zip",
use_container_width=True,
)
with dl_col2:
st.download_button(
"Download Slide JSON",
data=json.dumps(slides_data, indent=2, ensure_ascii=False),
file_name=f"slides_{safe_name}.json",
mime="application/json",
use_container_width=True,
)
elif "images" not in st.session_state:
st.markdown(
'<div style="text-align:center;">'
'<div style="opacity:0.3;">📊</div>'
'<p style="max-width:500px;">'
"Enter any topic above, and the system will search the web for the latest data, "
"structure it into slides, and generate a complete infographic deck using GLM-Image."
"</p></div>",
unsafe_allow_html=True,
)
if __name__ == "__main__":
main()Đoạn code trên định nghĩa toàn bộ ứng dụng Streamlit kết nối mọi giai đoạn của pipeline thành một quy trình duy nhất.
- Hàm
main()là điểm vào cấu hình bố cục trang, áp dụng kiểu tùy chỉnh và hiển thị banner. Sidebar đóng vai trò bảng cấu hình, cho phép người dùng chọn chủ đề hình ảnh, xem trước màu sắc, chọn độ phân giải đầu ra và số lượng slide. Các thiết lập này tác động trực tiếp đến việc tạo prompt và tạo ảnh. - Giao diện chính nhận đầu vào chủ đề và cung cấp các nút ví dụ nhanh để thử nghiệm nhanh hơn. Nút Generate Infographic Deck xác thực chủ đề và khóa API cần thiết trước khi bắt đầu thực thi.
- Khi kích hoạt, quy trình chạy theo hai pha. Trước tiên, hệ thống thực hiện nghiên cứu web và chuyển kết quả thành JSON slide có cấu trúc bằng mô hình ngôn ngữ, với chỉ báo tiến độ và phần có thể bung ra để xem bản tóm tắt nghiên cứu và đầu ra có cấu trúc. Tiếp theo, ứng dụng tạo ảnh tuần tự bằng GLM-Image, hiển thị thanh tiến trình, thời gian từng slide và thông báo nhanh, đồng thời lưu ảnh, prompt và siêu dữ liệu vào
st.session_stateđể kết quả tồn tại qua các lần chạy lại. - Sau khi tạo xong, giao diện chuyển sang chế độ xem deck nơi người dùng có thể điều hướng slide, xem chi tiết nội dung có cấu trúc, kiểm tra chính xác prompt đã dùng và xem trước ảnh thu nhỏ.
- Cuối cùng, ứng dụng đóng gói toàn bộ đầu ra, gồm ảnh slide, JSON slide và prompt, thành ZIP để tải về, kèm tùy chọn xuất JSON riêng.
Để tự thử, lưu code thành app.py và chạy:
Streamlit run app.py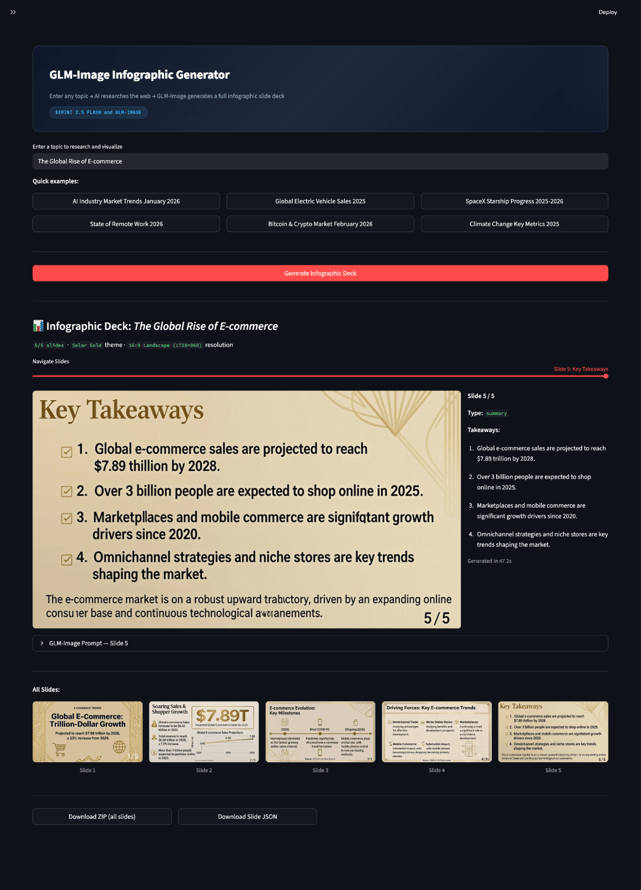
Kết luận
Trong hướng dẫn này, chúng ta đã xây dựng một bộ tạo infographic deck thời gian thực: người dùng nhập chủ đề, Gemini 2.5 Flash thực hiện nghiên cứu có đối chiếu web và cấu trúc nội dung thành kế hoạch slide, còn GLM-Image kết xuất mỗi slide thành ảnh infographic độ phân giải cao. Chìa khóa là xây dựng pipeline chuyển thông tin rời rạc thành đặc tả kết xuất có ràng buộc.
Tuy nhiên, vẫn còn chỗ cải thiện. Mô hình GLM-Image đôi khi đánh vần sai, là kiểu lỗi thường gặp ở hầu hết mô hình tạo ảnh khi phải tạo văn bản dài, dày đặc trong ảnh.
Từ đây, bạn có thể biến demo này thành hệ thống cấp sản xuất bằng cách thêm xử lý trích dẫn, kiểm tra lặp và tái tạo từng slide. Nhưng ngay ở dạng hiện tại, ứng dụng vẫn là ví dụ điển hình về cách dùng mô hình tạo ảnh như động cơ kết xuất trực quan cho kể chuyện bằng dữ liệu.
Đừng quên xem hướng dẫn về mô hình tạo ảnh mới của Google, Nano Banana 2!
Câu hỏi thường gặp về GLM Image
Tôi có cần GPU để chạy dự án GLM Image này không?
Không. Ứng dụng chạy hoàn toàn qua API (OpenRouter cho văn bản và GLM-Image cho hình ảnh), nên không cần GPU cục bộ. Một máy tiêu chuẩn với kết nối internet ổn định là đủ.
Tạo một deck bằng GLM Image tốn bao nhiêu?
Chi phí phụ thuộc vào số slide và mức dùng API. Với lượt chạy điển hình (4–8 slide), vài đô trên OpenRouter và Z.ai thường là đủ. Khoảng $5 ở mỗi tài khoản là đủ cho nhiều lần thử nghiệm.
Tôi có thể dùng mô hình văn bản khác thay Gemini 2.5 Flash không?
Vì dự án dùng OpenRouter, bạn có thể chuyển sang các mô hình được hỗ trợ khác như OpenAI, Claude hoặc biến thể Gemini khác. Chỉ cần cập nhật tên mô hình theo nhà cung cấp ưa thích và nhu cầu chi phí/hiệu năng.
Tôi có thể tùy biến phong cách hình ảnh của các slide không?
Có. Ứng dụng có lựa chọn chủ đề (màu nền, nhấn, chữ), cài đặt độ phân giải và số lượng slide. Bạn cũng có thể mở rộng từ điển chủ đề hoặc chỉnh mẫu prompt để tạo phong cách thiết kế tùy biến.
Tôi có thể dùng trực tiếp Gemini thay vì OpenRouter không?
Có. OpenRouter được dùng cho thuận tiện, nhưng bạn có thể gọi Gemini 2.5 Flash trực tiếp bằng Google AI Studio hoặc Vertex AI. Chỉ cần thay endpoint OpenRouter bằng API chính thức của Gemini và giữ nguyên cấu trúc message.

Tôi là Chuyên gia Google Developers trong lĩnh vực ML (Gen AI), Chuyên gia Kaggle 3x và Đại sứ Women Techmakers với hơn 3 năm kinh nghiệm trong ngành công nghệ. Tôi đồng sáng lập một startup công nghệ y tế vào năm 2020 và hiện đang theo học thạc sĩ khoa học máy tính tại Georgia Tech, chuyên sâu về học máy.


Infographic và slide deck là một trong những tác vụ tạo ảnh khó nhất vì bạn không chỉ tạo hình ảnh mà còn tạo thông tin có cấu trúc như tiêu đề, gạch đầu dòng, biểu đồ và chân trang, đồng thời phải giữ văn bản và bố cục nhất quán. GLM-Image là mô hình tạo ảnh của Z.ai có thể tạo ảnh độ phân giải cao, nhiều chữ, nhận biết bố cục khi được cung cấp các ràng buộc thiết kế rõ ràng.
Trong hướng dẫn này, tôi sẽ chỉ bạn cách xây dựng một bộ tạo infographic deck từ prompt bằng ứng dụng Streamlit đơn giản. Bạn có thể nhập hầu như mọi chủ đề. Gemini 2.5 Flash thực hiện nghiên cứu có đối chiếu web để lấy số liệu và xu hướng mới, LLM chuyển nghiên cứu đó thành JSON slide tuân thủ chặt chẽ, và GLM-Image kết xuất từng slide thành infographic độ phân giải cao.
Kết thúc, bạn sẽ có một pipeline hoàn chỉnh biến một prompt thành một deck có thể tải về, không cần GPU, vì mọi xử lý nặng đều qua API. Xem video tua nhanh minh họa quy trình làm việc: