Curso
Os analistas de dados geralmente precisam mostrar diferentes tipos de dados no mesmo gráfico para compará-los e revelar tendências e padrões ocultos. Neste tutorial, exploraremos um tipo especial de gráfico que é perfeito para esses casos, chamado gráficos combinados. Exploraremos seus recursos, tipos, usos, criação, formatação e pontos fortes e fracos.
Se você quiser aprender ou aperfeiçoar os conceitos básicos do Excel antes de começarmos, nosso curso abrangente de Introdução ao Excel é uma companhia útil.
O que é um gráfico de combinação?
Um gráfico combinado, também conhecido como gráfico de combinação, refere-se a gráficos que combinam dois ou mais tipos de gráficos, como gráficos de linha, de barras ou de área, em um único visual. Na maioria das vezes, um gráfico combinado exibe uma evolução de diferentes tipos de dados no mesmo período, o que torna esse tipo de visualização particularmente útil para identificar discrepâncias, tendências, tendências e padrões essenciais.
Principais recursos de um gráfico de combinação
O que distingue um gráfico de combinação? Embora alguns de seus recursos possam ser facilmente visíveis, outros são mais sutis. Vamos nos aprofundar em suas principais características.
- Vários tipos de gráficos em um único visual: A característica que define um gráfico combinado é a inclusão de mais de um tipo de gráfico (diferente) no mesmo visual, como a combinação de um gráfico de linhas com um gráfico de barras.
- Várias séries de dados: Os gráficos combinados exibem várias séries de dados na legenda do gráfico e ao interagir com a área do gráfico, de forma semelhante aos gráficos de barras empilhadas e aos gráficos de várias linhas.
- Eixo secundário: Os gráficos combinados geralmente apresentam um eixo secundário para diferentes séries de dados com escalas variadas, o que também é comum em gráficos multilinhas.
- Diferenciação por cores e rótulos: As séries de dados nos gráficos combinados são facilmente distinguíveis por cores, transparências ou rótulos de dados diferentes, um recurso compartilhado com outros gráficos, como os de barras empilhadas e os de área.
Para explorar rapidamente as várias opções de visualização de dados do Excel que podem ajudar você a analisar e interpretar seus dados, fique à vontade para consultar este tutorial: Visualização de dados no Excel.
Por que criar um gráfico de combinação no Excel?
Os gráficos combinados oferecem muitas vantagens e são muito úteis por vários motivos. Nesta seção, descreveremos os principais motivos a favor da criação de gráficos combinados no Excel.
- Comparação de diferentes séries de dados: Um gráfico combinado nos permite rastrear a evolução de várias séries de dados simultaneamente. Diferentes tipos de gráficos em um mesmo visual facilitam comparações eficazes, como um gráfico de linhas para alterações de preços e um gráfico de barras para vendas de produtos.
- Destacando tendências e padrões específicos: Os gráficos combinados ajudam a capturar as principais tendências e padrões, comparando várias séries de dados. Esses insights são mais informados e, às vezes, exclusivos dos gráficos combinados, pois não podem ser vistos em gráficos de tipos de dados únicos.
- Aprimoramento da apresentação de dados: Os gráficos combinados melhoram a relação entre dados e tinta, o que resulta em visualizações mais claras e eficazes por meio da redução de elementos desnecessários. Eles combinam vários tipos de gráficos em um único visual, maximizando as informações em uma única exibição e utilizando os recursos do Excel para melhorar a aparência e a legibilidade.
- Aprimorando a tomada de decisões: A visão abrangente fornecida pelos gráficos combinados dá suporte a decisões bem fundamentadas e baseadas em dados. Isso ajuda a planejar estratégias de negócios sólidas e oferece uma visão mais ampla das futuras mudanças no mercado.
Combinações populares de gráficos
Vamos ver agora que tipos de gráficos você pode combinar em um gráfico combinado. Usaremos um conjunto de dados do Kaggle disponível publicamente, Lamborghini Sales and Stocks. Por enquanto, não estamos interessados no significado real e nos valores reais da série de dados. Em vez disso, estamos praticando a criação de diferentes combinações de tipos de gráficos.
Gráfico de linhas + gráfico de barras
A combinação de um gráfico de linhas com um gráfico de barras é excelente para mostrar uma tendência juntamente com valores individuais.
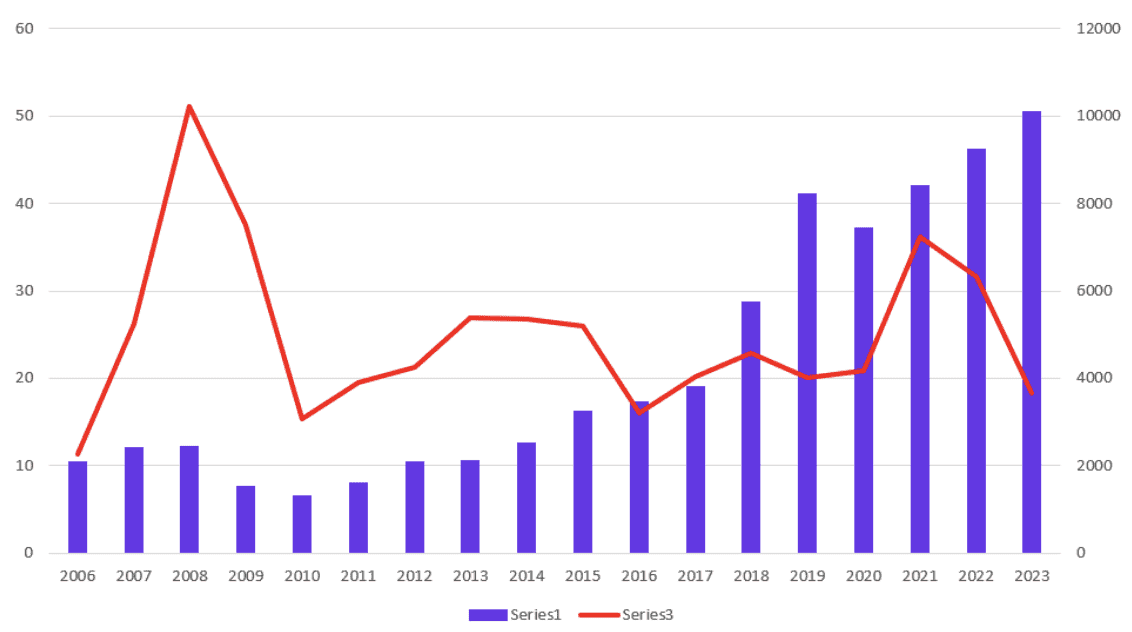
Combinação de gráfico de linhas e barras. Imagem do autor
Gráfico de linhas múltiplas + gráfico de barras
A combinação de vários gráficos de linhas com um gráfico de barras é útil para comparar várias tendências com um pano de fundo de valores individuais.
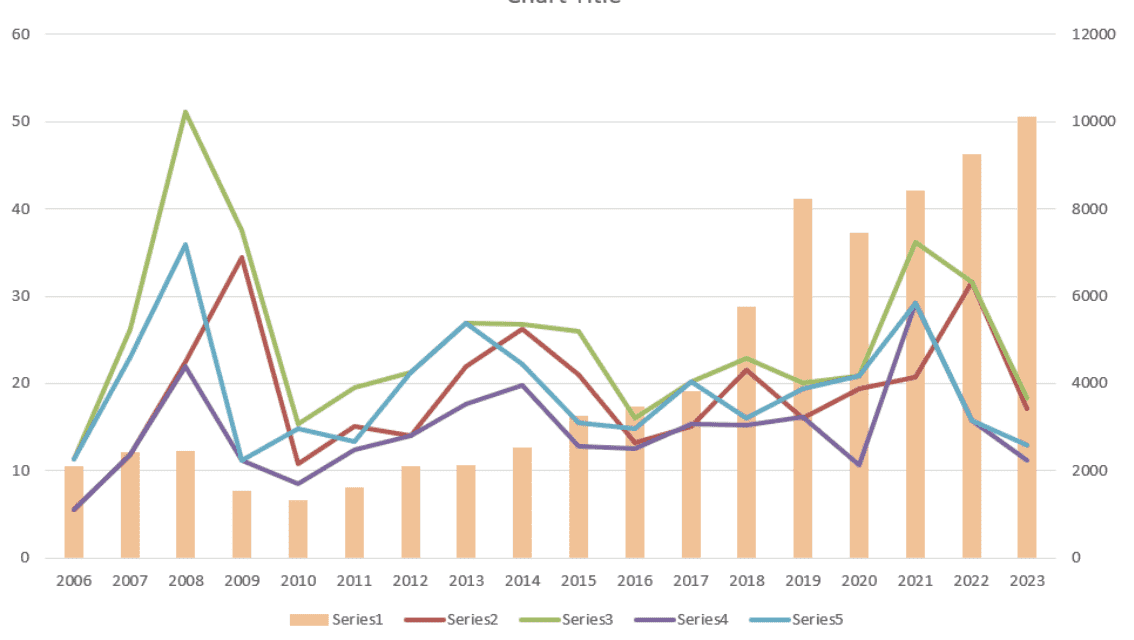
Combinação de vários gráficos de linhas e barras. Imagem do autor
Gráfico de área + gráfico de barras
A combinação de um gráfico de área com um gráfico de barras pode enfatizar o total cumulativo e os pontos de dados discretos.
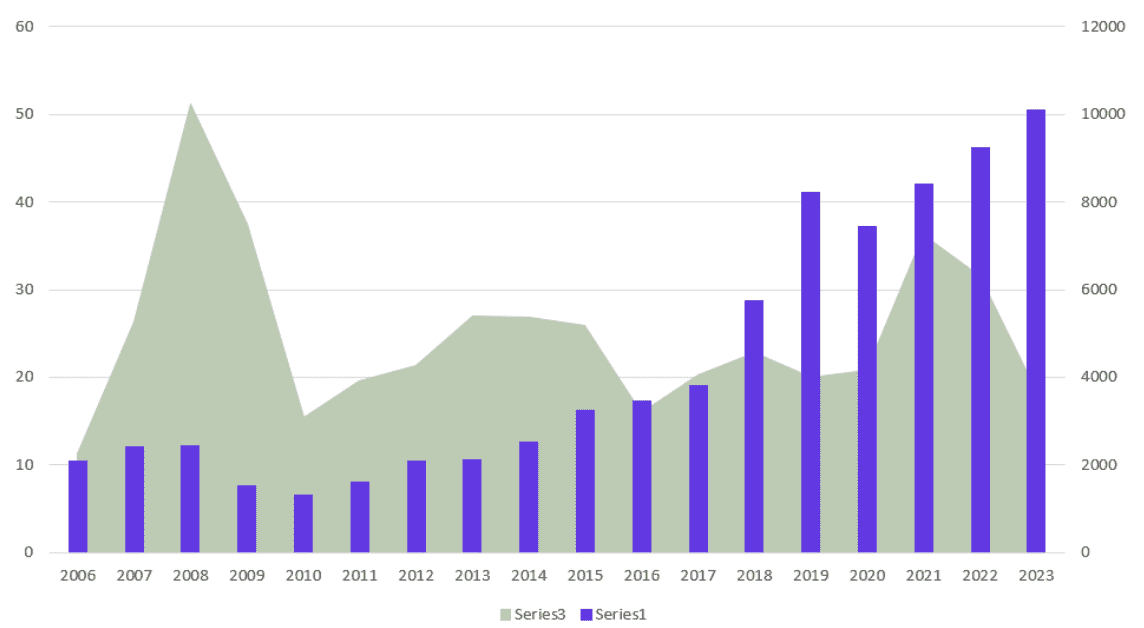 Combinação de gráfico de área e de barras. Imagem do autor
Gráfico de área empilhada + gráfico de barras
A combinação de um gráfico de área empilhada com um gráfico de barras destaca a composição dos valores e, ao mesmo tempo, mostra os valores individuais das barras.
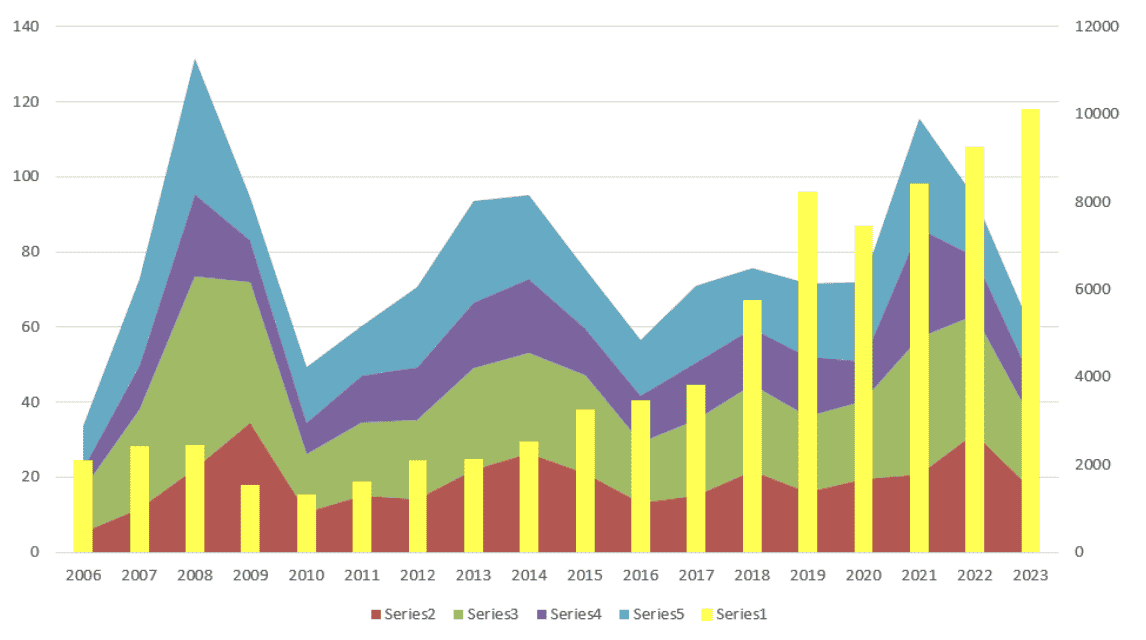
Combinação de área empilhada e gráfico de barras. Imagem do autor
Gráfico de linhas + gráfico de barras agrupadas
A combinação de um gráfico de linhas com um gráfico de barras agrupadas é eficaz para comparar tendências em várias categorias.
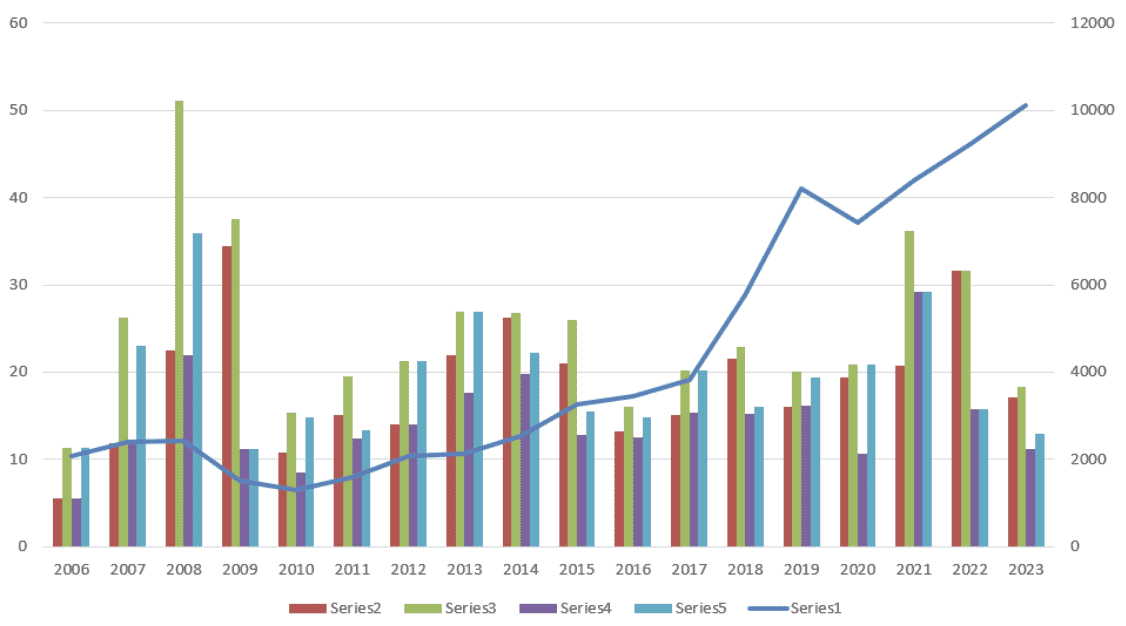
Combinação de gráfico de linhas e de barras agrupadas. Imagem do autor
Gráfico de linhas + gráfico de barras empilhadas
A combinação de um gráfico de linhas com um gráfico de barras empilhadas é útil para exibir a linha de tendência e, ao mesmo tempo, mostrar o detalhamento das categorias empilhadas.
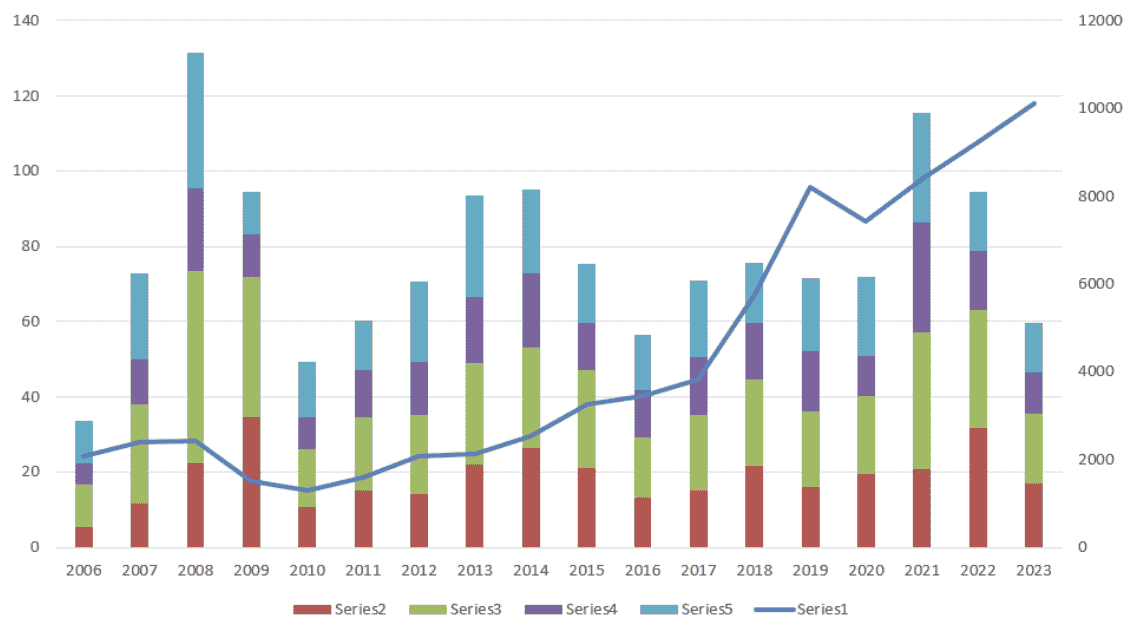
Combinação de gráfico de linhas e de barras empilhadas. Imagem do autor
Gráfico de linhas + gráfico de barras 100% empilhadas
A combinação de um gráfico de linhas com um gráfico de barras empilhadas 100% é ideal para mostrar a tendência e, ao mesmo tempo, enfatizar a proporção de categorias que compõem o todo.
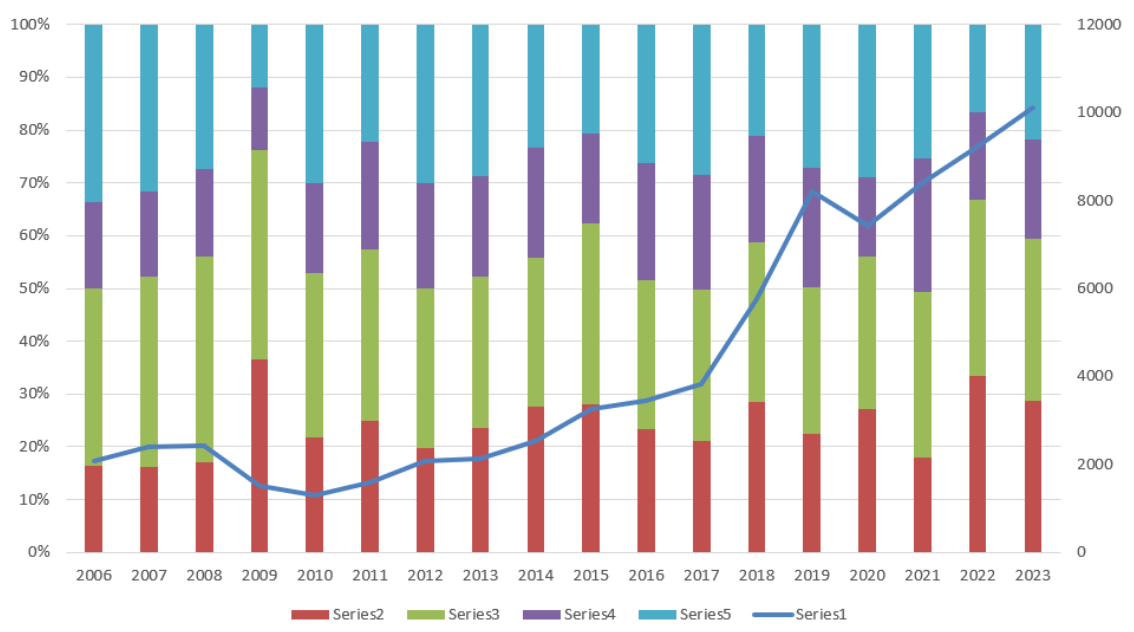
Combinação de gráfico de linha e gráfico de barras empilhadas 100%. Imagem do autor
Para que você possa se aprofundar em várias técnicas e nuances da visualização de dados no Excel, o curso Visualização de dados no Excel é um ótimo ponto de partida.
Tabela de melhores casos de uso
Usar a combinação certa de gráficos em um gráfico combinado pode melhorar muito a interpretação dos dados. Aqui está uma heurística para ajudar você a decidir qual combinação de gráficos usar:
| Combinação de gráficos | Melhor caso de uso | Exemplo |
|---|---|---|
| Gráfico de linhas e barras | Tendência (linha) com valores individuais (barras) | Receita mensal (barras) e tendência de crescimento (linha) |
| Gráfico de barras e linhas múltiplas | Várias tendências (linhas) com valores (barras) | Tendências de vendas de produtos (linhas) com vendas mensais (barras) |
| Gráfico de área e de barras | Totais acumulados (área) com valores discretos (barras) | Vendas acumuladas (área) e vendas mensais (barras) |
| Área empilhada e gráfico de barras | Composição (área empilhada) com valores (barras) | Vendas por região (área empilhada) e vendas totais (barras) |
| Gráfico de linhas e de barras agrupadas | Tendências (linha) entre categorias (barras agrupadas) | Receita anual (linha) por departamento (barras agrupadas) |
| Gráfico de linhas e de barras empilhadas | Tendência (linha) com divisão por categoria (barras empilhadas) | Receita total (linha) por produto (barras empilhadas) |
| Gráfico de linhas e de barras 100% empilhadas | Tendências (linha) com proporção (barras empilhadas 100%) | Tendência de participação de mercado (linha) por empresa (barras 100% empilhadas) |
Tabela dos melhores casos de uso de gráficos combinados.
Como criar um gráfico de combinação no Excel
Para criar um gráfico de combinação no Excel, você precisa seguir algumas etapas simples.
Selecione os dados em sua planilha do Excel.
Abra a guia Inserir e vá para o grupo Gráficos.
Clique no botão Gráficos recomendados.
Abra a guia All Charts ( Todos os gráficos ).
Selecione a opção Combo no final da lista.
Selecione um tipo de gráfico para cada série de dados. Você provavelmente precisará selecionar um eixo secundário para um deles.
Pressione OK.
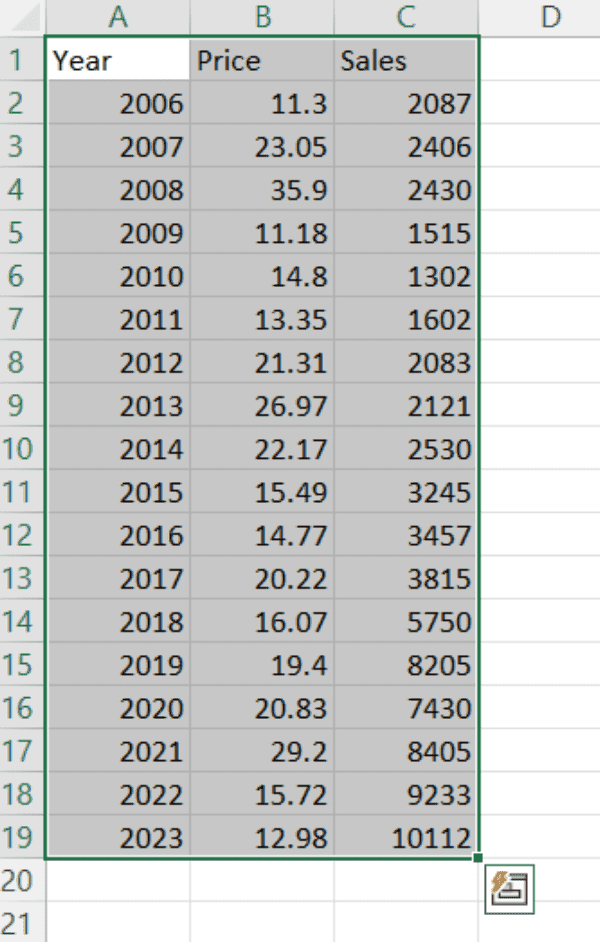
Seleção de dados. Imagem do autor

Abertura de gráficos recomendada. Imagem do autor
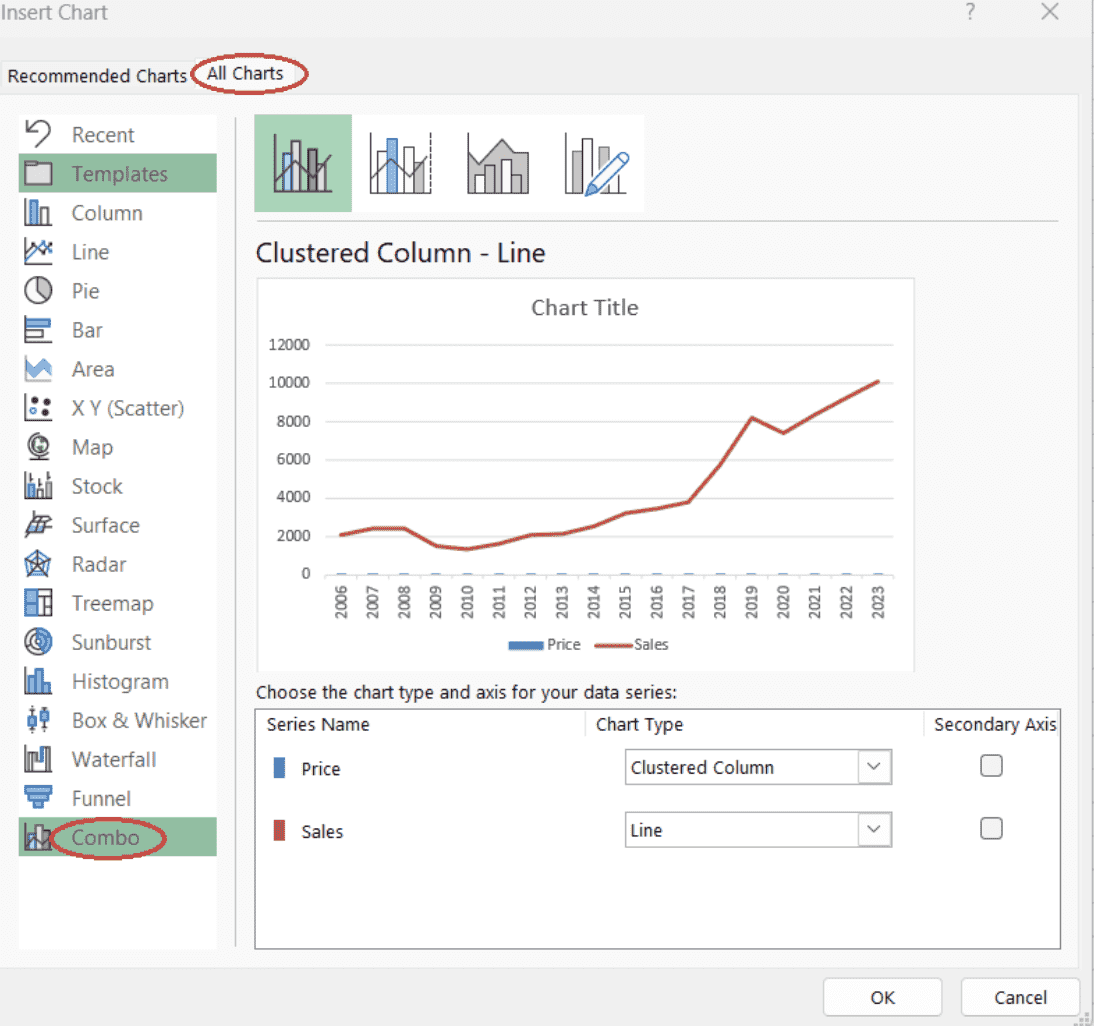
Opção de abertura de gráfico combinado. Imagem do autor
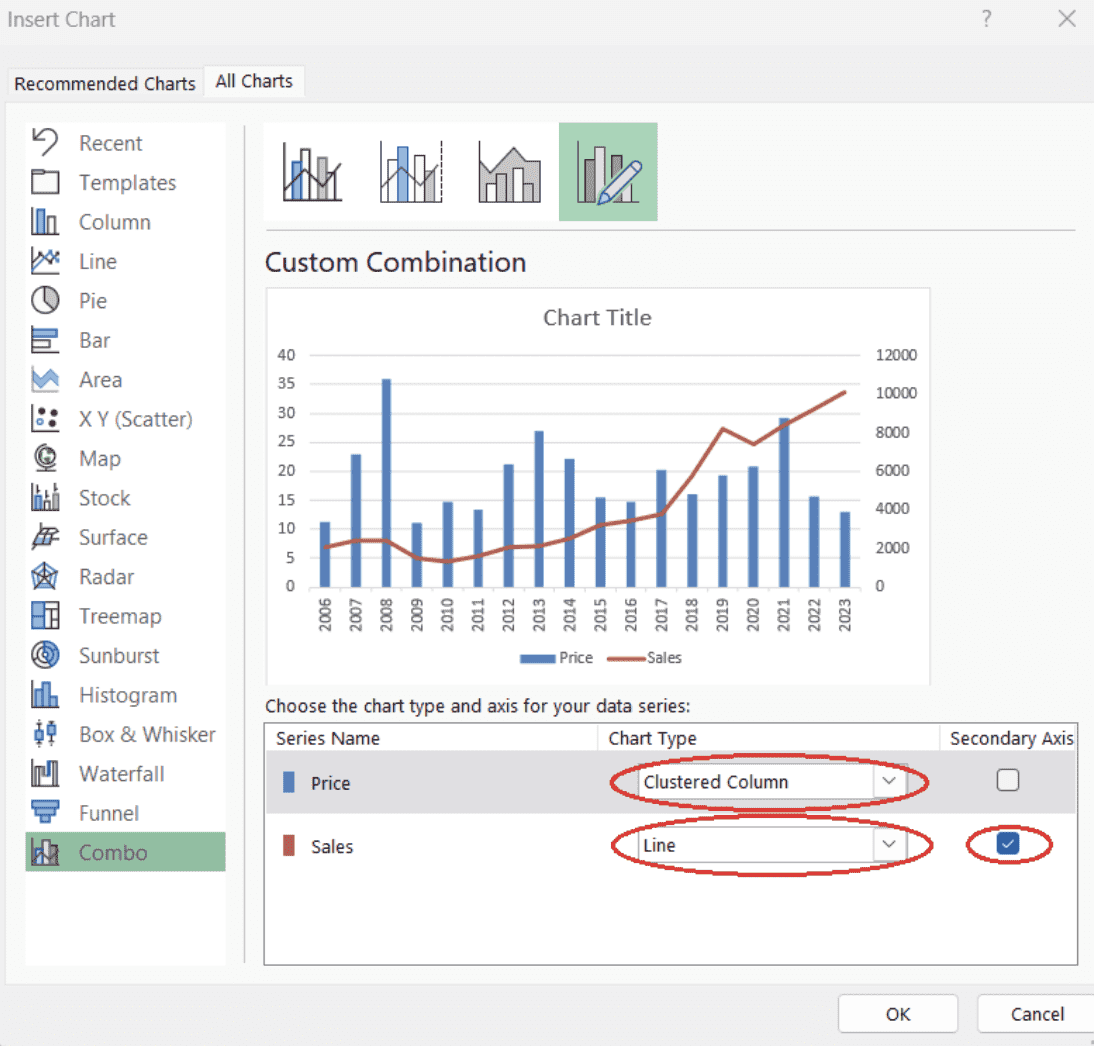
Definir séries de dados para um gráfico de combinação. Imagem do autor
Como formatar um gráfico de combinação no Excel
Depois que você tiver criado o gráfico de combinação, a próxima etapa é personalizar seus elementos para aumentar a clareza e o apelo visual. Veja como você pode adicionar ou remover elementos do gráfico para representar melhor seus dados:
Como adicionar ou remover elementos do gráfico
- Selecione a área do gráfico.
- Pressione o botão Chart Elements (Elementos do gráfico ).
- Selecione os elementos do gráfico que você deseja exibir.
- Você também pode passar o mouse sobre o nome do elemento do gráfico até que apareça um menu suspenso para refinar sua escolha.
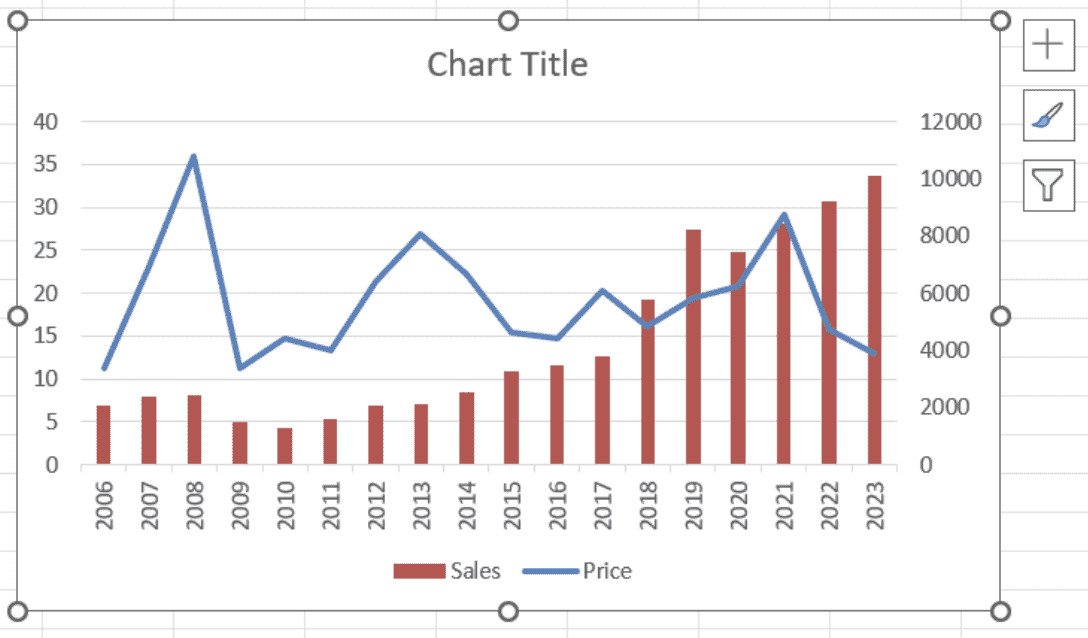
Selecionando a área do gráfico no Excel. Imagem do autor
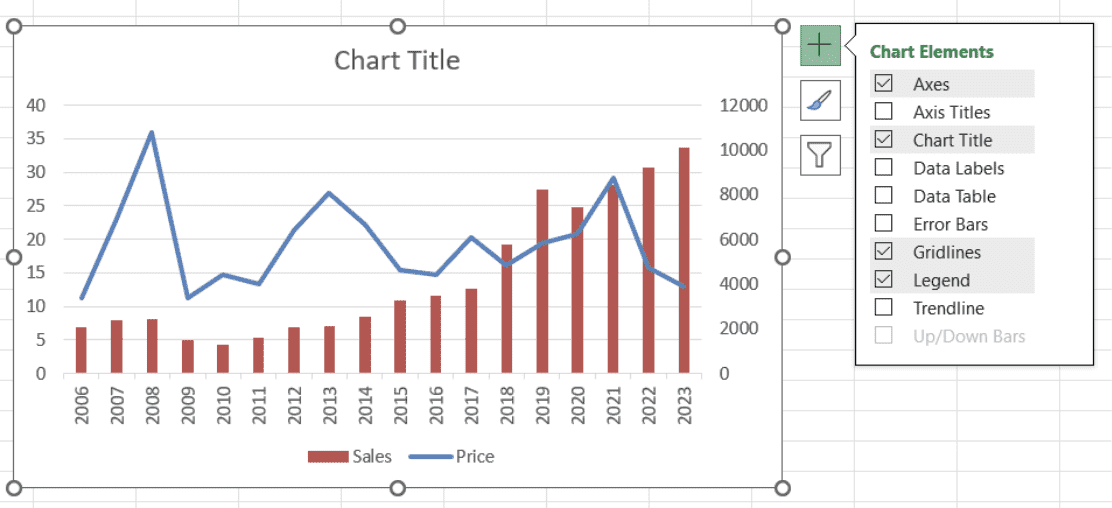 Abrindo as opções de elementos de gráfico disponíveis no Abrindo as opções de elementos de gráfico disponíveis no Excel. Imagem do autor
Como alterar o estilo do gráfico e o esquema de cores
- Selecione a área do gráfico.
- Pressione o botão Chart Styles (Estilos de gráfico ).
- Selecione um estilo adequado para seu gráfico na guia Style (Estilo ).
- Selecione um esquema de cores adequado para seu gráfico na guia Color (Cor ):
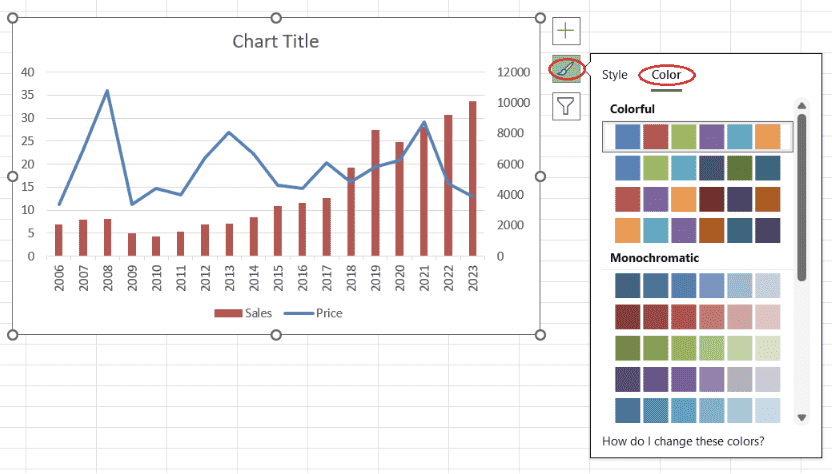 Seleção de um esquema de cores. Imagem do autor
Como adicionar ou remover filtros
- Selecione a área do gráfico.
- Pressione o botão Chart Filters (Filtros de gráfico ).
- Para adicionar um filtro, desmarque as séries e/ou categorias indesejadas na guia Values (Valores) e pressione Apply (Aplicar).
- Para modificar o filtro, introduza as modificações necessárias na guia Values (Valores ) e pressione Apply (Aplicar).
- Para remover o filtro, selecione All (Todos ) para séries e categorias na guia Values (Valores ) e pressione Apply (Aplicar):
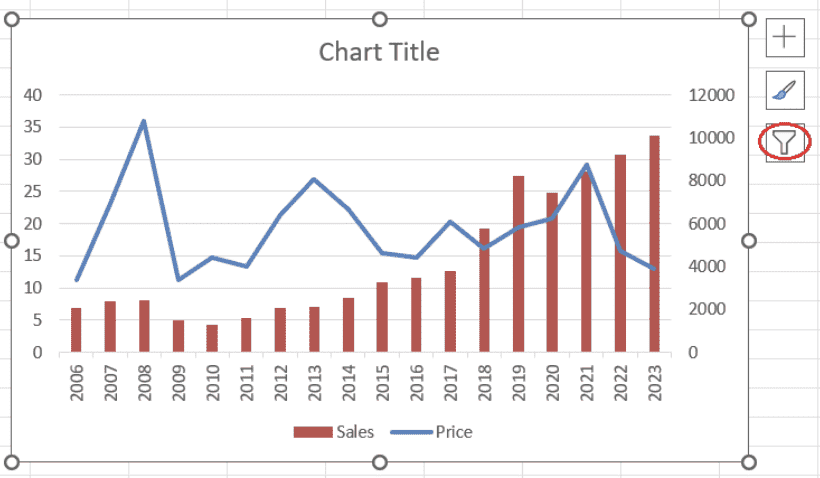 Abrindo as opções de filtro de gráfico disponíveis no Excel. Imagem do autor
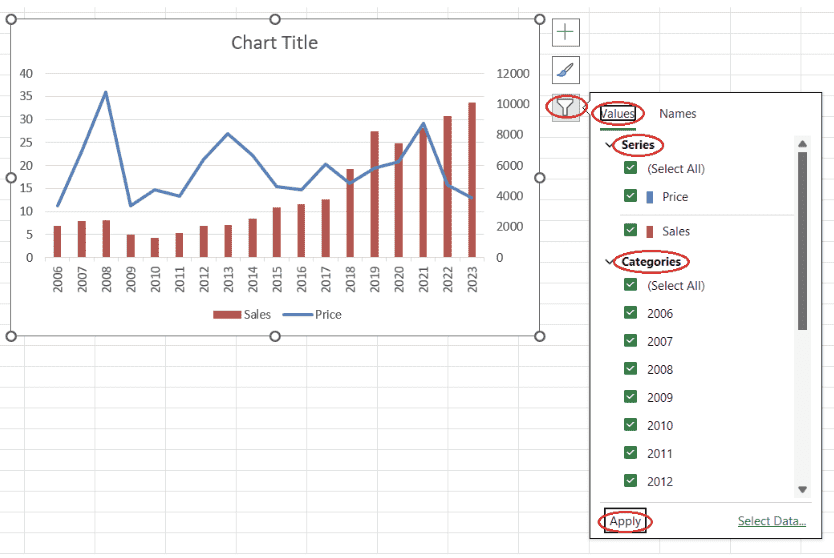 Adicionando um filtro de gráfico para um gráfico no Excel. Imagem do autor
Ter dados limpos é um pré-requisito essencial para criar visualizações de dados significativas e poder extrair delas insights preciosos. O curso sobre Preparação de dados no Excel ajudará você a entender como preparar os dados do Excel por meio de funções lógicas, fórmulas aninhadas, funções de pesquisa e tabelas dinâmicas.
Como formatar séries de dados
- Selecione a série de dados que você deseja formatar, clique com o botão direito do mouse e selecione Formatar série de dados.
- Para um gráfico de linhas, você pode ajustar a Cor, a Transparência, a Largura e o Tipo de traço na subguia Linha da guia Preenchimento e linha. Talvez você também queira ajustar o tipo, o tamanho, a cor e a borda do marcador na subguia Marcador da guia Preenchimento e linha.
- Para um gráfico de barras, você pode ajustar o preenchimento da barra, a cor, a cor da borda, a transparência, a largura e o tipo de traço na guia Fill & Line (Preenchimento e linha ).
- Você também pode ajustar a barra Gap Width (Largura da lacuna ) na guia Series Options (Opções da série ).
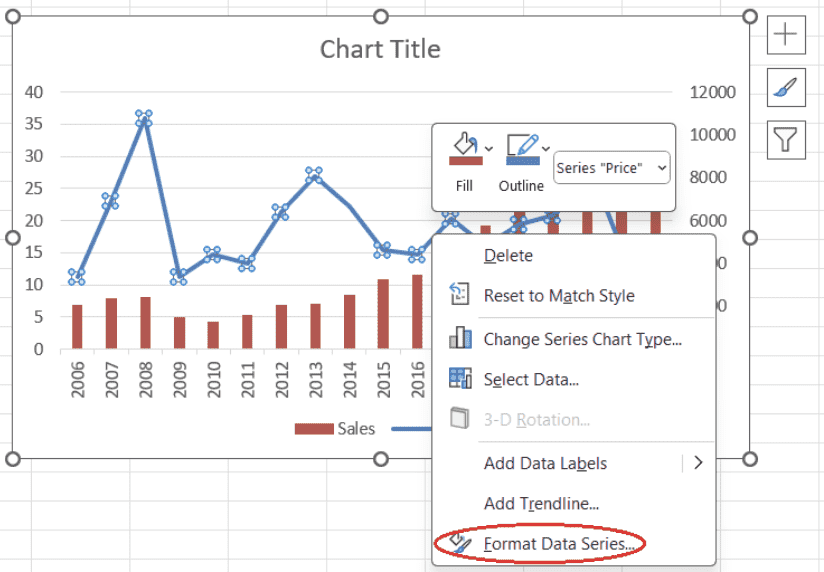 Abrindo Abrindo o painel para formatar séries de dados. Imagem do autor
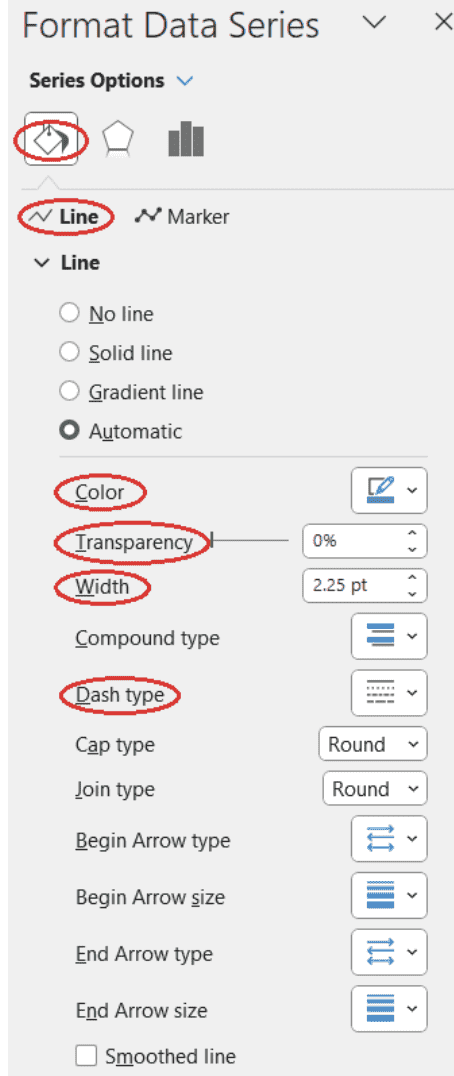 Ajustando a Ajustando as propriedades da linha para um gráfico de linhas. Imagem do autor
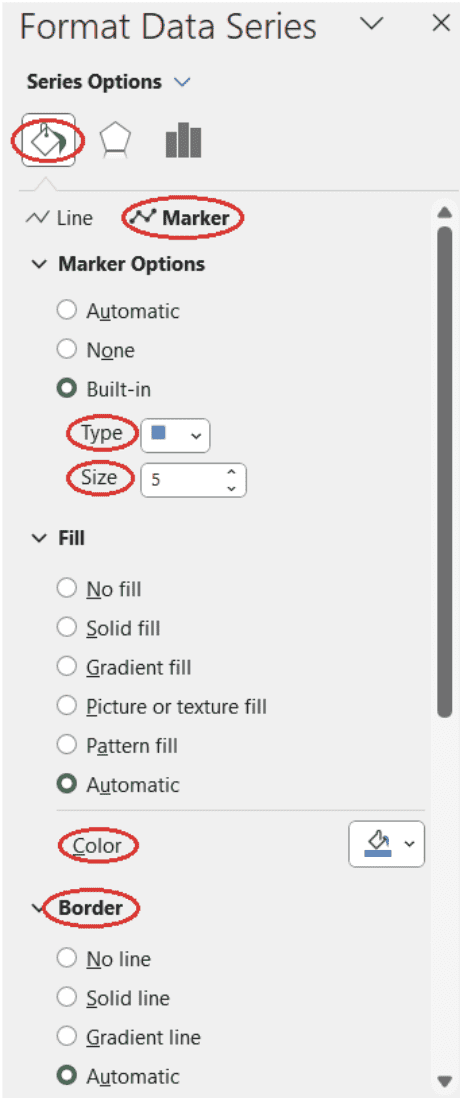 Como Como ajustar as propriedades do marcador para um gráfico de linhas. Imagem do autor
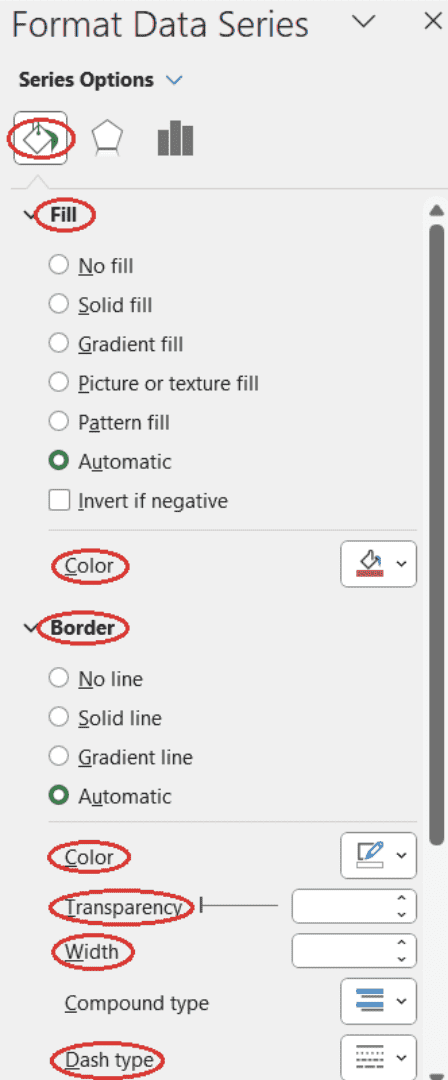 Ajustando o Ajustando as propriedades da barra para um gráfico de barras. Imagem do autor
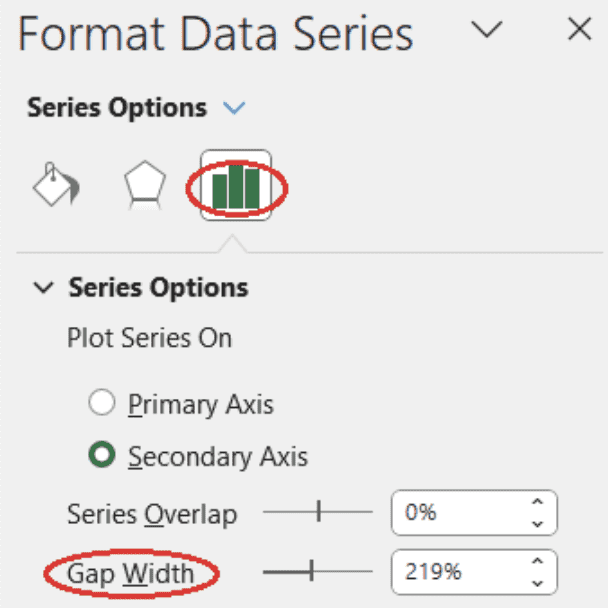 Ajustando a largura do espaço da barra Ajustando a largura do espaço da barra para um gráfico de barras. Imagem do autor
Como alterar a posição da legenda
- Na área do gráfico, selecione a legenda, clique com o botão direito do mouse e selecione Format Legend. O painel Legenda de formato aparecerá no lado esquerdo da planilha do Excel.
- Selecione uma posição de legenda adequada na subguia Opções de legenda da guia Opções de legenda.
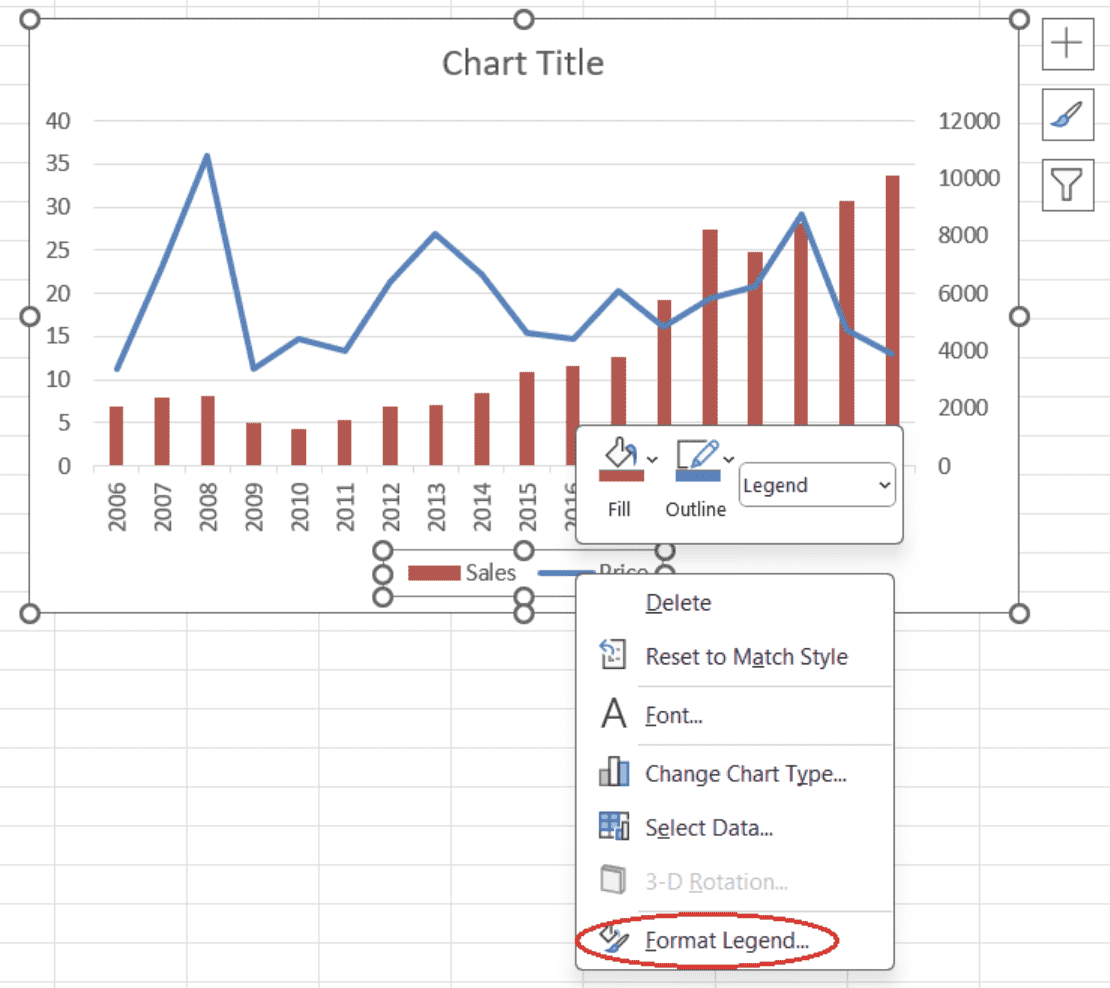 Abrindo Abrindo o painel para formatar a legenda. Imagem do autor
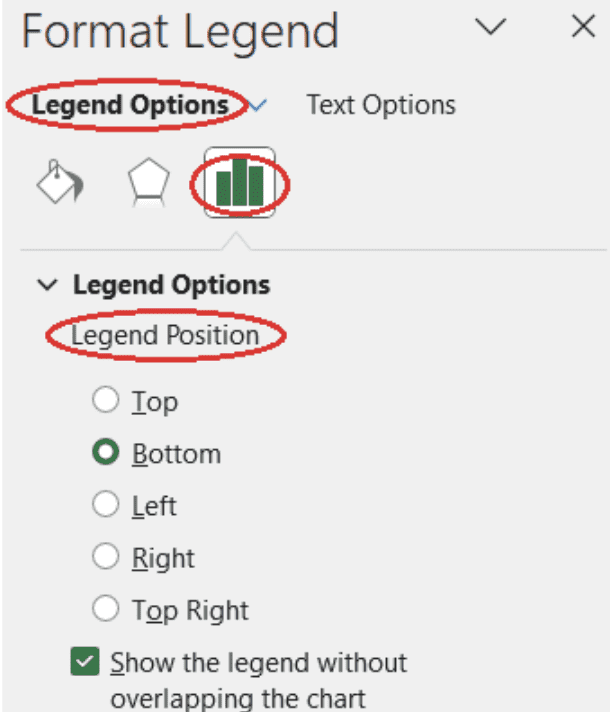 Selecionando Selecionando a posição da legenda. Imagem do autor
Como personalizar o texto
- Selecione o elemento do gráfico que contém o texto que você deseja personalizar, clique com o botão direito do mouse e selecione Font (Fonte).
- Na guia Font (Fonte ) da janela pop-up que aparece, você pode ajustar a própria fonte e/ou o estilo, o tamanho e a cor da fonte.
- Pressione OK.
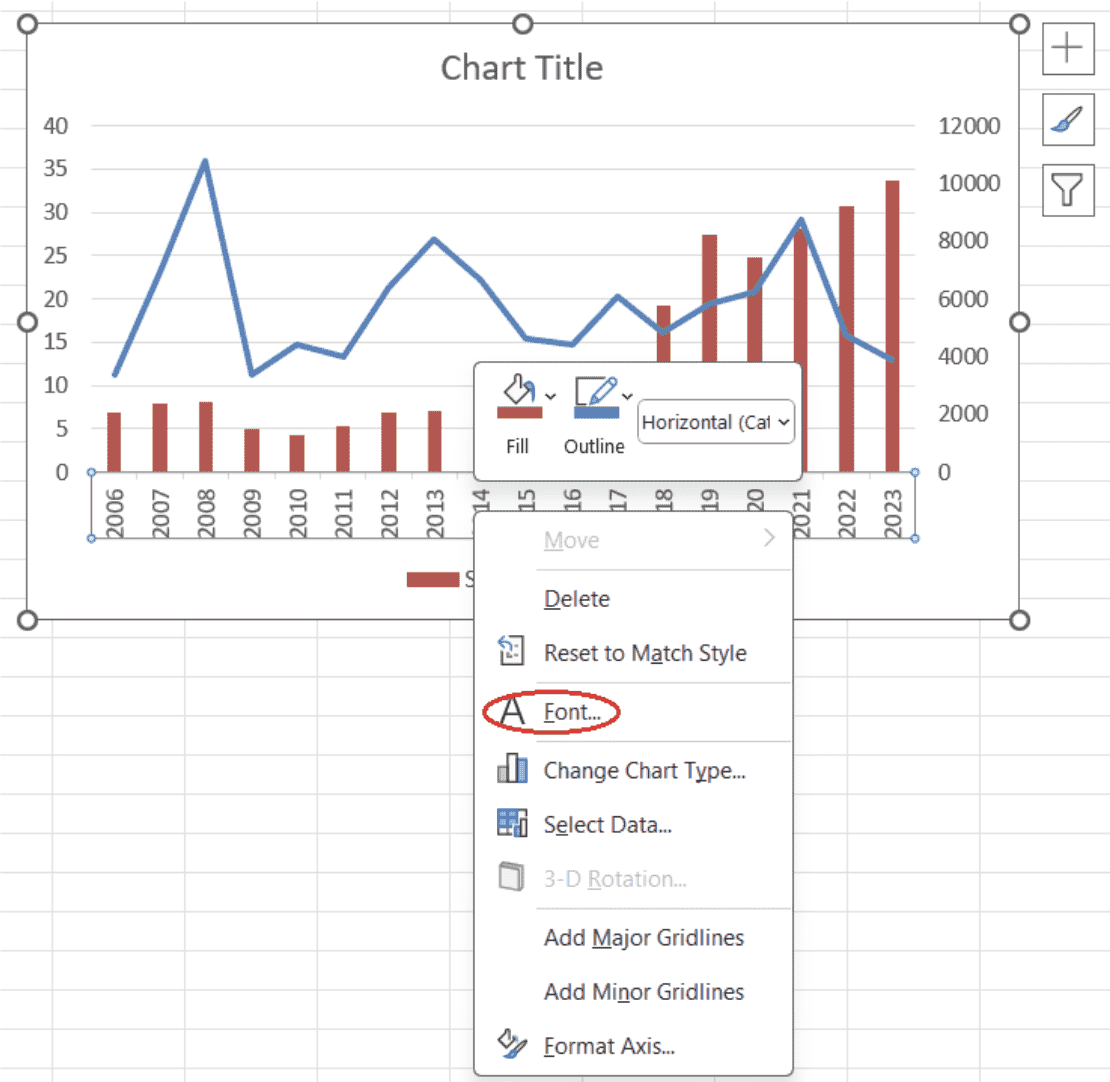
Abrir opções de fonte para um elemento de gráfico. Imagem do autor
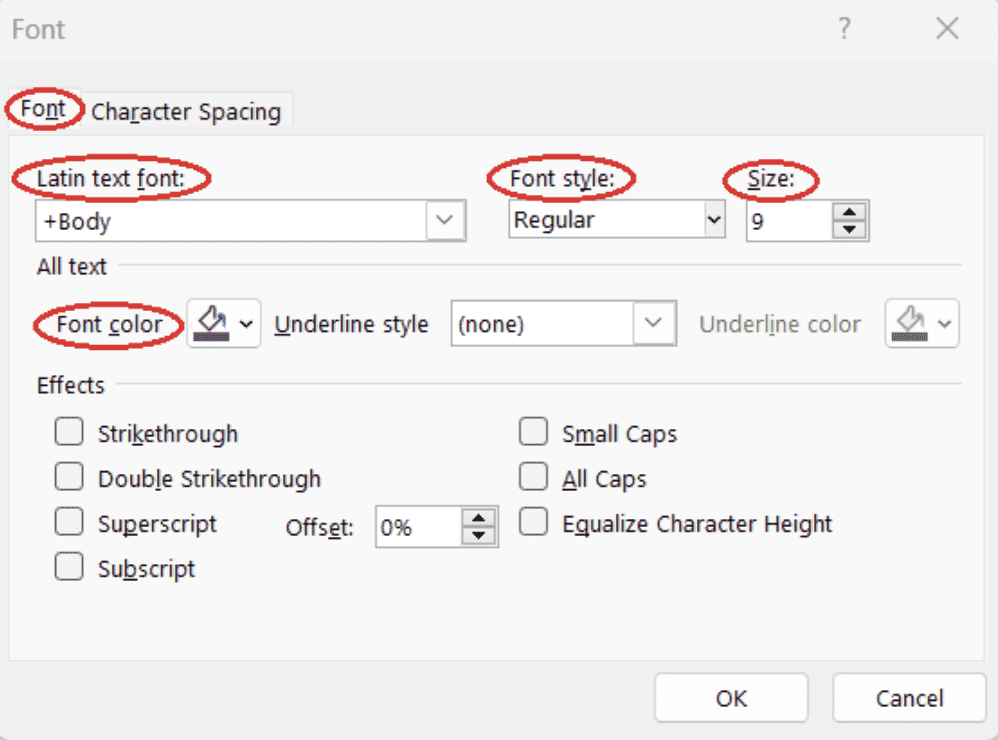
Ajuste das opções de fonte para um elemento de gráfico. Imagem do autor
Considerações sobre o uso de gráficos combinados
Embora um gráfico de combinação no Excel tenha inúmeras vantagens, ele também tem alguns pontos fracos intrínsecos que devemos considerar.
- Diferenças de escala/magnitude: O uso de um eixo secundário pode causar discrepâncias no impacto percebido das séries de dados. Uma alteração em uma escala pode não corresponder a uma alteração de magnitude semelhante na segunda escala, levando a uma possível interpretação incorreta dos dados.
- Superabundância de informações: A combinação de mais de dois tipos de gráfico em um gráfico combinado pode resultar em uma apresentação desordenada e visualmente sobrecarregada. Isso torna o gráfico difícil de interpretar e reduz sua eficácia.
- Escolha restrita de tipos de gráficos: Embora o Excel ofereça muitos tipos de gráficos para a criação de gráficos combinados, ele não inclui todos os tipos de gráficos possíveis. Essa limitação pode, às vezes, exigir o uso de outros softwares ou ferramentas para necessidades de gráficos mais especializados.
Conclusão
Neste tutorial, aprendemos o que é um gráfico combinado no Excel, quando e por que ele é útil, quais são seus principais recursos, quais tipos de gráficos podem ser combinados nele, como criar e formatar um gráfico combinado no Excel e quais problemas potenciais podemos encontrar ao trabalhar com esse tipo de visualização de dados.
Para impulsionar suas habilidades em Excel para o próximo nível, considere fazer um curso de habilidades do Excel Fundamentals com tudo incluído e para iniciantes, que ensinará tudo o que você precisa saber para realizar análises de dados no Excel em cenários do mundo real.
Perguntas frequentes
O que é um gráfico de combinação?
Um gráfico combinado, ou um gráfico de combinação, é um gráfico que combina dois ou mais tipos de gráficos, cada um representando um tipo diferente de dados, em um único visual. Normalmente, um gráfico combinado exibe uma evolução de diferentes séries de dados no mesmo período.
Quais são os principais recursos de um gráfico de combinação?
Os principais recursos de um gráfico combinado incluem ter mais de um tipo de gráfico no mesmo visual, mais de uma série de dados na legenda do gráfico, rótulo e valores do eixo secundário e diferentes cores, transparências ou rótulos de dados.
Que tipos de gráficos podem ser combinados em um gráfico combinado?
Algumas das combinações mais comuns de tipos de gráfico em um gráfico combinado são: gráfico de linhas e gráfico de barras, gráfico de linhas múltiplas e gráfico de barras, gráfico de área e gráfico de barras, gráfico de área empilhada e gráfico de barras, gráfico de linhas e gráfico de barras agrupadas e gráfico de linhas e gráfico de barras empilhadas.
Quais tipos de gráfico para criar um gráfico de combinação estão disponíveis no Excel?
Tipos de gráficos de coluna, barra, linha, área, pizza, dispersão e radar, cada um com suas variações. No Excel, os tipos de gráfico de colunas se referem aos tipos de gráfico de barras verticais, enquanto os tipos de gráfico de barras se referem aos tipos de gráfico de barras horizontais.
É possível combinar três ou mais tipos de gráficos em um gráfico combinado no Excel?
Tecnicamente, isso é possível. No entanto, a prática recomendada é combinar dois tipos de gráfico em um gráfico combinado, para evitar que o visual resultante seja pesado, sobrecarregado e difícil de interpretar.
Quais são as vantagens dos gráficos combinados no Excel?
As vantagens dos gráficos combinados no Excel incluem a fácil comparação de diferentes séries de dados, o destaque eficiente de tendências e padrões específicos, a apresentação aprimorada dos dados e a melhoria na tomada de decisões.
Quais são os pontos fracos dos gráficos combinados no Excel?
Alguns pontos fracos dos gráficos combinados no Excel são as diferenças de escala e magnitude na presença do eixo secundário, a superabundância de informações especificamente quando você tem mais de dois tipos de gráfico no mesmo gráfico combinado e a escolha restrita de tipos de gráfico.
Como encontrar o recurso para criar um gráfico de combinação no Excel?
Abrindo a guia Inserir da faixa de opções, clicando no botão Gráficos recomendados do grupo Gráficos, abrindo a guia Todos os gráficos na janela pop-up e selecionando a opção Combo no final da lista.
Como adicionar ou remover elementos de gráfico em um gráfico de combinação no Excel?
Você pode selecionar a área do gráfico, clicar no botão Chart Elements (Elementos do gráfico ) e selecionar os elementos do gráfico necessários. Para uma seleção mais granular, precisamos passar o mouse sobre o nome do elemento do gráfico de interesse até que uma seta suspensa apareça, abrir a lista suspensa e refinar nossa escolha.
Como filtrar séries de dados em um gráfico de combinação no Excel?
Você pode selecionar a área do gráfico, clicar no botão Chart Filters (Filtros de gráfico ), selecionar as séries necessárias ou desmarcar as indesejadas na guia Values (Valores ) e pressionar Apply (Aplicar).

Cientista de Dados Certificado pela IBM (2020), anteriormente Geólogo de Petróleo/Geomodelador de campos de petróleo e gás em todo o mundo com mais de 12 anos de experiência de trabalho internacional. Você é proficiente em Python, R e SQL. Áreas de especialização: limpeza de dados, manipulação de dados, visualização de dados, análise de dados, modelagem de dados, estatística, storytelling, machine learning. Ampla experiência no gerenciamento de comunidades de ciência de dados e na redação/revisão de artigos e tutoriais sobre ciência de dados e tópicos de carreira.