
Tracks
AI智能体基础知识
6小时
Last week saw the release of Claude Opus 4.7, Anthropic's latest iteration of its flagship model. By delivering a roughly three-fold increase in visual resolution and a more literal adherence to complex prompts, Opus 4.7 is built to navigate intricate user interfaces and parse high-fidelity technical diagrams with a new level of surgical precision.
In this tutorial, I'll walk you through the main changes introduced in Claude Opus 4.7. We'll explore what the model is, the critical new features it introduces, and how to set it up locally with Python. Finally, we'll build a fully functional, multi-step demonstration project: an autonomous, high-resolution visual chart digitizer.
I recommend taking our Introduction to Claude Models course if you want to learn more about Anthropic's large language models (LLMs).
Claude Opus 4.7 is Anthropic’s newest flagship LLM. Because the company restricts its more potent Claude Mythos Preview only to approved security experts, Opus 4.7 remains its primary, widely available application programming interface for general developers.
This version brings upgrades to a few different areas:
Developers note marked improvements in its ability to follow strict instructions and avoid repetitive processing loops. Opus 4.7 inherently double-checks its work and reviews assumptions before writing code, which greatly reduces the chance of agents getting stuck in continuous error loops.
When looking at benchmark data, one result stands out. In the demanding SWE-bench Pro test, which measures how well an AI fixes actual open-source GitHub software bugs, Opus 4.7 achieved a 10.9 point increase over its predecessor. This jump cements the role of the Opus model family as the agentic programming primus.
To learn more about the model, check out our guide to Claude Opus 4.7.
The transition to Opus 4.7 introduces several entirely new control planes to manage computational resources and some shifts in prompt engineering. Here are the major changes and new features you need to know:
High-resolution multimodal vision: The model pushes the maximum accepted image dimension to 2,576 pixels on the longest edge, yielding an effective resolution of approximately 3.75 megapixels. Geometric coordinate mapping has been overhauled, meaning bounding box coordinates now possess a strictly enforced 1:1 mapping with actual image pixels, which eliminates the need for complex scale-factor math.
Adaptive thinking: Extended thinking budgets (e.g., budget_tokens) have been completely removed. Submitting legacy requests will return an HTTP 400 rejection error. Instead, Opus 4.7 mandates the use of "adaptive thinking" (thinking: {"type": "adaptive"}), which allows the model to dynamically allocate its own internal reasoning budget based on prompt complexity.
Granular effort control: A new parameter value, xhigh (extra high), has been positioned mathematically between the standard high effort and the maximum max effort configurations. Anthropic strongly recommends xhigh as the optimal starting point for agentic coding and complex problem solving. The model has also shifted toward absolute "literalism"; it executes the exact text provided without "reading between the lines."
Task budgets: To mathematically mitigate runaway agentic loops, Opus 4.7 introduces "task budgets" (currently in public beta). By defining a task_budget, developers explicitly inform the model of the absolute total token allowance for the complete task lifecycle. The model continuously tracks this countdown and self-moderates to ensure graceful task completion.
Client-side memory tool: Opus 4.7 is exceptionally adept at writing to and reading from a managed scratchpad. To formalize this, Anthropic enhanced the client-side memory tool, providing git-backed synchronization capabilities optimized for MemFS (Memory File System) workflows.
Before we start coding our demo project, we need to set up our environment to support Opus 4.7. For this tutorial, we will use asynchronous Python, as it is the industry standard for data-intensive, high-concurrency workflows.
We need to have Python 3.8 or higher installed on our system. I highly recommend constructing an isolated virtual environment to prevent dependency conflicts.
Here’s how to create and activate such an environment named opus_4_7 using Anaconda:
conda create -n opus_4_7 python=3.10 -y
conda activate opus_4_7To put the theoretical capabilities of Claude Opus 4.7 into a practical application, we will construct an autonomous high-resolution chart digitizer.
Data scientists constantly encounter valuable data locked as static images or PDFs (like scatter plots, bar charts, or line graphs). Using older AI models required writing complex scale-factor math to automate extracting data from these charts.
In this project, we will build a Python script that takes a screenshot of any chart and creates a CSV file with the raw data.
We will explicitly:
Use the new 3.75MP vision and 1:1 pixel mapping to perfectly read the graph.
Use adaptive thinking at the xhigh effort level to rigorously deduce the X and Y axes.
Output a clean Pandas DataFrame containing the exact data points.
I'll walk you through this process step-by-step. This tutorial is self-contained, but if you want to learn more about the model’s capabilities or get stuck implementing your own agents, check its official documentation.
First things first, we need to enable authentication. For that, we need to create an API key on the Anthropic Developer Console.
Never hardcode API credentials directly into your source code repository. Instead, generate a secure .env file in the root directory of your project:
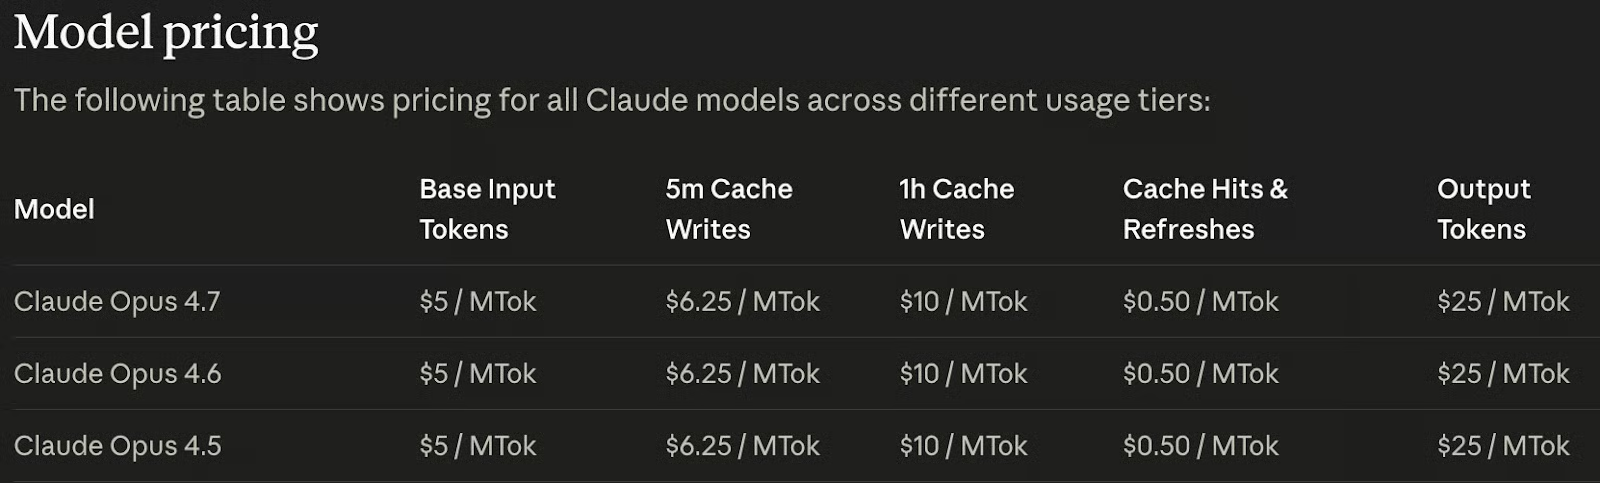
ANTHROPIC_API_KEY=<paste_your_api_key_here>Note that the model isn't free. To enable the API key, we need to add credits to our account. The good news is that the model pricing is the same as the two previous models:
Next, let's install the necessary libraries. We will need:
anthropic, the official anthropic SDK for API integration;
python-dotenv for environment variable management;
pandas to structure our extracted data.
Open your terminal and run the following command (make sure the opus_4_7 environment we created above is active):
pip install anthropic python-dotenv pandasLet's establish the foundation by building a basic asynchronous command-line interface. This step introduces Opus 4.7's new xhigh effort level and adaptive thinking architecture. Create a file named chart_digitizer.py and add the following code:
import os
import asyncio
from dotenv import load_dotenv
from anthropic import AsyncAnthropic

# Ingest secure environment variables
load_dotenv()

# Initialize the asynchronous Anthropic client
client = AsyncAnthropic(
    api_key=os.environ.get("ANTHROPIC_API_KEY")
)

async def test_adaptive_thinking():
    print("Initiating Text Agent with Adaptive Thinking...")

    response = await client.messages.create(
        model="claude-opus-4-7",
        max_tokens=64000,
        stream=True, # Required for long responses
        thinking={"type": "adaptive"}, # NEW: Replaces budget_tokens
        output_config={"effort": "xhigh"}, # NEW: Extra high effort level
        messages=[
            {"role": "user", "content": "Explain why 1:1 pixel mapping is crucial for data extraction."}
        ]
    )

    # Parse the streaming response structure
    async with response as stream:
        async for event in stream:
            if event.type == "content_block_start":
                if event.content_block.type == "thinking":
                    print("\n--- Internal Reasoning Trace ---")
                elif event.content_block.type == "text":
                    print("\n--- Final Output ---")
            elif event.type == "content_block_delta":
                if event.delta.type == "thinking_delta":
                    print(event.delta.thinking, end="", flush=True)
                elif event.delta.type == "text_delta":
                    print(event.delta.text, end="", flush=True)

if __name__ == "__main__":
    asyncio.run(test_adaptive_thinking())
We can run this using the command:
python chart_digitizer.pyThis script shows how to send a request to Claude Opus 4.7, but it doesn’t extract data from a chart yet. It just sends the prompt:
Explain why 1:1 pixel mapping is crucial for data extraction.To guarantee that the model gives us clean data we can use in Pandas, we will use a "Tool" to force structured output. We define a JSON schema that tells Claude exactly how to format the extracted chart coordinates.
Update the chart_digitizer.py file to include the tool schema and a system prompt after the client initialization:
# Define the JSON schema to force structured data extraction
extraction_tool = {
    "name": "save_chart_data",
    "description": "Saves the extracted data points from the chart into a structured format.",
    "input_schema": {
        "type": "object",
        "properties": {
            "x_axis_label": {"type": "string", "description": "The label for the X axis"},
            "y_axis_label": {"type": "string", "description": "The label for the Y axis"},
            "data_points": {
                "type": "array",
                "items": {
                    "type": "object",
                    "properties": {
                        "x": {"type": "number", "description": "X-axis value"},
                        "y": {"type": "number", "description": "Y-axis value"}
                    },
                    "required": ["x", "y"]
                }
            }
        },
        "required": ["x_axis_label", "y_axis_label", "data_points"]
    }
}

SYSTEM_PROMPT = """
You are an expert Data Scientist. Your task is to digitize the provided chart image.
Execute the following strict, literal directives:
1. Scan the image using your 1:1 pixel mapping capabilities to identify the X and Y axes, their scales, and all plotted data points.
2. Utilize your adaptive thinking space to perform the mathematical conversions from visual pixel locations to the actual chart values.
3. You MUST use the 'save_chart_data' tool to output the final extracted data points.
Do not guess. Be highly precise.
"""
To force the model to use the tool and system prompt, we update the request to include the tool and system parameters:
response = await client.messages.create(
        model="claude-opus-4-7",
        max_tokens=64000,
        stream=True,
        thinking={"type": "adaptive"},
        system=SYSTEM_PROMPT, # Add to enable the system prompt
        tools=[extraction_tool], # Add to provide the tool to the model
        messages=messages,
        output_config={
            "effort": "xhigh",
        }
)Visually mapping hundreds of data points and calculating their exact values requires immense cognitive processing. To protect our compute credits, we enforce a task Budget. We will establish an advisory limit of 80,000 tokens for this operation.
We can set this limit on the request by adding a task_budget to the output_config:
response = await client.messages.create(
        model="claude-opus-4-7",
        max_tokens=64000,
        stream=True,
        thinking={"type": "adaptive"},
        system=SYSTEM_PROMPT,
        tools=[extraction_tool],
        messages=messages,
        output_config={
            "effort": "xhigh",
            "task_budget": {"type": "tokens", "total": 80000} # Add to limit output tokens
        }
    )
Notice the beta headers required to unlock this capability. To set this up, we need to update the way we initialize the agent to:
client = AsyncAnthropic(
    api_key=os.environ.get("ANTHROPIC_API_KEY"),
    default_headers={"anthropic-beta": "task-budgets-2026-03-13"}
)In the final phase, we integrate the 3.75MP visual capabilities. We will construct a robust utility function to handle image ingestion and finalize the code to output a CSV file with the data.
Here is the completed, final code for our visual digitizer:
import os
import asyncio
import mimetypes
import sys
from dotenv import load_dotenv
from anthropic import AsyncAnthropic
import base64
import pandas as pd
# Ingest secure environment variables
load_dotenv()
# Initialize the asynchronous Anthropic client
client = AsyncAnthropic(
api_key=os.environ.get("ANTHROPIC_API_KEY"),
default_headers={"anthropic-beta": "task-budgets-2026-03-13"}
)
# Define the JSON schema to force structured data extraction
extraction_tool = {
"name": "save_chart_data",
"description": "Saves the extracted data points from the chart into a structured format.",
"input_schema": {
"type": "object",
"properties": {
"x_axis_label": {"type": "string", "description": "The label for the X axis"},
"y_axis_label": {"type": "string", "description": "The label for the Y axis"},
"data_points": {
"type": "array",
"items": {
"type": "object",
"properties": {
"x": {"type": "number", "description": "X-axis value"},
"y": {"type": "number", "description": "Y-axis value"}
},
"required": ["x", "y"]
}
}
},
"required": ["x_axis_label", "y_axis_label", "data_points"]
}
}
SYSTEM_PROMPT = """
You are an expert Data Scientist. Your task is to digitize the provided chart image.
Execute the following strict, literal directives:
1. Scan the image using your 1:1 pixel mapping capabilities to identify the X and Y axes, their scales, and all plotted data points.
2. Utilize your adaptive thinking space to perform the mathematical conversions from visual pixel locations to the actual chart values.
3. You MUST use the 'save_chart_data' tool to output the final extracted data points.
Do not guess. Be highly precise.
"""
def encode_high_res_image(image_path: str) -> tuple[str, str]:
if not os.path.exists(image_path):
raise FileNotFoundError(f"Critical Error: Image not located at {image_path}")
with open(image_path, "rb") as image_file:
base64_data = base64.b64encode(image_file.read()).decode("utf-8")
media_type, _ = mimetypes.guess_type(image_path)
if not media_type or not media_type.startswith("image/"):
media_type = "image/png"
return base64_data, media_type
async def digitize_chart(image_path: str = "chart.jpg"):
print("\nInitiating Opus 4.7 Autonomous Chart Digitization...")
IMAGE_PATH = image_path
base64_image_data, media_type = encode_high_res_image(IMAGE_PATH)
messages = [
{
"role": "user",
"content": [
{
"type": "image",
"source": {
"type": "base64",
"media_type": media_type,
"data": base64_image_data
}
},
{
"type": "text",
"text": "Please digitize this chart and extract the data points."
}
]
}
]
response = await client.messages.create(
model="claude-opus-4-7",
max_tokens=64000,
stream=True,
thinking={"type": "adaptive"},
system=SYSTEM_PROMPT,
tools=[extraction_tool],
messages=messages,
output_config={
"effort": "xhigh",
"task_budget": {"type": "tokens", "total": 80000}
}
)
# Accumulate tool input and thinking from the stream
import json
tool_name = None
tool_input_json = ""
thinking_text = ""
async with response as stream:
async for event in stream:
if event.type == "content_block_start":
if event.content_block.type == "tool_use":
tool_name = event.content_block.name
tool_input_json = ""
elif event.content_block.type == "thinking":
thinking_text = ""
elif event.type == "content_block_delta":
if event.delta.type == "input_json_delta":
tool_input_json += event.delta.partial_json
elif event.delta.type == "thinking_delta":
thinking_text += event.delta.thinking
if thinking_text:
print("\n--- Internal Thinking (Math & Scaling) ---")
print(thinking_text[:500] + "...\n[Cognitive trace truncated]")
if tool_name == "save_chart_data" and tool_input_json:
print("\n--- Data Extraction Complete! ---")
chart_data = json.loads(tool_input_json)
df = pd.DataFrame(chart_data["data_points"])
print(f"\nX-Axis: {chart_data['x_axis_label']}")
print(f"Y-Axis: {chart_data['y_axis_label']}")
print("\nExtracted DataFrame:")
print(df.head(10))
output_path = "chart_data.csv"
df.to_csv(output_path, index=False)
print(f"\nDataFrame saved to {output_path}")
if __name__ == "__main__":
image_path = sys.argv[1] if len(sys.argv) > 1 else "chart.jpg"
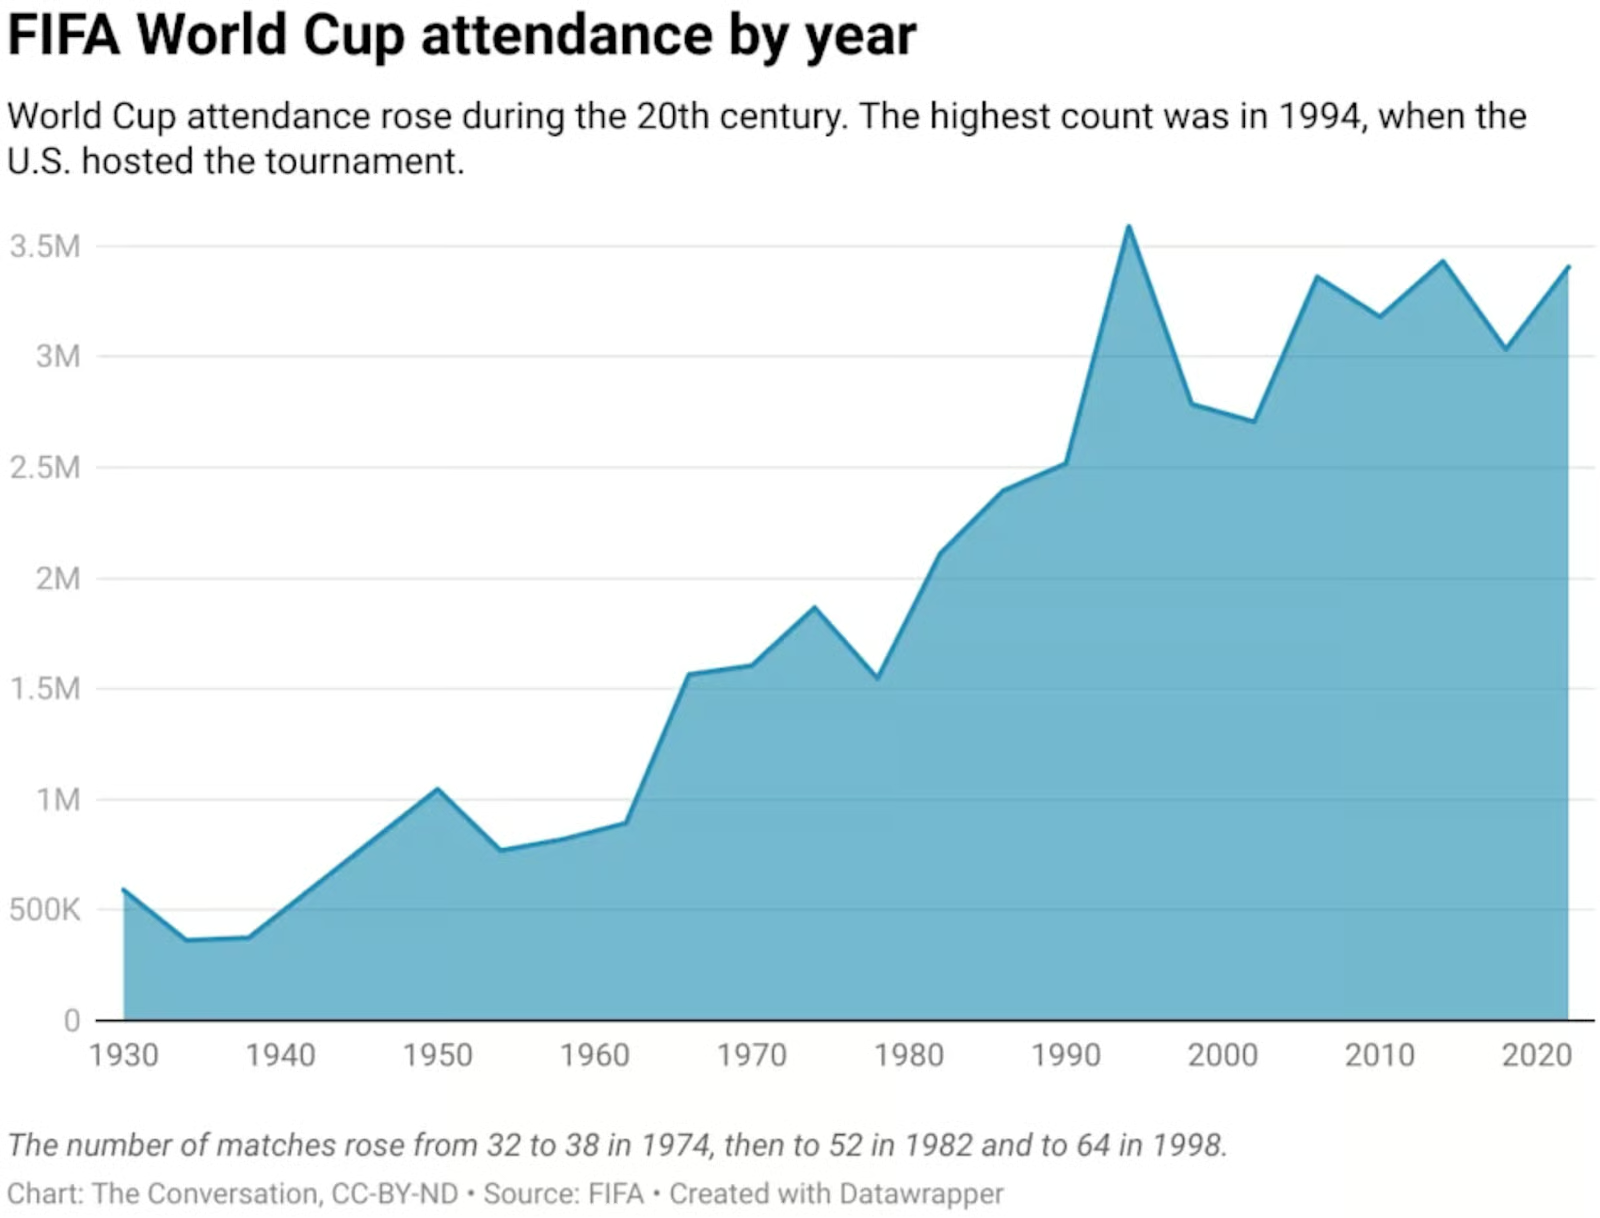
asyncio.run(digitize_chart(image_path))To test it out, I downloaded this chart from Yahoo Sports, which shows the FIFA World Cup attendance by year into a file named fifa.webp:
We execute the script as before, but by providing the name of a chart image as an argument:
python chart_digitizer.py fifa.webp Here’s the result:
Extracted DataFrame:
x y
0 1930 590000
1 1934 375000
2 1938 375000
3 1950 1040000
4 1954 770000
5 1958 820000
6 1962 890000
7 1966 1560000
8 1970 1600000
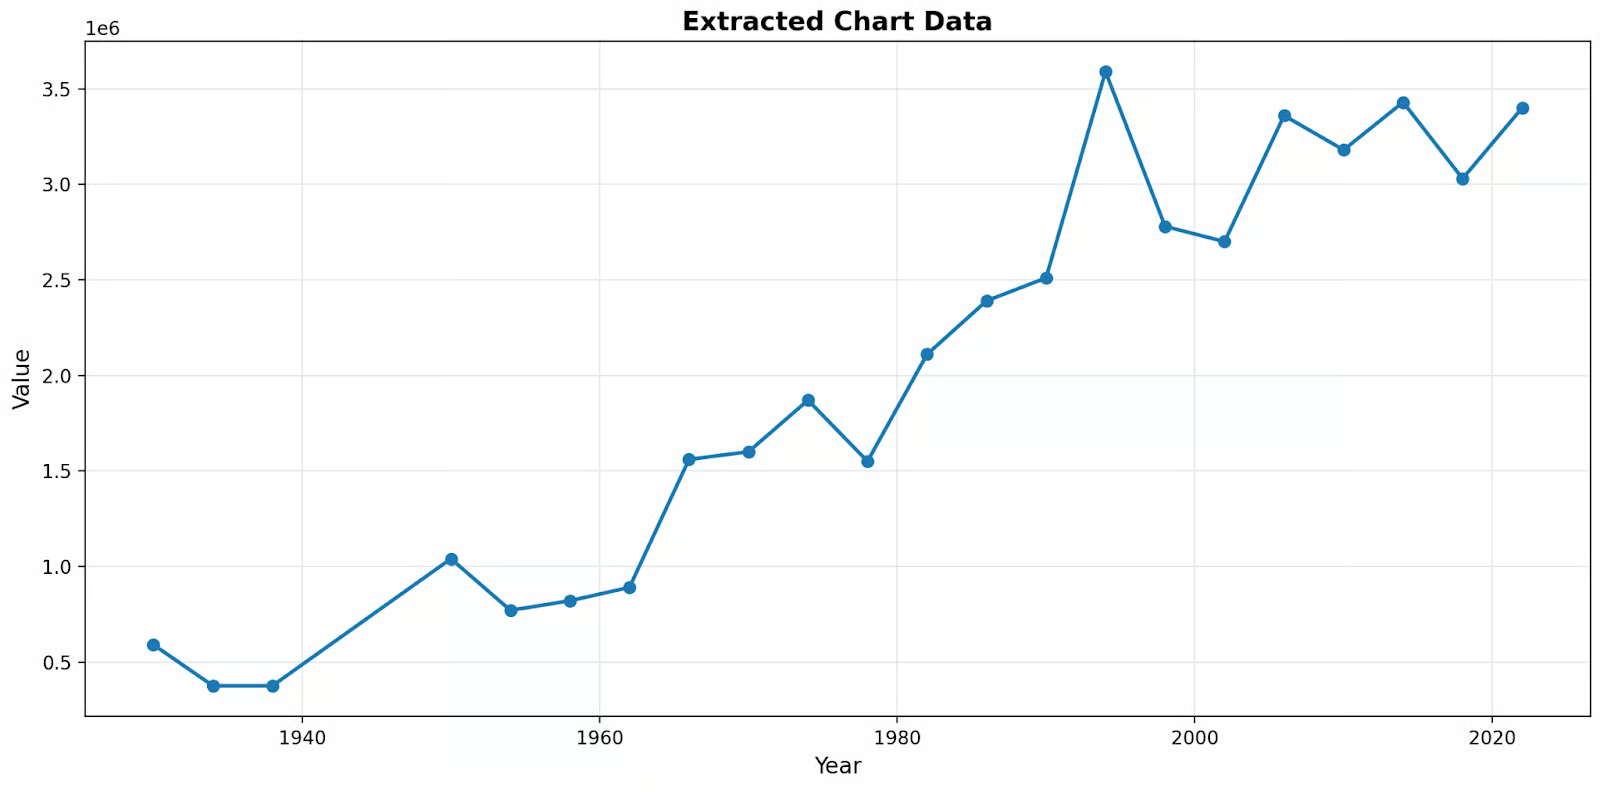
9 1974 1870000If we plot this, we can verify that it’s very accurate even though the original chart didn’t have labels on the y-axis.
We've successfully transitioned from building a simple asynchronous chatbot to building a highly robust visual reasoning engine for data science.
Because the model doesn't require downsampling, it can read complex charts without losing sub-pixel fidelity. I recommend testing this codebase with various complex graphs to truly appreciate its capabilities!
As I tested the model on multiple charts, I was particularly impressed by its accuracy. This script shouldn’t be treated as a final product, as there’s still plenty of room for improvement. If you want to practice your skills, here are a couple of suggestions:
If you’re interested in programming using Anthropic’s models, I highly recommend you take our Software Development with Claude Code course!
Agentic AI Courses
Tracks
Courses
Courses
blogs
Josef Waples
10分钟
blogs
Matt Crabtree
10分钟
blogs
Alex Olteanu
8分钟
blogs
Josef Waples
9分钟
Tutorials
Abid Ali Awan
Tutorials
Abid Ali Awan