

制作 Python 柱状图的多种方式
下面看看如何使用一些最受欢迎的 Python 库来创建和定制柱状图。每个库都提供独特特性和不同层级的定制能力。
使用 Matplotlib 创建柱状图
我将从 Matplotlib 开始,它是 Python 的基础绘图库,提供大量定制选项。
基础柱状图
开始使用 Matplotlib 时,您需要导入相关库。Matplotlib 的 pyplot 模块提供用于 创建图表 的函数。本示例中,我们使用一些示例数据,展示人们对不同可视化库的偏好人数。这里,library 列表保存库名称,作为 x 轴标签;chosen_by 列表包含相应的爱好者人数,作为 y 轴柱高。
import matplotlib.pyplot as plt
# Number of preferences for different libraries
library = ['Matplotlib', 'Seaborn', 'Plotly', 'Plotnine']
chosen_by = [2500, 1800, 3000, 2200]创建垂直柱状图时,调用 plt.bar() 并传入库名与偏好数据即可。我选择 skyblue 颜色。plt.xlabel()、plt.ylabel() 和 plt.title() 用于添加 x、y 轴标签并设置图表标题。最后用 plt.show() 显示图表。
# Vertical Bar Plot
plt.bar(library, chosen_by, color='skyblue')
plt.xlabel('Visualization Library')
plt.ylabel('Number of Enthusiasts')
plt.title('Which Visualization Library Do People Prefer?')
plt.show()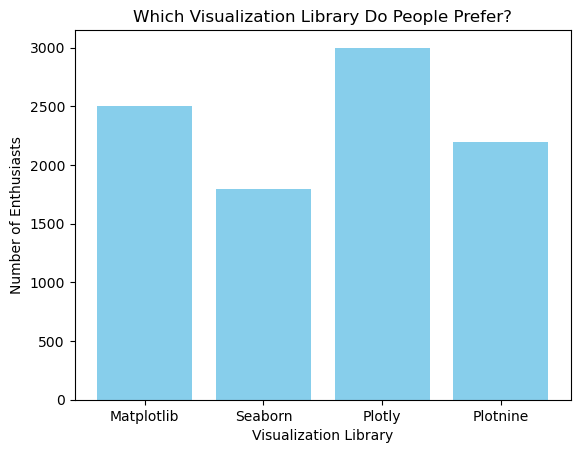
类似地,您可以使用 plt.barh() 创建水平柱状图。本例中我将柱子设为浅绿色。
# Horizontal Bar Plot
plt.barh(library, chosen_by, color='lightgreen')
plt.xlabel('Visualization Library')
plt.ylabel('Number of Enthusiasts')
plt.title('Which Visualization Library Do People Prefer?')
plt.show()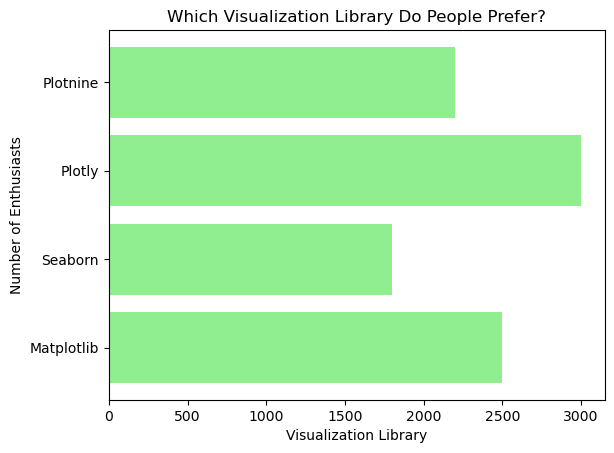
高级定制
Matplotlib 支持广泛的定制,例如添加标注、定制坐标轴标签、标题和图例。比如,您可以用 plt.text() 为每个柱子添加标注,将文本放在指定坐标处。
plt.bar(library, chosen_by, color='skyblue')
plt.xlabel('Visualization Library')
plt.ylabel('Number of Enthusiasts')
plt.title('Which Visualization Library Do People Prefer?')
# Adding annotations
for i, value in enumerate(chosen_by):
plt.text(i, value + 5, str(value), ha='center')
plt.show()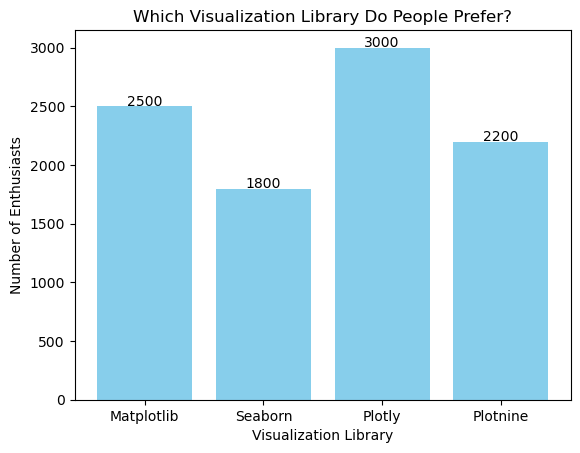
在上述代码中,plt.text() 用于在每个柱子上方显示爱好者数量。enumerate() 提供每个柱子的索引和值,确保文本位置正确。
分组与堆叠柱状图
要用 Matplotlib 创建分组和堆叠柱状图,可以通过额外参数表示多类别,例如不同地区或人群。假设您有不同地区对可视化库受欢迎度的数据。对于分组柱状图,分别为每个地区定义数据集,并使用 bar_width 控制柱间距离与对齐,将每组柱子并排放置便于比较。
import numpy as np
# Define library names
library = ['Matplotlib', 'Seaborn', 'Plotly', 'Plotnine']
# Number of Enthusiasts for different regions
enthusiasts_north = [2000, 1500, 2500, 2000]
enthusiasts_south = [1500, 1300, 2000, 1800]
bar_width = 0.35
x = np.arange(len(library))
# Grouped Bar Plot
plt.bar(x - bar_width/2, enthusiasts_north, bar_width, label='North Region', color='skyblue')
plt.bar(x + bar_width/2, enthusiasts_south, bar_width, label='South Region', color='lightgreen')
# Adding labels and title
plt.xlabel('Visualization Library')
plt.ylabel('Number of Enthusiasts')
plt.title('Regional Preferences for Visualization Libraries (Grouped)')
plt.xticks(x, library)
plt.legend(title='Regions')
plt.show()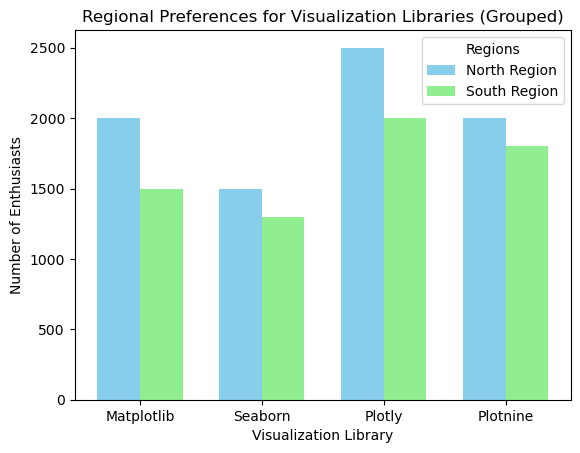
在这个示例中,x = np.arange(len(library)) 创建柱子的位置数组。两次调用 plt.bar() 分别绘制各地区的柱形,plt.xticks() 设置 x 轴标签。plt.legend() 显示图例区分地区。
对于堆叠柱状图,可以使用 bottom 参数将一组数据叠加在另一组之上。以下示例展示将不同地区的爱好者数量在每个库上进行堆叠的可视化。
# Define library names
library = ['Matplotlib', 'Seaborn', 'Plotly', 'Plotnine']
# Number of Enthusiasts for different regions
enthusiasts_north = [2000, 1500, 2500, 2000]
enthusiasts_south = [1500, 1300, 2000, 1800]
x = np.arange(len(library))
# Stacked Bar Plot
plt.bar(x, enthusiasts_north, label='North Region', color='skyblue')
plt.bar(x, enthusiasts_south, bottom=enthusiasts_north, label='South Region', color='lightcoral')
# Adding labels and title
plt.xlabel('Visualization Library')
plt.ylabel('Number of Enthusiasts')
plt.title('Regional Preferences for Visualization Libraries (Stacked)')
plt.legend()
plt.show()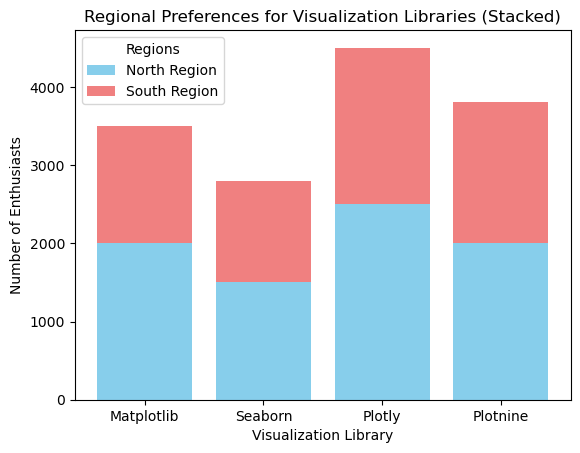
在此堆叠图中,enthusiasts_south 表示南部地区的数据,而 enthusiasts_north 作为北部地区的基底数据。先调用一次 plt.bra() 为北部地区创建柱形,再次调用以将南部地区柱形堆叠其上。
若想更系统地了解 Matplotlib 的使用方法,您可以查看我们的课程 Introduction to Data Visualization with Matplotlib。另外还有 Matplotlib 速查表,将流程拆解为六个基本步骤。
使用 Seaborn 创建柱状图
Seaborn 基于 Matplotlib 构建,能更简单地创建高颜值的柱状图。
基础柱状图
Seaborn 的 barplot() 函数使得用极少代码即可创建基础柱状图。首先导入 Seaborn,并创建一个字典。
import seaborn as sns
data = {'Library': library, 'Chosen by': chosen_by}然后使用 sns.barplot() 创建柱状图,指定 x、y 变量及数据来源。这里我使用 viridis 调色板。
sns.barplot(x='Library', y='Chosen by', data=data, palette='viridis')
plt.title('Which Visualization Library Do People Prefer?')
plt.xlabel('Visualization Library')
plt.ylabel('Number of Enthusiasts')
plt.show()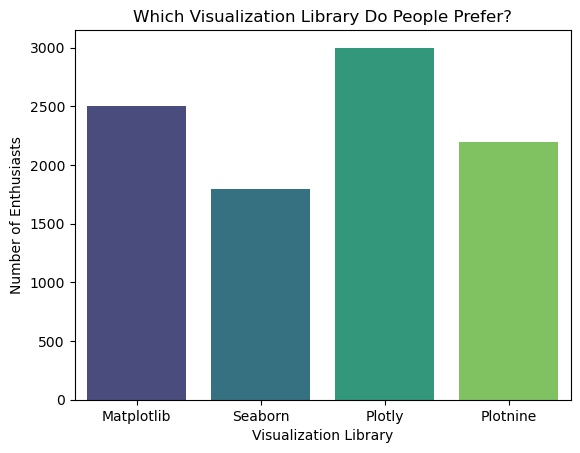
您也可以不设置 palette,得到统一颜色的图表;或者更好地,直接为柱状图指定颜色。本例中我将使用十六进制色值:
sns.barplot(x='Library', y='Chosen by', data=data, color=’#5EB1FF’)
plt.title('Which Visualization Library Do People Prefer?')
plt.xlabel('Visualization Library')
plt.ylabel('Number of Enthusiasts')
plt.show()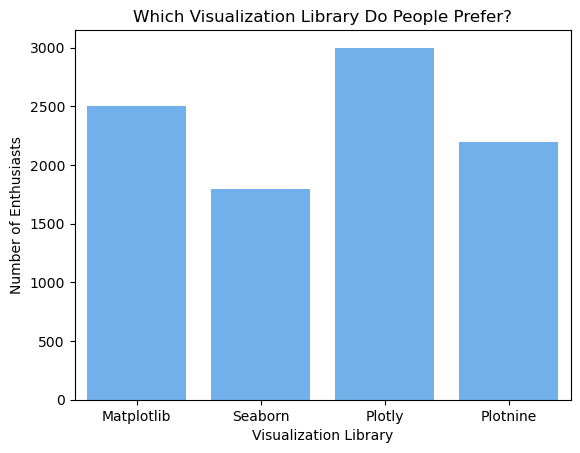
高级定制
Seaborn 当然也支持丰富的定制选项,包括颜色与标注。例如,您可以像在 Matplotlib 中那样为柱状图添加标注。
# Customized Bar Plot
sns.barplot(x='Library', y='Chosen by', data=data, palette='viridis')
plt.xlabel('Visualization Library')
plt.ylabel('Number of Enthusiasts')
plt.title('Which Visualization Library Do People Prefer?')
# Adding annotations
for i, value in enumerate(chosen_by):
plt.text(i, value + 5, str(value), ha='center')
plt.show()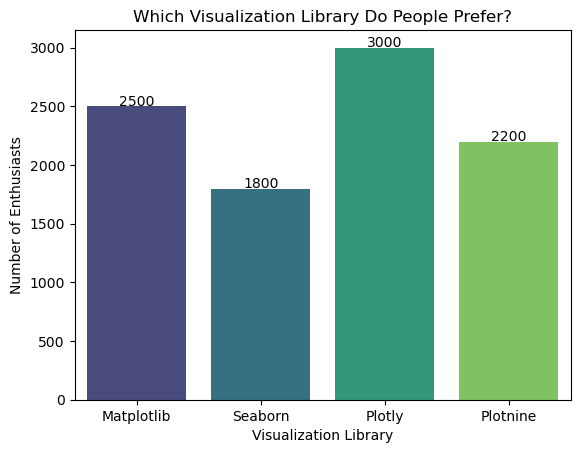
在此示例中,palette='viridis' 更改柱子的配色方案,plt.text() 则为每个柱子添加标注。
想了解更多,可查看我们的 Introduction to Data Visualization with Seaborn 课程。要让 Seaborn 柱状图更出彩,可以参考我们的 Seaborn 调色板速览:选色快速指南获取灵感。
使用 Plotly 创建柱状图
接下来是 Plotly,它以创建交互式、动态可视化(包括柱状图)而闻名。
基础柱状图
使用 Plotly 创建基础柱状图时,可使用 graph_objects 模块。我们导入所需模块,并用天蓝色作为柱子的颜色创建柱状图。
import plotly.graph_objects as go
fig = go.Figure(go.Bar(x=library, y=chosen_by, marker_color='skyblue'))
fig.update_layout(title='Which Visualization Library Do People Prefer?', xaxis_title='Visualization Library', yaxis_title='Number of Enthusiasts')
fig.show()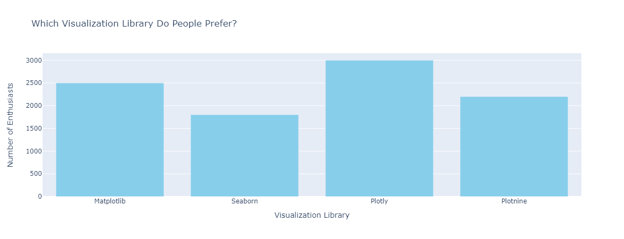
高级定制
Plotly 提供多种方法增强柱状图的交互性与外观。例如,您可以用 fig.add_annotation() 为柱子添加标注。
fig = go.Figure(go.Bar(x=library, y=chosen_by, marker_color='skyblue'))
fig.update_layout(title='Which Visualization Library Do People Prefer?', xaxis_title='Visualization Library', yaxis_title='Number of Enthusiasts')
# Adding annotations
for i, value in enumerate(chosen_by):
fig.add_annotation(x=library[i], y=value, text=str(value), showarrow=False, yshift=10)
fig.show()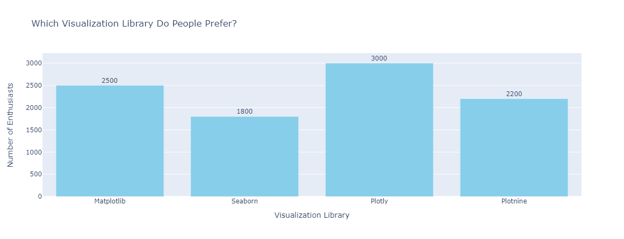
动态与交互式柱状图
Plotly 可以创建实时更新的动态柱状图,非常适合仪表板。借助 Plotly Express(Plotly 的高层接口),您可以用极少代码创建交互式柱状图。
import plotly.express as px
# Using a sample dataset from Plotly
df = px.data.gapminder().query("year == 2007")
fig = px.bar(df, x='continent', y='pop', color='continent', hover_name='country', title='Population by Continent in 2007')
fig.show()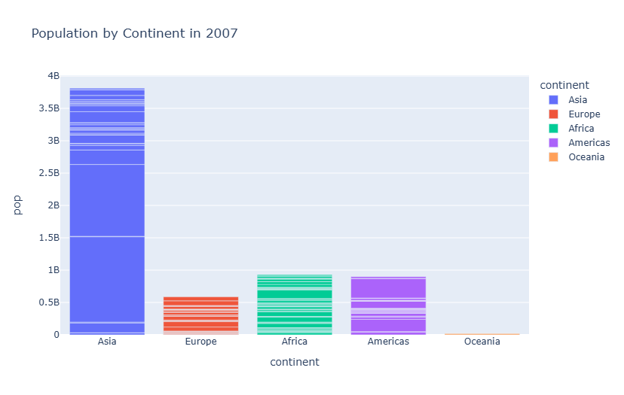
在此示例中,px.data.gapminder() 从 Plotly 载入示例数据集。px.bar() 根据指定的 x、y 变量、颜色、悬停名称和标题创建交互式柱状图。 如果您想了解更多,我们在 DataCammp 提供了详细课程:Introduction to Data Visualization with Plotly。
使用 Plotnine 创建柱状图
Plotnine 是 Python 中对图形语法(grammar of graphics)的实现,灵感来自 R 的 ggplot2。它允许通过组合不同图层,以声明式方式创建复杂图形。
基础柱状图
要开始使用 Plotnine,先导入所需库并创建一个 DataFrame。然后定义 ggplot 对象,添加 geom_bar 图层,并指定映射。
from plotnine import ggplot, aes, geom_bar, labs
import pandas as pd
# Number of preferences for different libraries
data = pd.DataFrame({'Library': ['Matplotlib', 'Seaborn', 'Plotly', 'Plotnine'],
'Chosen by': [2500, 1800, 3000, 2200]})
# Basic Bar Plot
ggplot(data, aes(x='Library', y='Chosen by')) + geom_bar(stat='identity', fill='skyblue') + labs(title='Which Visualization Library Do People Prefer?', x='Visualization Library', y='Number of Enthusiasts')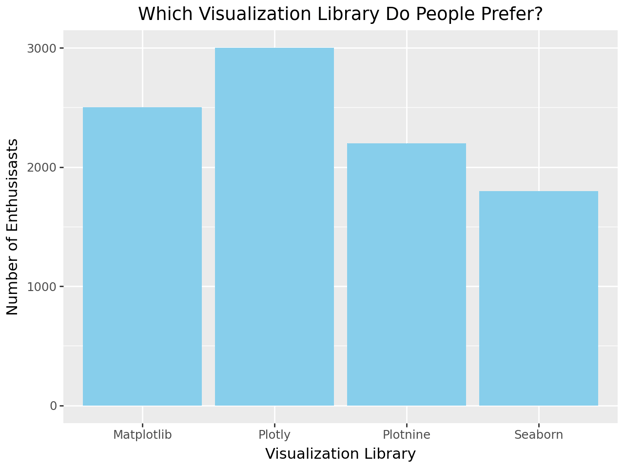
在此示例中,aes(x='Library', y='Chosen by') 设置图表的 x、y 映射。geom_bar(stat='identity', fill='skyblue') 创建填充为天蓝色的柱状图。
高级定制
您可以利用 Plotnine 的分层方法进行定制,添加标注、坐标轴标签、标题和图例。
from plotnine import ggplot, aes, geom_bar, geom_text, labs
# Creating our Pandas DataFrame
data = pd.DataFrame({'Library': ['Matplotlib', 'Seaborn', 'Plotly', 'Plotnine'],
'Chosen by': [2500, 1800, 3000, 2200]})
# Basic Bar Plot with labels
(ggplot(data, aes(x='Library', y='Chosen by'))
+ geom_bar(stat='identity', fill='skyblue')
+ geom_text(aes(label='Chosen by'), va='bottom', size=10, nudge_y=5) # Adds labels on top of bars
+ labs(title='Which Visualization Library Do People Prefer?', x='Visualization Library', y='Number of Enthusiasts'))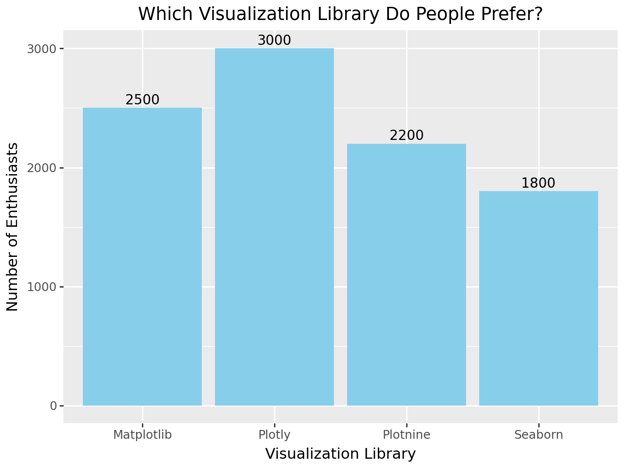
分组与堆叠柱状图
Plotnine 也支持分组和堆叠柱状图。对于分组柱状图,您需要先定义一个用于分组的分类变量。
# Number of preferences for different libraries in different regions
data = pd.DataFrame({'Library': ['Matplotlib', 'Plotly', 'Plotnine', 'Seaborn'] * 2,
'Chosen by': [2000, 1500, 2500, 2000, 1500, 1300, 2000, 1800],
'Region': ['North', 'North', 'North', 'North', 'South', 'South', 'South', 'South']})
# Grouped Bar Plot
(ggplot(data, aes(x='Library', y='Chosen by', fill='Region'))
+ geom_bar(stat='identity', position='dodge')
+ labs(title='Regional Preferences for Visualization Libraries (Grouped)', x='Visualization Library', y='Number of Enthusiasts'))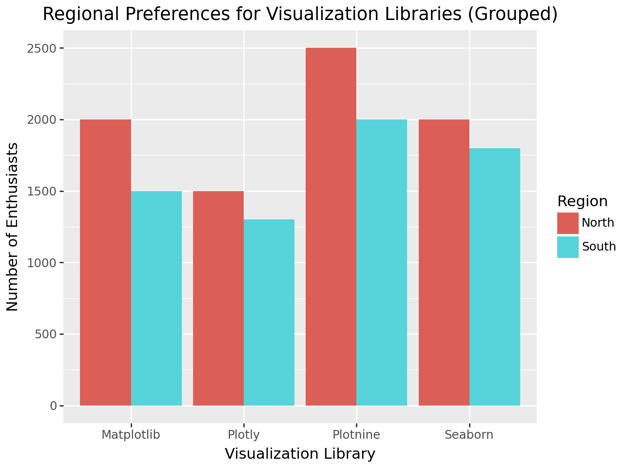
对于堆叠柱状图,使用 position = 'stack' 即可。
# Stacked Bar Plot
(ggplot(data, aes(x='Library', y='Chosen by', fill='Region'))
+ geom_bar(stat='identity', position='stack')
+ labs(title='Regional Preferences for Visualization Libraries (Stacked)', x='Visualization Library', y='Number of Enthusiasts'))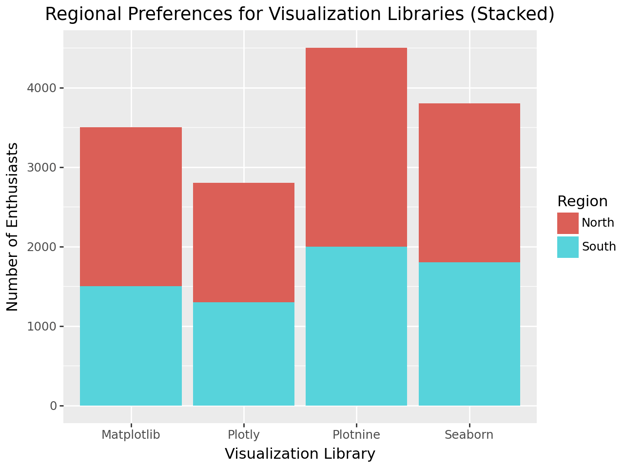
可以看到,这里 position = 'dodge' 生成分组柱,而 position = 'stack' 则将柱子堆叠。
使用 Pandas 创建柱状图
最后是 Pandas。Pandas 可直接从 DataFrame 创建柱状图,是快速绘制基础图形的便捷选项。
基础柱状图
在 Pandas 中,可对 DataFrame 使用 plot.bar() 创建柱状图。
import pandas as pd
data = pd.DataFrame({'Library': ['Matplotlib', 'Seaborn', 'Plotly', 'Plotnine'],
'Chosen by': [2500, 1800, 3000, 2200]})然后使用 plot.bar() 创建柱状图。
# Basic Bar Plot
data.plot.bar(x='Library', y='Chosen by', color='skyblue', title='Which Visualization Library Do People Prefer?')
plt.xlabel('Visualization Library')
plt.ylabel('Number of Enthusiasts')
plt.show()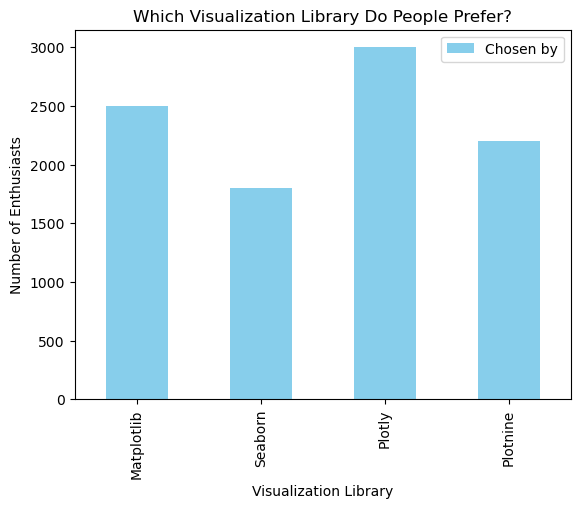
高级定制
Pandas 可通过额外参数与与 Matplotlib 的结合来定制柱状图。
# Customized Bar Plot
ax = data.plot.bar(x='Library', y='Chosen by', color='skyblue', title='Which Visualization Library Do People Prefer?')
ax.set_xlabel('Visualization Library')
ax.set_ylabel('Number of Enthusiasts')
# Adding annotations
for i in ax.containers:
ax.bar_label(i, label_type='edge')
plt.show()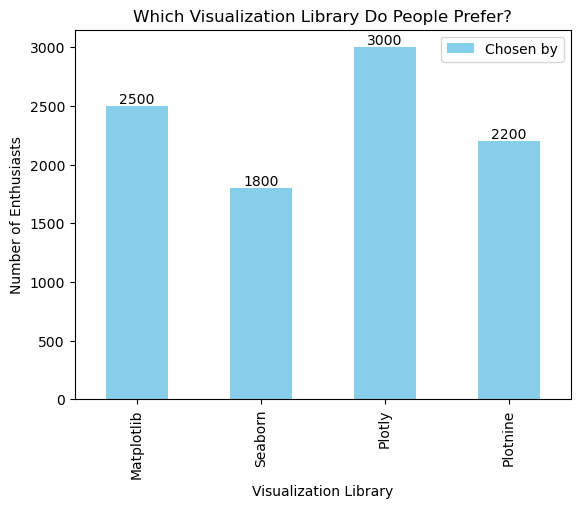
在此示例中,ax.bar_label(i, label_type='edge') 为柱子添加标注,在每个柱子的顶部显示数值。
分组与堆叠柱状图
在 Pandas 中创建分组与堆叠柱状图也很直接。对于分组柱状图,需要将 DataFrame 透视为每个分组单独的列。
# Number of preferences for different libraries in different regions
data = pd.DataFrame({'Library': ['Matplotlib', 'Seaborn', 'Plotly', 'Plotnine'],
'North Region': [2000, 1500, 2500, 2000],
'South Region': [1500, 1300, 2000, 1800]})
# Grouped Bar Plot
data.plot.bar(x='Library', y=['North Region', 'South Region'], title='Regional Preferences for Visualization Libraries (Grouped)')
plt.xlabel('Visualization Library')
plt.ylabel('Number of Enthusiasts')
plt.show()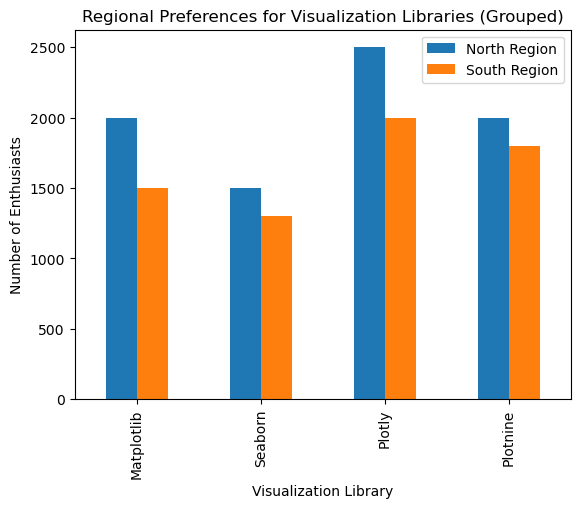
要绘制堆叠柱状图,设置 stacked=True。
# Stacked Bar Plot
data.plot.bar(x='Library', y=['North Region', 'South Region'], stacked=True, title='Regional Preferences for Visualization Libraries (Stacked)')
plt.xlabel('Visualization Library')
plt.ylabel('Number of Enthusiasts')
plt.show()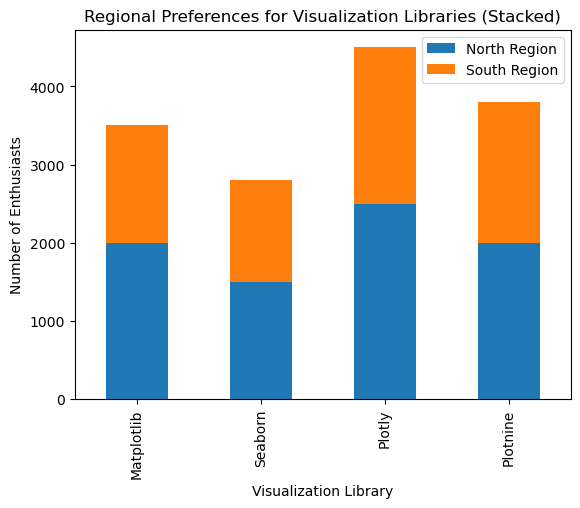
设计高效 Python 柱状图的最佳实践
创建柱状图并不难,但要让图表高效且富有洞见,就需要注重细节。以下指南可帮助您创建能够有效传达数据故事的柱状图。
- 避免常见错误:设计柱状图时避免信息过载,保持清晰有效。聚焦关键信息,避免杂乱。轴向保持一致刻度。确保坐标轴从零开始,避免夸大差异而误导读者。
- 选择颜色与高亮:选择能为数据赋予含义的颜色,如红色表示负值、绿色表示正值。相关图表应保持一致配色,方便读者跟随叙事。用颜色突出重要洞见。
- 通过排序提高清晰度:根据数据语境进行合乎逻辑的排序,例如时间序列按时间顺序,或按降序/升序强调趋势。将相关柱子分组,并用颜色或间距加以区分。
结语
掌握柱状图的创建与定制是每位数据从业者的必备技能。遵循本文的指南与最佳实践,您可以创建清晰、信息量足且美观的柱状图,有效传达数据洞见。这将帮助您更有效地呈现数据并做出更明智的决策。
如果您想继续练习 Python 数据可视化能力,可以学习我们的 Intro to Python for Data Science 课程,为初学者提供良好起点;或者查看我们的 Python Programming 技能路径,系统掌握 Python。

资深数据从业者与写作者,热衷于帮助有志于数据领域的专业人士成长与精进。
Python 柱状图常见问题
什么是 Python 柱状图?它为什么有用?
柱状图使用矩形条来表示分类数据,条形的长度或高度对应类别的取值。它适用于比较类别、可视化分布以及发现趋势或离群点。
我该如何在垂直与水平的 Python 柱状图之间进行选择?
当标签较短或易读时可使用垂直柱状图;当标签较长或类别较多时选择水平柱状图以避免拥挤。
本文将带您快速浏览 Python 中最常用的绘图库——Matplotlib、Seaborn、Plotly、Plotnine 和 Pandas——如何绘制柱状图。您可以直观看图,选择自己最喜欢的库。对每种方法,我都会从创建简单柱状图的基础开始,然后逐步介绍定制化技巧。
我会尽可能全面清晰,但请记住,在数据分析与数据科学中,柱状图只是众多图形中的一种。若想开阔视野、用真实数据集练习、获取广受认可的认证并开启相关职业生涯,欢迎今天就报名我们的 Associate Data Scientist in Python 职业路径。