When working with machine learning models, it's easy to try them all out without understanding what each model does and when to use them. In this cheat sheet, you'll find a handy guide describing the most widely used supervised machine learning models, their advantages, disadvantages, and some key use cases.
Have this cheat sheet at your fingertips
Download PDFSupervised Learning
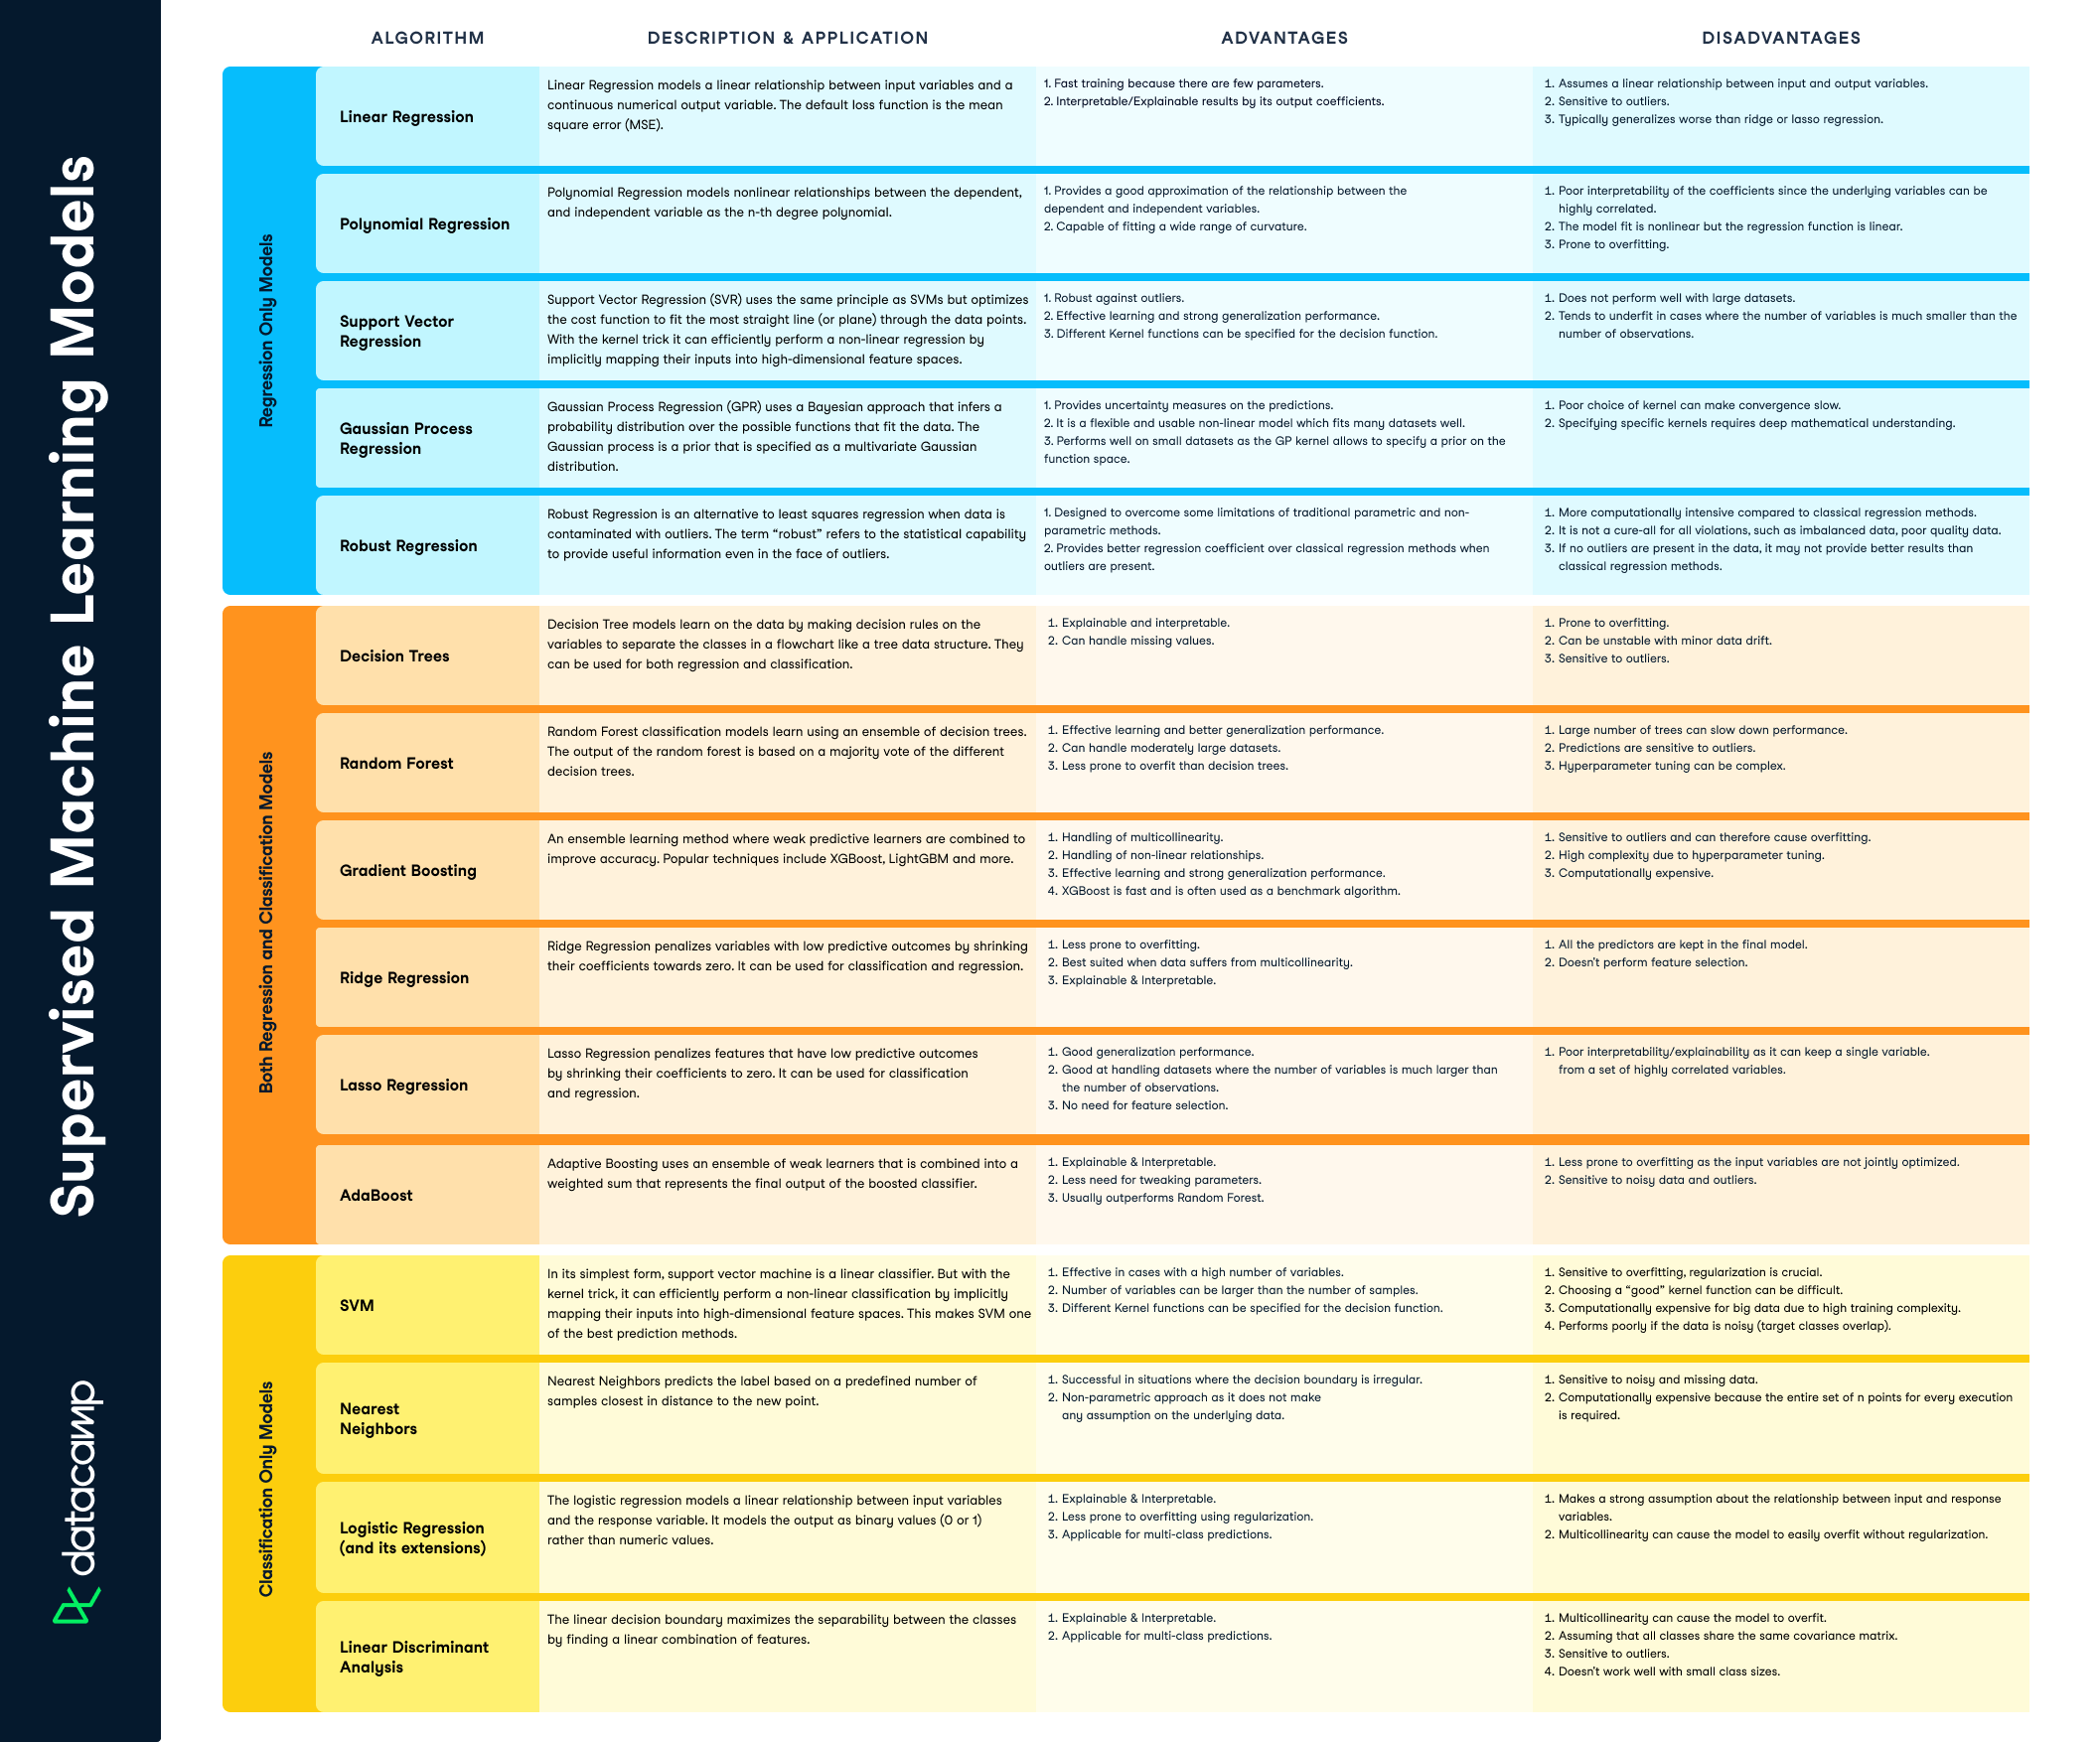
Supervised learning models are models that map inputs to outputs, and attempt to extrapolate patterns learned in past data on unseen data. Supervised learning models can be either regression models, where we try to predict a continuous variable, like stock prices—or classification models, where we try to predict a binary or multi-class variable, like whether a customer will churn or not. In the section below, we'll explain three popular types of supervised learning models: regression-only models, regression and classification models, and classification-only models.
Regression Only Models
| Algorithm | Description and Application | Advantages | Disadvantages |
| Linear Regression |
Linear Regression models a linear relationship between input variables and a continuous numerical output variable. The default loss function is the mean square error (MSE). |
|
|
| Polynomial Regression | Polynomial Regression models nonlinear relationships between the dependent, and independent variable as the n-th degree polynomial. |
|
|
| Support Vector Regression | Support Vector Regression (SVR) uses the same principle as SVMs but optimizes the cost function to fit the most straight line (or plane) through the data points. With the kernel trick it can efficiently perform a non-linear regression by implicitly mapping their inputs into high-dimensional feature spaces. |
|
|
| Gaussian Process Regression | Gaussian Process Regression (GPR) uses a Bayesian approach that infers a probability distribution over the possible functions that fit the data. The Gaussian process is a prior that is specified as a multivariate Gaussian distribution. |
|
|
| Robust Regression | Robust Regression is an alternative to least squares regression when data is contaminated with outliers. The term “robust” refers to the statistical capability to provide useful information even in the face of outliers. |
|
|
Both Regression and Classification Models
| Algorithm | Description and Application | Advantages | Disadvantages |
| Decision Trees | Decision Tree models learn on the data by making decision rules on the variables to separate the classes in a flowchart like a tree data structure. They can be used for both regression and classification. |
|
|
| Random Forest | Random Forest classification models learn using an ensemble of decision trees. The output of the random forest is based on a majority vote of the different decision trees. |
|
|
| Gradient Boosting | An ensemble learning method where weak predictive learners are combined to improve accuracy. Popular techniques include XGBoost, LightGBM and more. |
|
|
| Ridge Regression | Ridge Regression penalizes variables with low predictive outcomes by shrinking their coefficients towards zero. It can be used for classification and regression. |
|
|
| Lasso Regression | Lasso Regression penalizes features that have low predictive outcomes by shrinking their coefficients to zero. It can be used for classification and regression. |
|
|
| AdaBoost | Adaptive Boosting uses an ensemble of weak learners that is combined into a weighted sum that represents the final output of the boosted classifier. |
|
|
Classification Only Models
| Algorithm | Description and Application | Advantages | Disadvantages |
| SVM | In its simplest form, support vector machine is a linear classifier. But with the kernel trick, it can efficiently perform a non-linear classification by implicitly mapping their inputs into high-dimensional feature spaces. This makes SVM one of the best prediction methods. |
|
|
| Nearest Neighbors | Nearest Neighbors predicts the label based on a predefined number of samples closest in distance to the new point. |
|
|
| Logistic Regression (and its extensions) | The logistic regression models a linear relationship between input variables and the response variable. It models the output as binary values (0 or 1) rather than numeric values. |
|
|
| Linear Discriminant Analysis | The linear decision boundary maximizes the separability between the classes by finding a linear combination of features. |
|
|
Have this cheat sheet at your fingertips
Download PDF