

How to Install RStudio
To install and start working in RStudio, we need first to download and install the R programming language itself. To download and install R, follow the steps below:
- Open The Comprehensive R Archive Network (CRAN), which is the official R website.
- In the upper part of the screen, find the section Download and Install R.
- Click the link corresponding to your operating system.
- Select the latest release.
- Open the downloaded file and follow simple installation instructions leaving default options everywhere.
To download and install RStudio, follow these steps:
- Open the download page of the official Posit website.
- You'll see that your operating system is automatically identified. Under "Install RStudio", choose your OS version in the dropdown menu.
- Click DOWNLOAD RSTUDIO DESKTOP FOR [YOUR OS].
- Open the downloaded file and follow the installation instructions. You can opt for defaults everywhere.
Getting Familiar with RStudio
Now that RStudio is installed, open it and take a tour of the main panes, tabs, and tools you’ll use every day.
RStudio interface
Opening RStudio will automatically launch R software. The platform interface looks as follows:
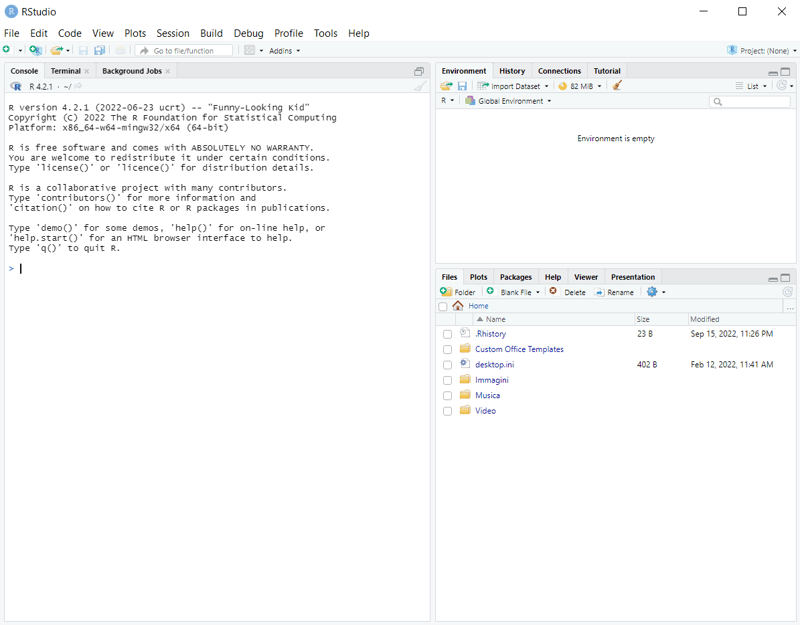
The RStudio window is divided into four panes. When you first open RStudio, you’ll see three, because the Source editor appears only once you open or create a script.
- Source editor (top left): where you write and save scripts
- Console (bottom left, with Terminal and Background Jobs tabs): where code runs and results appear
- Environment pane (top right): includes tabs such as Environment and History
- Files pane (bottom right): includes tabs such as Files, Plots, Packages, Help, and Viewer
Note: The layout shown here is based on RStudio 2022.07.1+554. Tab names and arrangement may vary slightly in newer versions.
Let's take a closer look at the essential tabs.
Console
On this tab, we first see the information about the R version in use and also some basic commands to try. At the end of those descriptions, we can type our R code, press Enter, and get the result below the code line (e.g., try running 2*2 and see what happens).
In the console, you can do anything you’d do in any R program, such as running calculations, assigning variables, and loading data.
However, when we run our code directly in the console, it isn't saved for being reproduced further. If we need (and we usually do) to write a reproducible code to solve a specific task, we have to record and regularly save it in a script file rather than in the console.
We'll soon explore how to write scripts. For now, let's keep in mind that you should mostly use the console to test the code and install R packages since they only need to be installed once.
Environment
Whenever we define a new or re-assign an existing variable in RStudio, it's stored as an object in the workspace and gets displayed, together with its value, on the Environment tab in the top-right area of the RStudio window. Try running greeting <- "Hello, World!" in the console and see what happens on the Environment tab.
This also relates to more complex objects such as dataframes. When we import data as a dataframe (or create a dataframe from scratch), we see in the workspace not only the name of the new object but also the values and data type of each column. Moreover, we can display even more details about each object, such as its length and memory size.
In the example below, we created two variables in the console: greeting <- "Hello, World!" and my_vector <- c(1, 2, 3, 4). Note how they are displayed on the Environment tab:
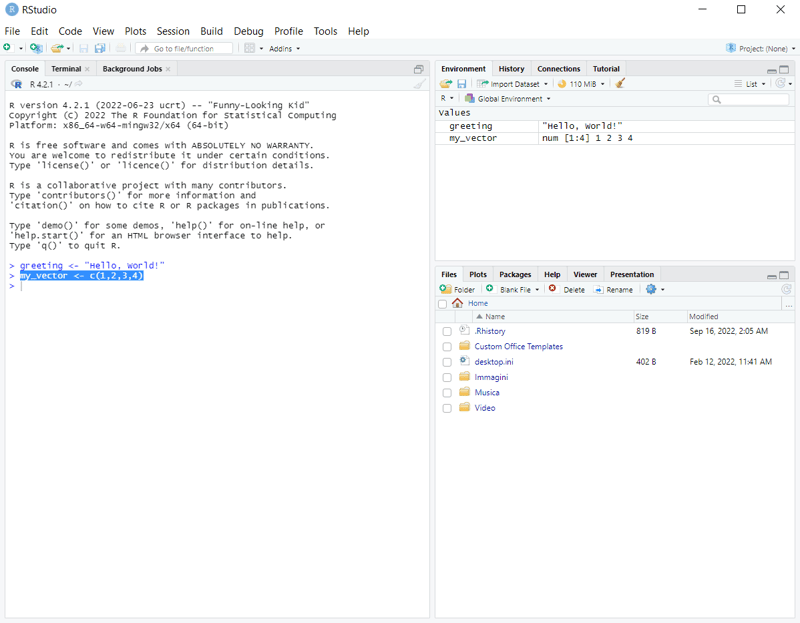
We can change the way of displaying our variables from List to Grid in the top-right corner of the tab, as follows:
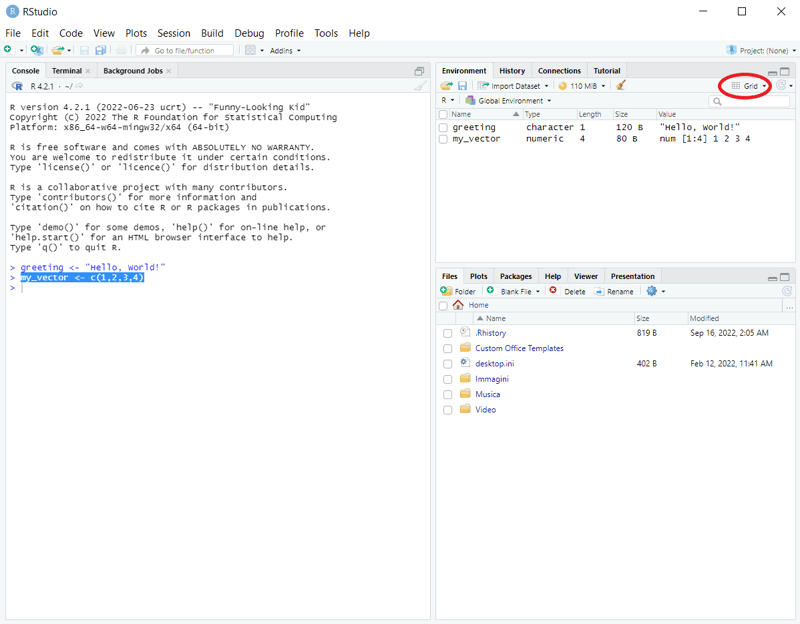
Note that now we can also see the length and size of each object.
In the Grid display mode, the box appears to the left of each variable. We can tick any of those boxes and click the Broom icon to remove the corresponding objects from the workspace:
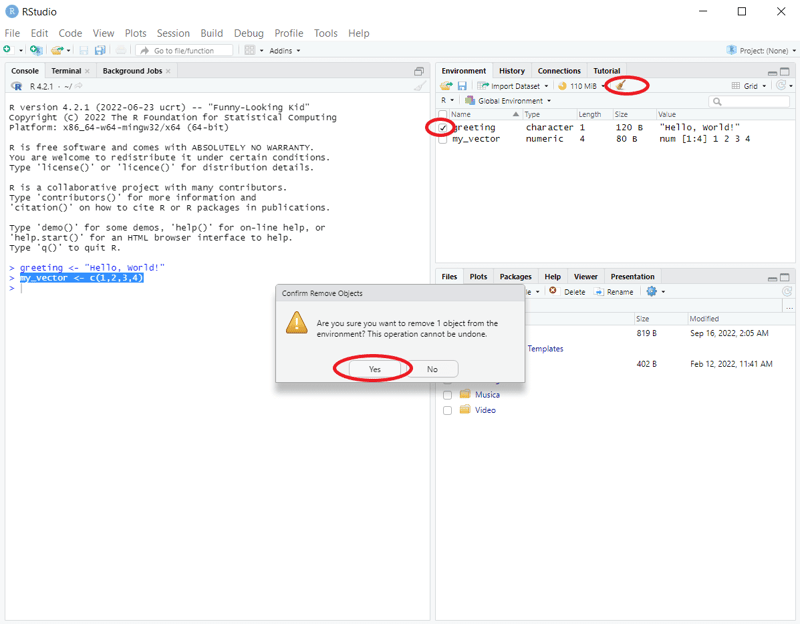
If we tick the box to the left of the Name column and click the Broom icon, or if we just click this icon in the previous display mode (List), we'll clean our workspace removing all the variables from it.
Other important tabs
- Terminal – to run commands from the terminal
- History – to track the history of all the operations performed during the current RStudio session
- Files – to see the structure of the working folder, reset the working folder, navigate between folders, etc.
- Plots – to preview and export created data visualizations
- Packages – to check what packages were loaded and load or unload packages (by switching on/off the box to the left of a package name)
How to write R scripts in RStudio
As we mentioned earlier, if we want to be able to reproduce and reuse our code for further needs, we should write it in a script file rather than directly in the console.
To start recording a script, click File – New File – R Script. This will open a text editor in the top-left corner of the RStudio interface (above the Console tab):
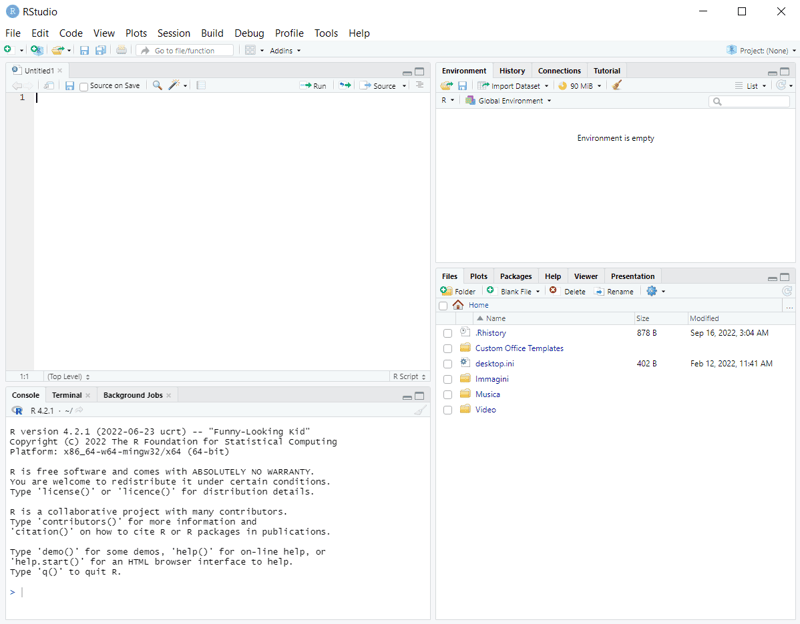
In a script, we can do everything we do in the console (and we can actually do the same things in any other R IDE), only that now our actions will be stored in a file for further usage or sharing. It's important to give a meaningful name to the script file and regularly save it (Ctrl + S in Windows/Linux, Cmd + S in Mac, File – Save in any operating system).
To run a single line of code from a script, put the cursor on that line and click the Run icon on the top-right of the text editor. Otherwise, use a keyboard shortcut (Ctrl + Enter in Windows/Linux, Cmd + Enter in Mac). To run multiple code lines, do the same after selecting the necessary lines. To run all code lines, use Ctrl + Alt + R (Cmd + Option + R on Mac) or choose Code > Run Region > Run All.
When we write a script, it makes sense to add code comments where necessary (using a hashtag symbol # followed by a line of a comment text) to explain to a potential future reader the why behind certain pieces of code.
Also, it's a good idea to add some important context at the beginning of the script: the author and contributors of the code, when it was written, when it was updated, the scope of the code, etc. Another helpful practice is to load all the needed R packages at the beginning of the script, just after providing the initial information.
For reproducible, publication-ready reports that combine code and narrative, R Markdown is the go-to tool—it works directly inside RStudio. Learn the basics in the R Markdown tutorial for beginners. For a comparison with Jupyter Notebooks, see Jupyter and R Markdown: Notebooks with R.
Getting help
To open documentation for a package, function, or built-in dataset, use ? or help() in the console, for example
?meanor
help("mean")The Help tab opens with the documentation. To list every function in a package, use
help(package = "dplyr")In RStudio: find and click the desired package name (even if it isn't loaded) on the Packages tab and see the result on the Help tab.
Basic Operations in RStudio: Packages, Data, and Plots
Now that you know your way around, let’s run through the tasks you’ll do most often: installing packages, importing and exploring data, and making plots. For each, we’ll show the R code and the RStudio shortcut. Paste the code into a script and run it line by line, except for package installs, which belong in the console.
Working with packages
Installing R packages
Syntax:
For example:
In RStudio:
- Remember to install all packages in the console rather than in a script file since they have to be installed on a computer's hard disk only once.
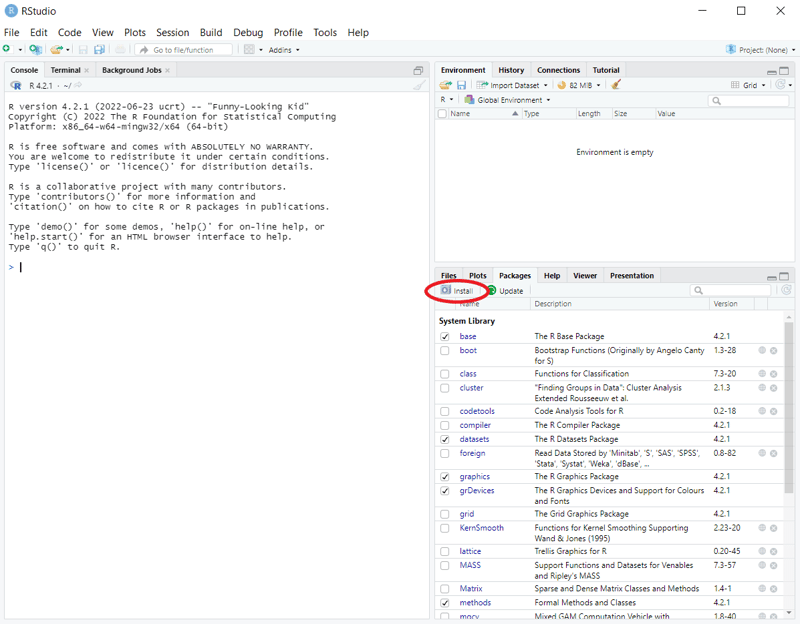
- You can install packages directly from the RStudio interface: open the Packages tab (the bottom-right area), click Install, and select the necessary packages from CRAN separated with a space or comma, as follows:
Loading R packages
Syntax:
For example:
The tidyverse is a popular collection of R packages for data science—including dplyr for data manipulation and ggplot2 for visualization. Learn more in the Tidyverse tutorial.
Note that while we used quotation marks for installing packages, we don't use them for loading packages.
In RStudio:
- Load all the necessary packages in a script file rather than in the console.
- Loading/unloading installed or system packages can be done by searching and ticking/unticking those packages on the Packages tab. Note that some packages can't be unloaded if they were imported by other packages.
Checking loaded R packages
Run in the console (.packages()) or search() to get a list of all the loaded packages.
In RStudio: open the Packages tab, search for a specific package, and check if the box to the left of its name is ticked.
Working with data
Creating data from scratch in R
Again, in this case, RStudio isn't different from any other R IDE.
To create a vector:
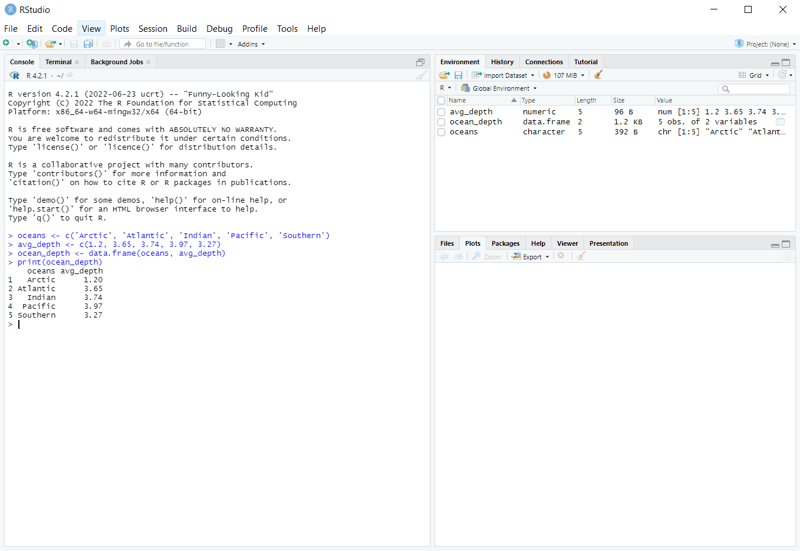
oceans <- c("Arctic", "Atlantic", "Indian", "Pacific", "Southern")
avg_depth <- c(1.2, 3.65, 3.74, 3.97, 3.27)(The above data was taken from Wikipedia.)
To create a dataframe:
Printing out the result:
The resulting vectors and dataframe also appears on the Environment tab of RStudio:
Accessing built-in R datasets
To see the full list of available sample datasets preloaded in R, including their names and short descriptions, run the following piece of code in the console:
You can take any of the appeared names and use each of them as a variable (containing a dataframe) to work with and practice your skills in R.
If you need more information about a selected preloaded dataset, run the help() function on it, e.g, help(CO2).
Importing data
Before running the code below, download the publicly available World Population Dataset from Kaggle, unzip it, and save world_population.csv in your working directory. That’s the folder where RStudio looks for files by default.
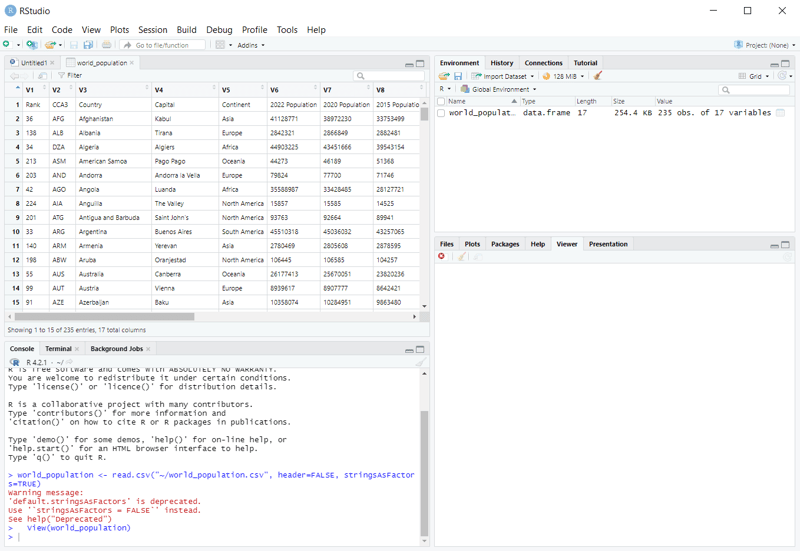
Running this code creates a dataframe named world_population in your Environment, where you can inspect it. The CSV file itself stays in your working folder.
Getting a “cannot open file” error? R is looking in a different folder than the one holding your file.
-
Run
getwd()to see where R is looking, then move the file there. -
Or, if your script is saved in the same folder as the CSV, choose Session > Set Working Directory > To Source File Location.
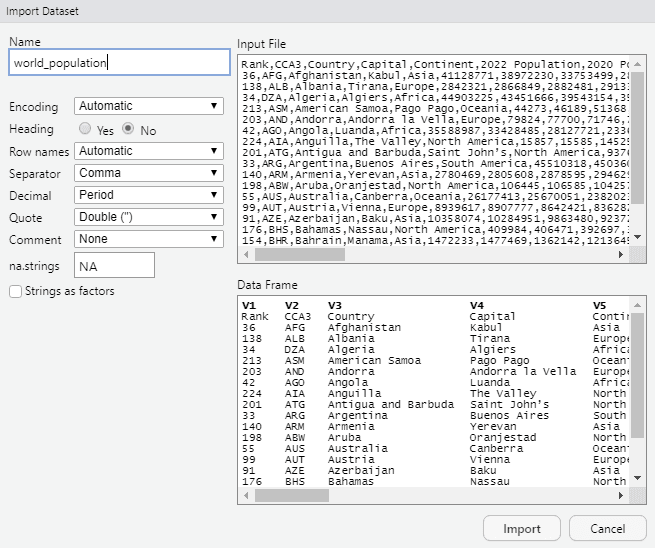
In RStudio: File – Import Dataset. Or else, click Import Dataset on the Environment tab.
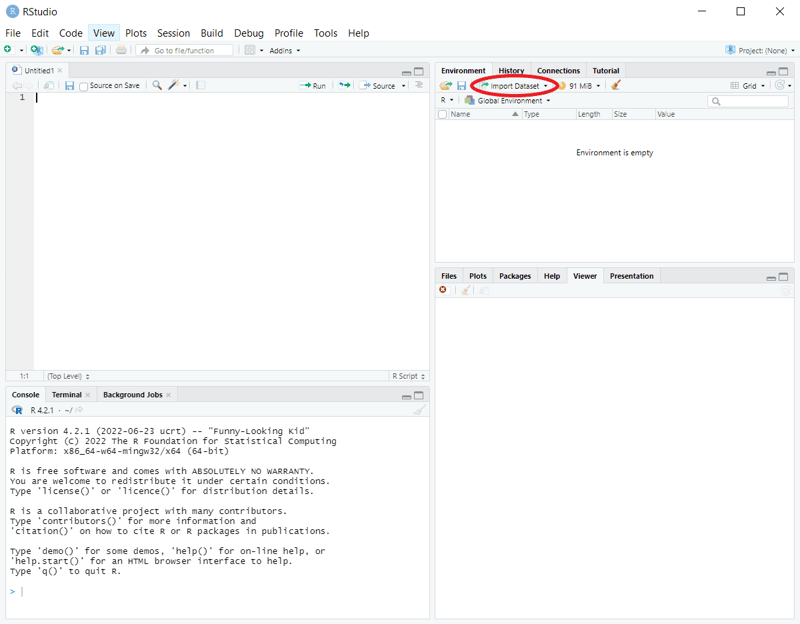
Then select From Text (base)..., navigate to the right folder, select the file to import, fill in or check the fields Name, Heading, Separator, and Decimal in the pop-up window, preview the dataset structure, and click Import:
You can now find and explore the imported dataset on the Environment tab and in a spreadsheet opened in a new tab:
If you want to learn more about how to import data with R, explore a well-rounded DataCamp skill track Importing & Cleaning Data with R. You can find various datasets to import and work with on DataLab, DataCamp's AI-enabled data notebook and an alternative to RStudio.
Wrangling and analyzing data in RStudio
Like in any other R IDE, in RStudio, we can access, manipulate, transform, analyze, and model the data in R. Below are some examples of standard operations performed on the CO2 built-in dataset:
head(CO2)
tail(CO2)
colnames(CO2)
dim(CO2)
str(CO2)
summary(CO2)
summary(CO2$uptake)
median(CO2$uptake)
class(CO2$uptake)
unique(CO2$Treatment)
subset(CO2, conc == min(CO2$conc))Try running them one by one in RStudio and observe the output.
Plotting data in RStudio
Like in any other R IDE, in RStudio, we can plot the data. Below are some examples of creating simple plots for the CO2 and Orange built-in datasets. In both cases, the resulting plot appears on the Plots tab and can be exported using the Export button of that tab:
- Creating a histogram:
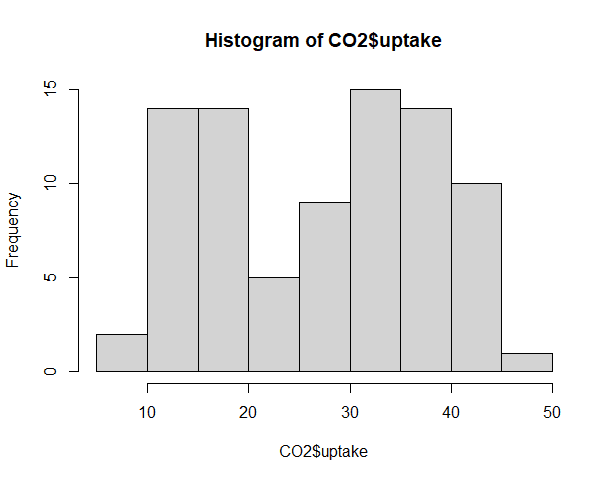 Creating a scatter plot:
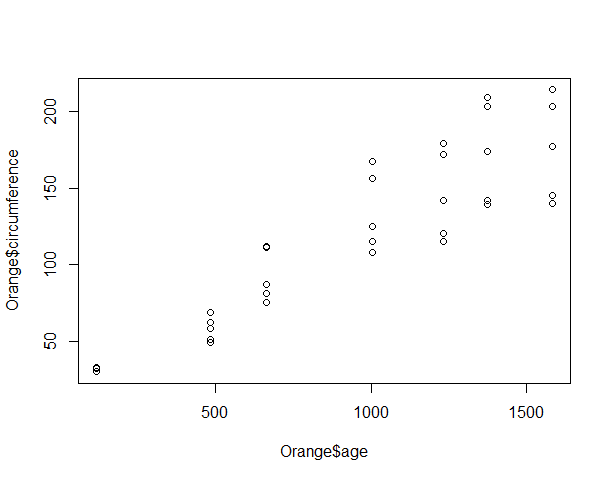
We can tune a few parameters available for the basic plot() function to add some aesthetics to the last plot:
plot(Orange$age, Orange$circumference,

     xlab="Age", ylab="Circumference",

     main="Circumference vs. Age",

     col="blue", pch=16)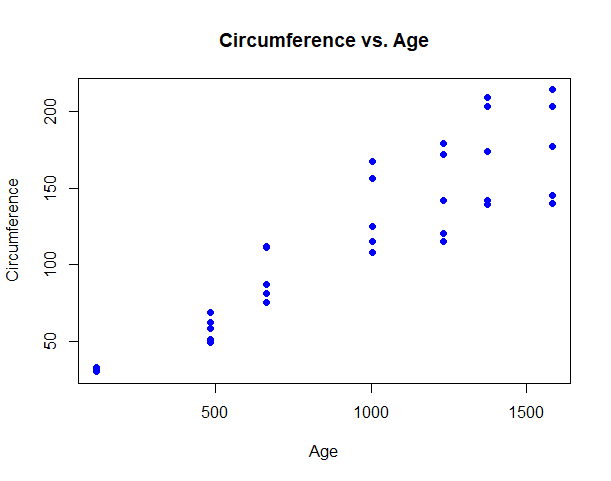
Or we can use ggplot2 or any other specialized data visualization package—R offers a vast choice. For a deep dive, see our ggplot2 tutorial or the DataCamp skill track Data Visualization with R.
Conclusion
In this tutorial, we explored plenty of essential aspects of using RStudio:
- What RStudio is and what advantages it has
- How to install RStudio
- What the RStudio interface looks like and how to use its main parts
- The difference between running code in the console and a script
- Where to find all the objects used in the current RStudio session
- The best practices for writing scripts
- How to perform various operations in RStudio, such as installing and loading R packages, importing data, wrangling, analyzing, and visualizing data, creating R objects from scratch, etc.
Now that you're familiar with RStudio, you can go ahead and start using it. For example, think about building your own R projects in RStudio. For more inspiration, check the article on Top R Project Ideas.
If you feel that you need more training in R before starting to create projects in RStudio, consider the following beginner-friendly R courses and tracks on DataCamp:

IBM Certified Data Scientist (2020), previously Petroleum Geologist/Geomodeler of oil and gas fields worldwide with 12+ years of international work experience. Proficient in Python, R, and SQL. Areas of expertise: data cleaning, data manipulation, data visualization, data analysis, data modeling, statistics, storytelling, machine learning. Extensive experience in managing data science communities and writing/reviewing articles and tutorials on data science and career topics.
FAQs
How do I download and install RStudio IDE?
To download RStudio IDE:
-
Install R first – Go to CRAN and download the version of R appropriate for your operating system (Windows, macOS, or Linux).
-
Download RStudio – Visit the RStudio download page and choose the free RStudio Desktop version.
-
Run the installer – After downloading, open the installer file and follow the setup instructions.
-
Launch RStudio – Once installed, you can open RStudio like any other application.
Something to notice: RStudio requires R to be installed first, as it acts as an interface for working with R.
What should I do after installing RStudio for the first time?
After installing RStudio, I recommend these steps:
- Open the application – Launch RStudio and check if the console loads correctly with R.
- Familiarize yourself with the interface – You'll see four main panels: Source, Console, Environment/History, and Files/Plots/Packages/Help.
- Try your first script – Create a new R Script file (File > New File > R Script) and type a simple line like
print("Hello, RStudio!"). - Install packages – Use
install.packages("ggplot2")or go to the Packages tab to browse and install packages. - Explore the Help tab – RStudio has built-in documentation you can access via the Help tab or by typing
?function_namein the console.
What is the difference between R and RStudio?
R is the programming language itself—the statistical engine that executes your code. RStudio is an IDE (integrated development environment) that provides a user-friendly interface for writing, running, and debugging R code. Think of R as the engine and RStudio as the dashboard.
You must install R first before RStudio can work, since RStudio is a graphical front-end that calls R in the background.
Is RStudio free to use?
Yes. RStudio Desktop is completely free and open-source under the AGPL license. There is also a paid commercial edition—RStudio Workbench—designed for enterprise teams that need centralized server management. For most learners and individual data scientists, the free Desktop version provides everything you need.
What happened to RStudio? Is it now called Posit?
In October 2022, RStudio, Inc. rebranded as Posit, PBC. The company name changed to reflect its broader mission of supporting open-source data science across multiple languages, not just R. However, the IDE still retains the name RStudio. You now download it from posit.co instead of the old rstudio.com address.







RStudio is a free IDE for R that puts your code editor, console, plots, and help in one window. It’s used to import, transform, explore, plot, and model data, and to build machine learning models. This tutorial covers how to install it, how the interface works, and how to run your first code.
TL;DR
RStudio is the most widely used IDE for R, now developed by Posit, PBC (formerly RStudio, Inc.)
Install R from CRAN first, then download RStudio from posit.co
The interface has four main panes: Source editor, Console, Environment/History, and Files/Plots/Packages/Help
Write reusable code in R scripts (File > New File > R Script) and run lines with Ctrl/Cmd + Enter
Use the Console for quick, one-off commands; use scripts for reproducible, shareable workflows
Install packages once with
install.packages(), then load them in each script withlibrary(). Popular starting points include tidyverse, ggplot2, and rmarkdown.What Is RStudio?
Let's start with R: R is a free, open-source programming language for statistical computing, data analysis, and data visualization. It has an active community and more than 24,000 packages on CRAN, its main package repository. If you want to find more information about R and how to learn it, take a look at our resources:
RStudio is an open-source IDE (integrated development environment) widely used as a graphical front-end for R. It also supports other languages, such as Python and SQL.
RStudio offers numerous helpful features: