Course
Introduction to R
4 hr
3M
To install and start working in RStudio, we need first to download and install the R programming language itself. To download and install R, follow the steps below:
To download and install RStudio, follow these steps:
Now that we have successfully installed RStudio, let's open it, explore its main parts, and try to perform various operations on it.
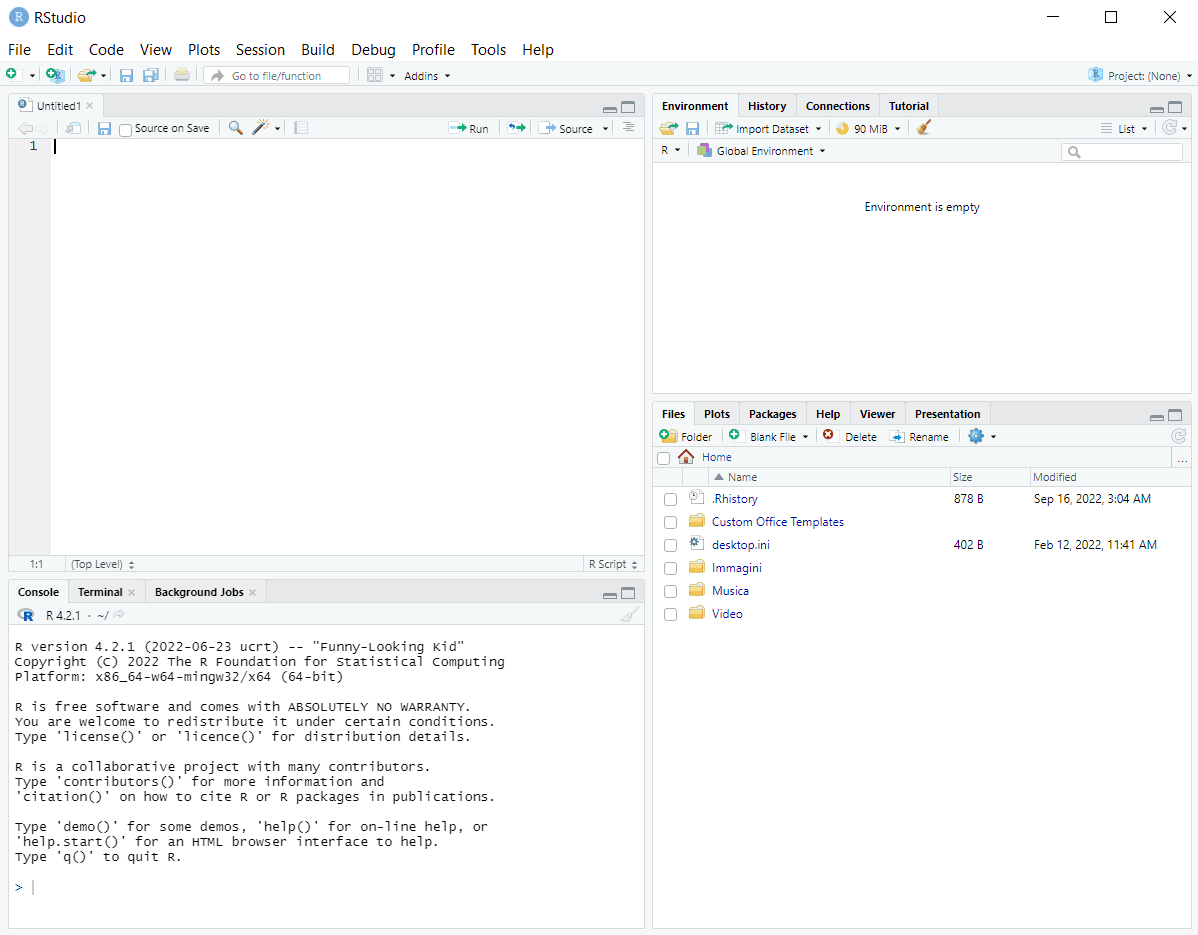
Opening RStudio will automatically launch R software. The platform interface looks as follows:
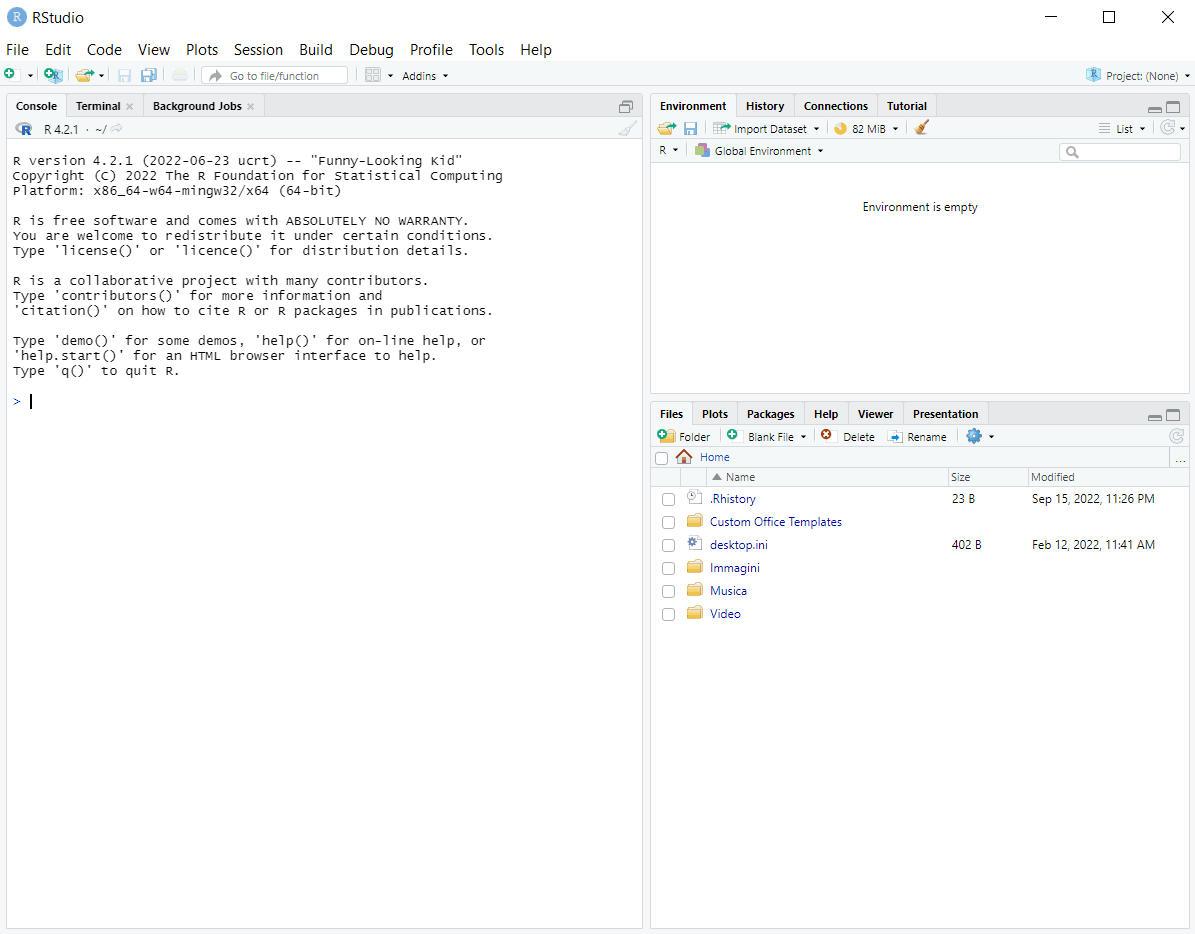
Roughly, we can divide the working window into three areas:
Note: The layout shown here is based on RStudio 2022.07.1+554. Tab names and arrangement may vary slightly in newer versions.
Let's take a closer look at the essential tabs.
On this tab, we first see the information about the R version in use and also some basic commands to try. At the end of those descriptions, we can type our R code, press Enter, and get the result below the code line (e.g., try running 2*2 and see what happens). Virtually, we can do here anything we would do in any other R program, for example:
However, when we run our code directly in the console, it isn't saved for being reproduced further. If we need (and we usually do) to write a reproducible code to solve a specific task, we have to record and regularly save it in a script file rather than in the console.
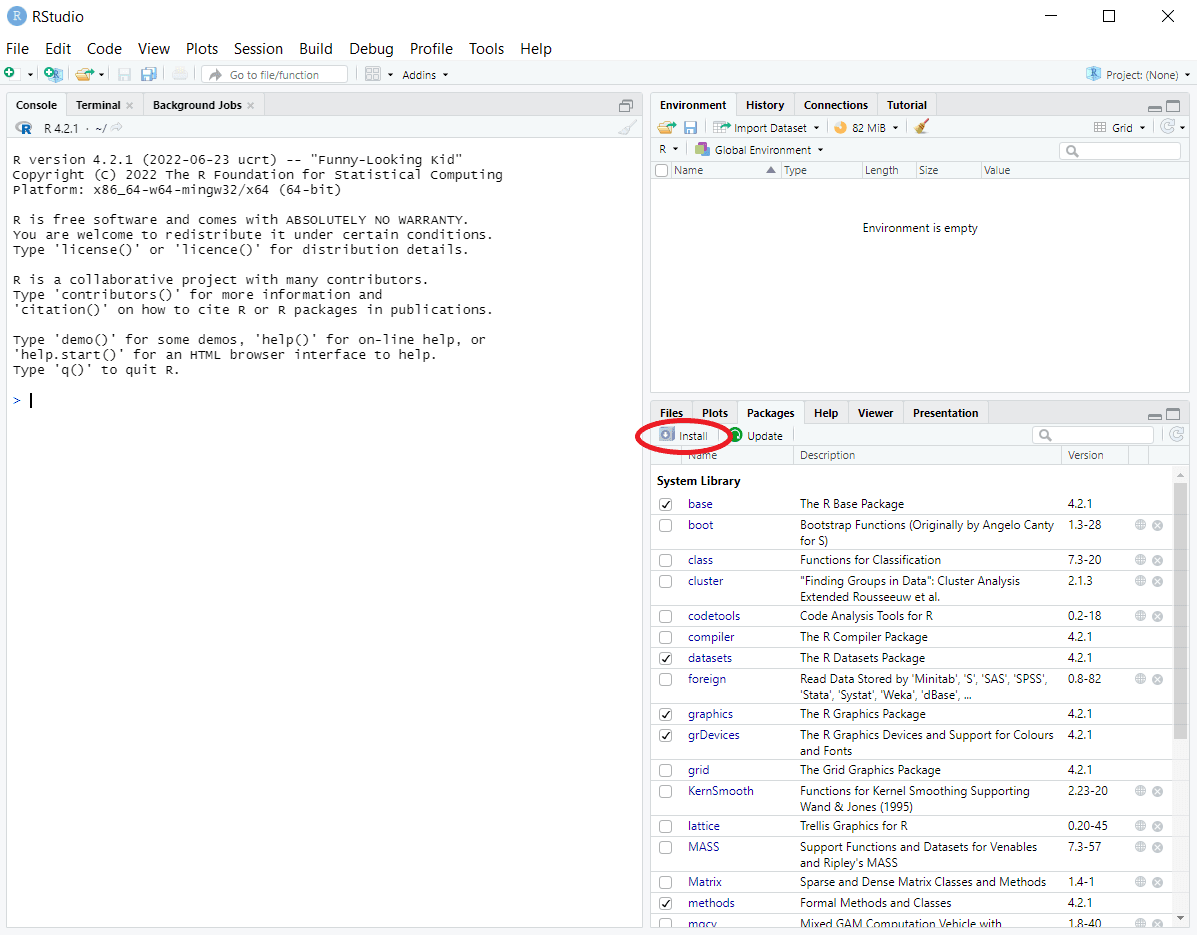
We'll soon explore how to write scripts. For now, let's keep in mind that you should mostly use the console to test the code and install R packages since they only need to be installed once.
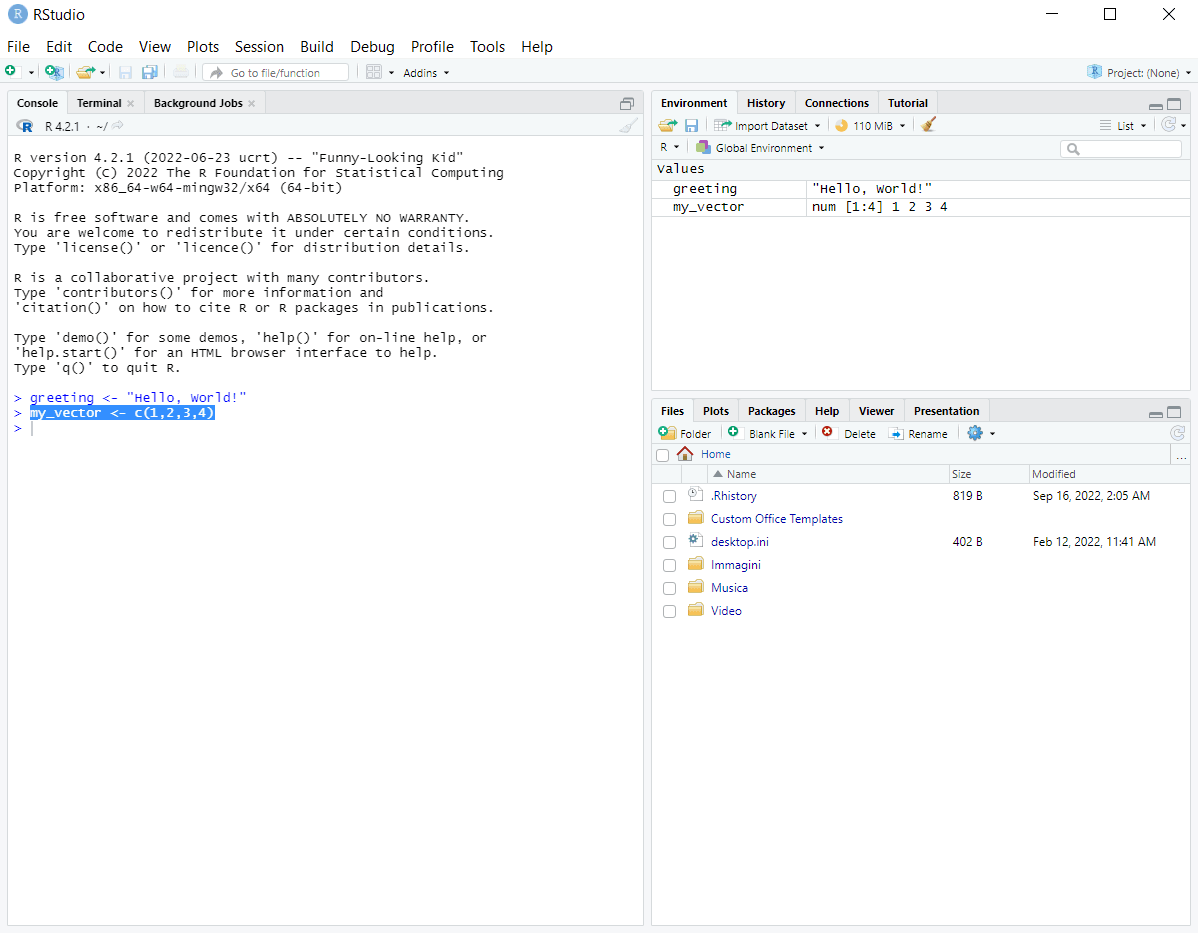
Whenever we define a new or re-assign an existing variable in RStudio, it's stored as an object in the workspace and gets displayed, together with its value, on the Environment tab in the top-right area of the RStudio window. Try running greeting <- "Hello, World!" in the console and see what happens on the Environment tab.
This also relates to more complex objects such as dataframes. When we import data as a dataframe (or create a dataframe from scratch), we see in the workspace not only the name of the new object but also the values and data type of each column. Moreover, we can display even more details about each object, such as its length and memory size.
In the example below, we created two variables in the console: greeting <- "Hello, World!" and my_vector <- c(1, 2, 3, 4). Note how they are displayed on the Environment tab:
We can change the way of displaying our variables from List to Grid in the top-right corner of the tab, as follows:
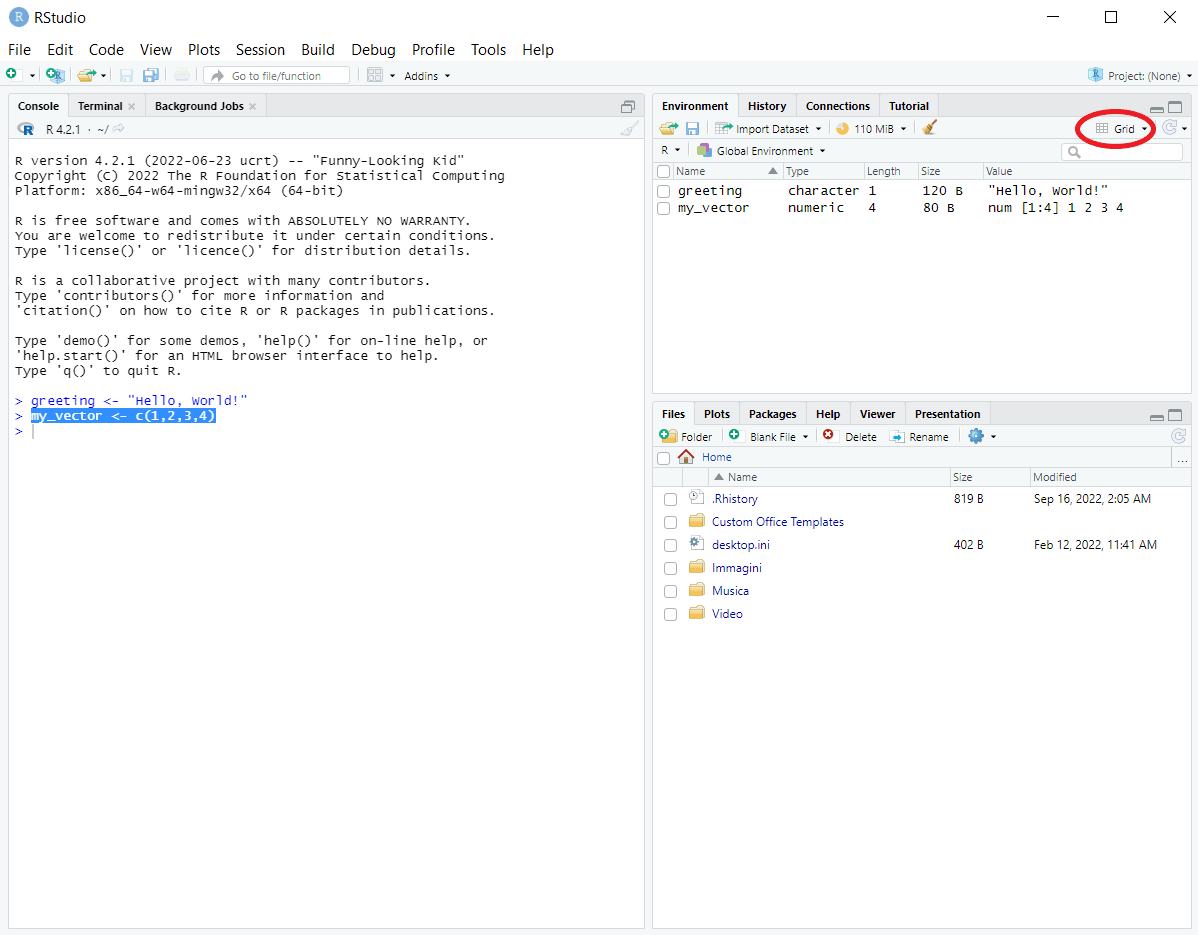
Note that now we can also see the length and size of each object.
In the Grid display mode, the box appears to the left of each variable. We can tick any of those boxes and click the Broom icon to remove the corresponding objects from the workspace:
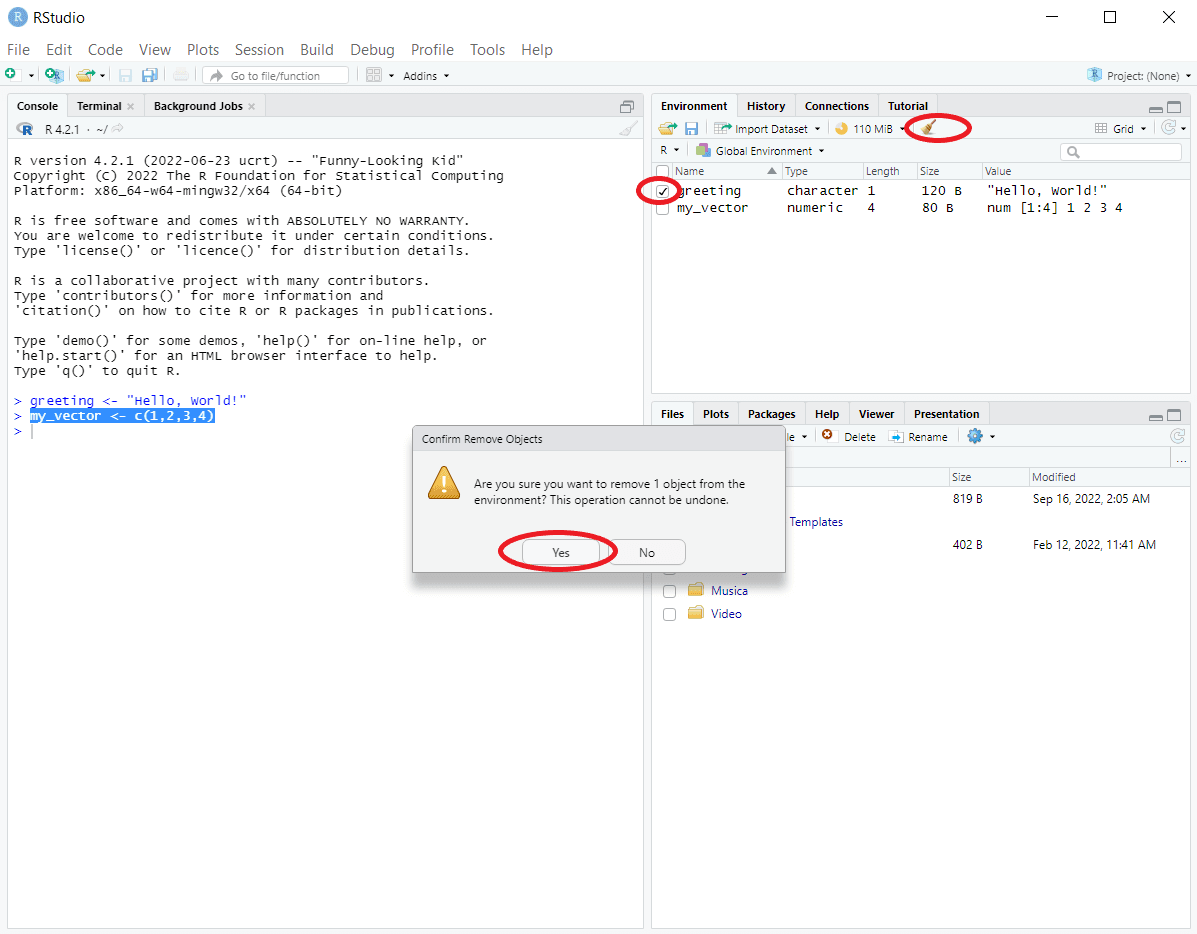
If we tick the box to the left of the Name column and click the Broom icon, or if we just click this icon in the previous display mode (List), we'll clean our workspace removing all the variables from it.
As we mentioned earlier, if we want to be able to reproduce and reuse our code for further needs, we should write it in a script file rather than directly in the console.
To start recording a script, click File – New File – R Script. This will open a text editor in the top-left corner of the RStudio interface (above the Console tab):
In a script, we can do all the things we listed in the section on the console (and we can actually do the same things in any other R IDE), only that now our actions will be stored in a file for further usage or sharing. It's important to give a meaningful name to the script file and regularly save it (Ctrl + S in Windows/Linux, Cmd + S in Mac, File – Save in any operating system).
To run a single line of code from a script, put the cursor on that line and click the Run icon on the top-right of the text editor. Otherwise, use a keyboard shortcut (Ctrl + Enter in Windows/Linux, Cmd + Enter in Mac). To run multiple code lines, do the same after selecting the necessary lines. To run all code lines, select all the lines and click the Run icon OR use a keyboard shortcut (Ctrl + A + Enter in Windows/Linux, Cmd + A + Enter in Mac).
When we write a script, it makes sense to add code comments where necessary (using a hashtag symbol # followed by a line of a comment text) to explain to a potential future reader the why behind certain pieces of code.
Also, it's a good idea to add some important context at the beginning of the script: the author and contributors of the code, when it was written, when it was updated, the scope of the code, etc. Another helpful practice is to load all the needed R packages at the beginning of the script, just after providing the initial information.
For reproducible, publication-ready reports that combine code and narrative, R Markdown is the go-to tool—it works directly inside RStudio. Learn the basics in the R Markdown tutorial for beginners. For a comparison with Jupyter Notebooks, see Jupyter and R Markdown: Notebooks with R.
Next, we'll discuss what actions we can perform in RStudio for data analysis purposes. Virtually, all the operations we're going to consider aren't strictly related to RStudio but rather to using R in general, in whatever IDE.
Hence, we aren't going to take a granular look at all the technical details of those operations. Instead, we'll see some common tasks, their practical implementation in R (code examples), and alternative approaches (where applicable) to those tasks in RStudio.
Copy-paste the below examples into the console of RStudio and explore the results. Consider trying both general and alternative (RStudio-specific) approaches.
Syntax:
install.packages("package_name")For example:
install.packages("tidyverse")In RStudio:
Syntax:
library(package_name)For example:
library(tidyverse)The tidyverse is a popular collection of R packages for data science—including dplyr for data manipulation and ggplot2 for visualization. Learn more in the Tidyverse tutorial.
Note that while we used quotation marks for installing packages, we don't use them for loading packages.
In RStudio:
Run in the console (.packages()) or search() to get a list of all the loaded packages.
In RStudio: open the Packages tab, search for a specific package, and check if the box to the left of its name is ticked.
To get help on an installed and loaded package, or a function of an installed and loaded package, or any other built-in R object (such as a preloaded dataset), use one of the following syntaxes:
help(package_or_function_name)or
help("package_or_function_name")or
?package_or_function_nameNote: we need to pass in a function name to the help function without parentheses.
The Help tab will be opened with the package or object documentation. If we're checking a package, then we'll get the list of all its functions and the link to the documentation for each of them.
For example, run the following in the console (after making sure that the readr and dplyr packages are installed and loaded):
help("read.csv")
?readr
help(help)
help('CO2')
In RStudio: find and click the desired package name (even if it isn't loaded) on the Packages tab and see the result on the Help tab.
world_population <- read.csv("world_population.csv")(To run the above piece of code, first, download the publicly available World Population Dataset from Kaggle and unzip it into the same folder where you store your R script.)
The result of running the above piece of code will be an R dataframe in your working folder.
In RStudio:
OR
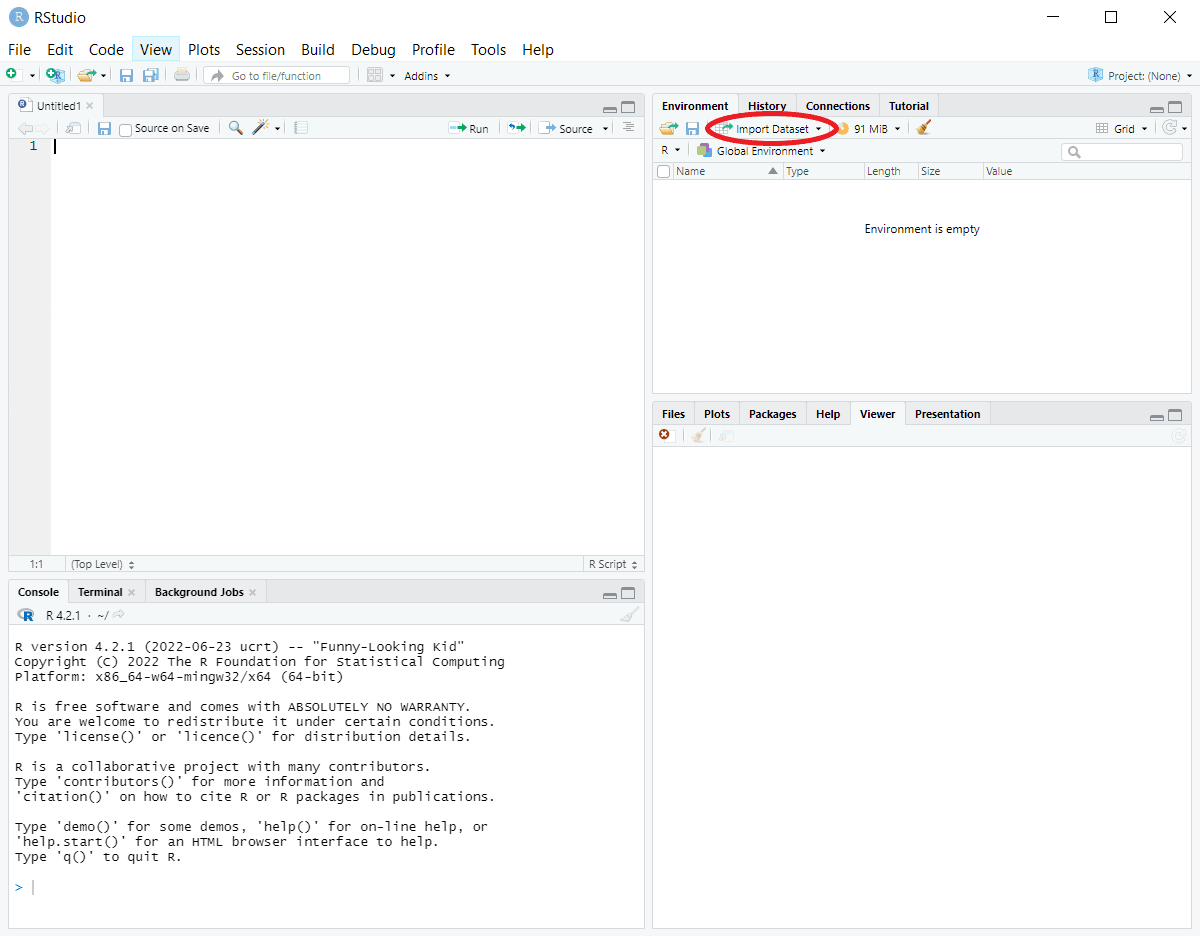
Then select From Text (base)..., navigate to the right folder, select the file to import, fill in or check the fields Name, Heading, Separator, and Decimal in the pop-up window, preview the dataset structure, and click Import:
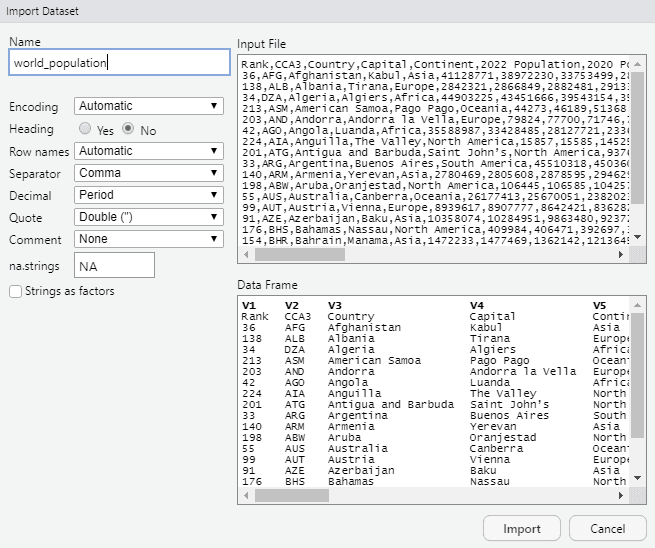
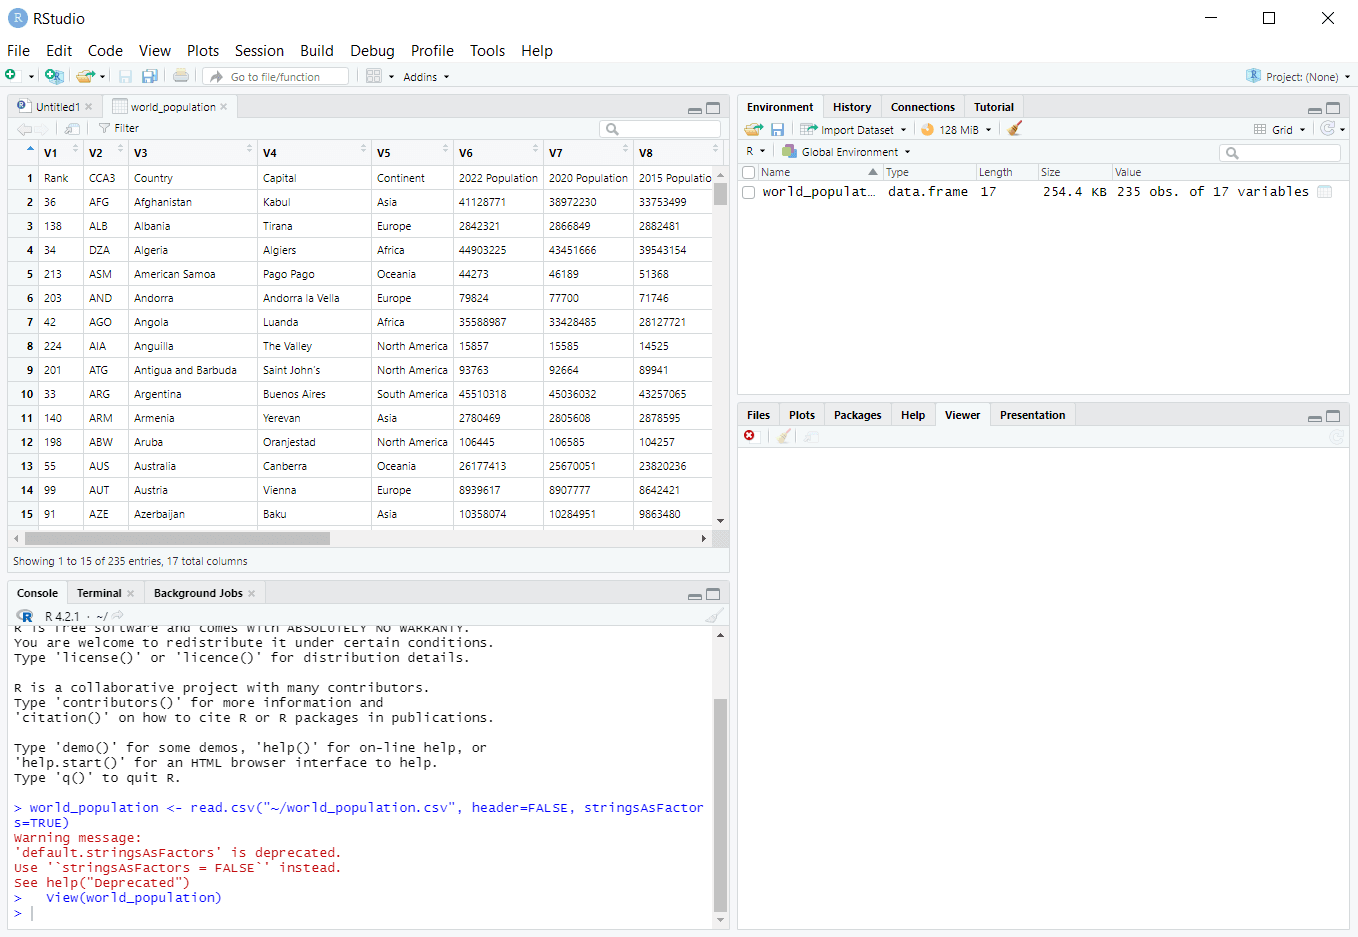
You can now find and explore the imported dataset on the Environment tab and in a spreadsheet opened in a new tab:
If you want to learn more about how to import data with R, explore a well-rounded DataCamp skill track Importing & Cleaning Data with R. You can find various datasets to import and work with on DataLab, DataCamp's AI-enabled data notebook and an alternative to RStudio.
To see the full list of available sample datasets preloaded in R, including their names and short descriptions, run the following piece of code in the console:
data()You can take any of the appeared names and use each of them as a variable (containing a dataframe) to work with and practice your skills in R.
If you need more information about a selected preloaded dataset, run the help() function on it, e.g, help(CO2).
Like in any other R IDE, in RStudio, we can access, manipulate, transform, analyze, and model the data in R. Below are some examples of standard operations performed on the CO2 built-in dataset:
head(CO2)
tail(CO2)
colnames(CO2)
dim(CO2)
str(CO2)
summary(CO2)
summary(CO2$uptake)
median(CO2$uptake)
class(CO2$uptake)
unique(CO2$Treatment)
subset(CO2, conc == min(CO2$conc))
Try running them one by one in RStudio and observe the output.
Like in any other R IDE, in RStudio, we can plot the data. Below are some examples of creating simple plots for the CO2 and Orange built-in datasets. In both cases, the resulting plot appears on the Plots tab and can be exported using the Export button of that tab:
hist(CO2$uptake)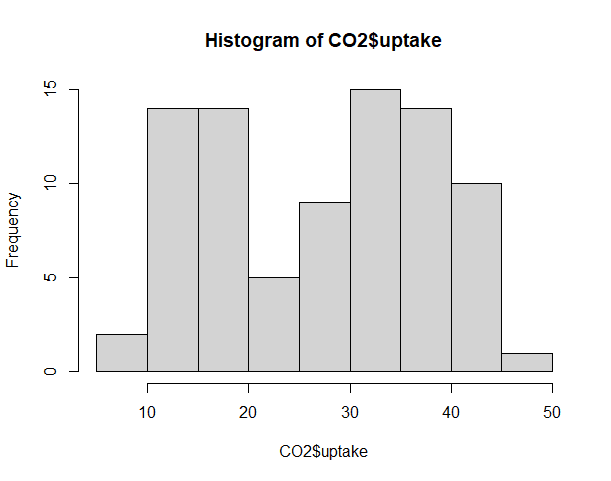 Creating a scatter plot:
plot(Orange$age, Orange$circumference)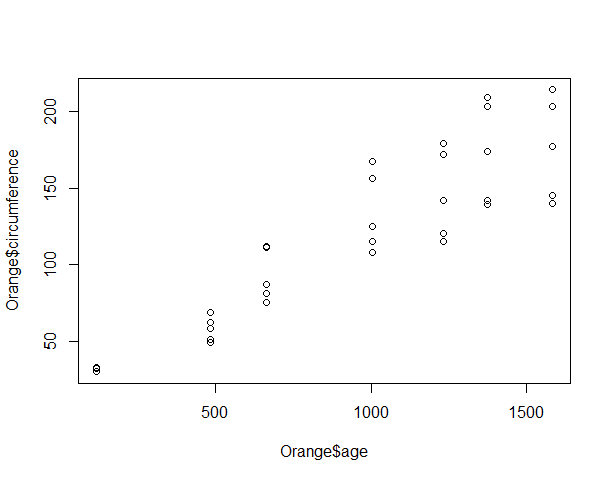
We can tune a few parameters available for the basic plot() function to add some aesthetics to the last plot:
plot(Orange$age, Orange$circumference,

     xlab="Age", ylab="Circumference",

     main="Circumference vs. Age",

     col="blue", pch=16)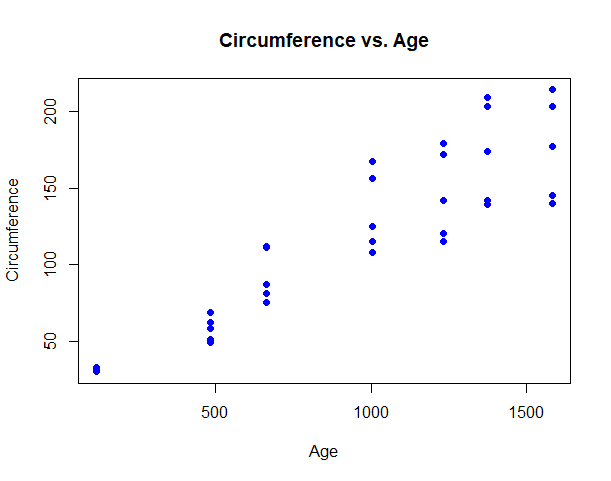
Or we can use ggplot2 or any other specialized data visualization package—R offers a vast choice. For a deep dive, see our ggplot2 tutorial or the DataCamp skill track Data Visualization with R.
Again, in this case, RStudio isn't different from any other R IDE.
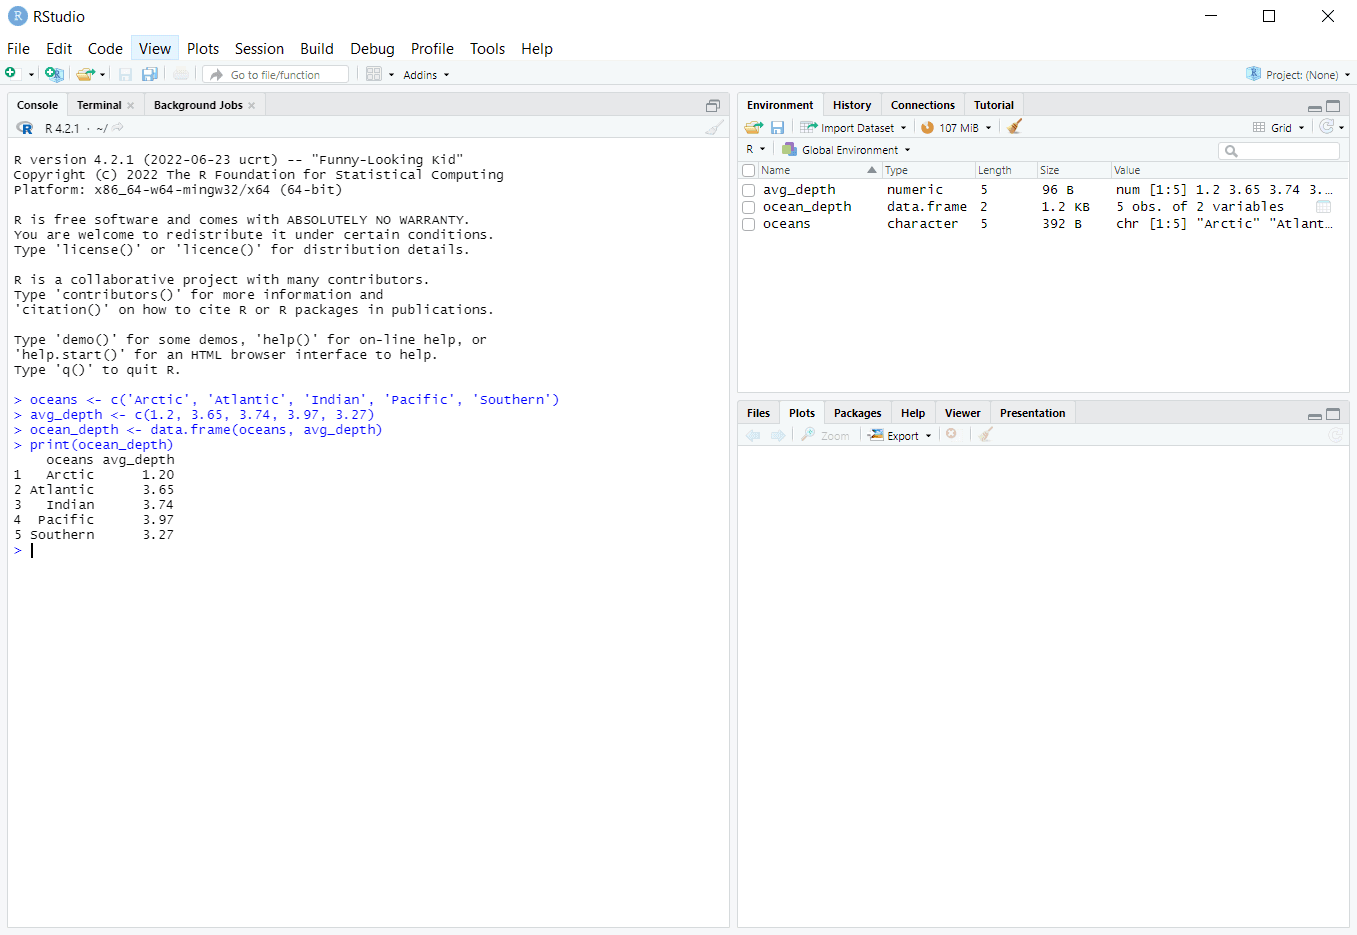
To create a vector:
oceans <- c("Arctic", "Atlantic", "Indian", "Pacific", "Southern")
avg_depth <- c(1.2, 3.65, 3.74, 3.97, 3.27)
(The above data was taken from Wikipedia.)
To create a dataframe:
oceans_depth <- data.frame(oceans, avg_depth)Printing out the result:
print(oceans_depth)The resulting vectors and dataframe also appears on the Environment tab of RStudio:
In this tutorial, we explored plenty of essential aspects of using RStudio:
Now that you're familiar with RStudio, you can go ahead and start using it. For example, think about building your own R projects in RStudio. For more inspiration, check the article on Top R Project Ideas.
If you feel that you need more training in R before starting to create projects in RStudio, consider the following beginner-friendly R courses and tracks on DataCamp:
R Courses
Course
Course
Course
blog
Josef Waples
12 min
Tutorial
Francisco Javier Carrera Arias
Tutorial
Elena Kosourova
Tutorial
Abid Ali Awan
Tutorial
DataCamp Team
code-along
Ishmael Rico