

Python Tabulate 的高级功能
tabulate 库提供了高级功能,允许您自定义复杂表格的外观。下面我们来讨论其中的一些功能。
自定义表格外观
tabulate 库提供多种方式来自定义表格外观,例如调整对齐方式、设置列宽,以及使用不同的表格格式。以下是一些关键的格式化选项。
-
numalign:控制数值列的对齐方式。可接受的值为"left"、"center"和"right"。 -
stralign:控制字符串列的对齐方式。可接受的值为"left"、"center"和"right"。 -
colalign:通过提供对齐选项列表,为各个列设置特定的对齐方式。
下面的示例展示了这些格式化选项的应用。
from tabulate import tabulate
# Sample data: list of lists
data = [
["Alice", 24, 1200.50],
["Bob", 30, 3500.75],
["Charlie", 28, 2500.00]
]
# Customizing table appearance
table = tabulate(
data,
headers=["Name", "Age", "Salary"],
tablefmt="fancy_grid",
numalign="right",
stralign="center",
colalign=("center", "center", "right")
)
print(table)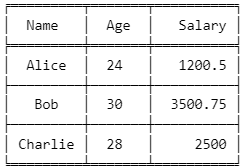
使用 Python tabulate 的自定义表格输出。作者供图。
处理多行单元格
tabulate 库还允许您处理超过典型列宽的文本数据。maxcolwidths 参数可指定输出表格中每个单元格的最大宽度,以管理单元格内的文本换行。此功能可让您以更易读的方式展示较长的信息。
在下面的示例中,maxcolwidths 设置为 30 个字符,如果超过指定字符数,将把文本数据换行为多行。
# Import tabulate library
from tabulate import tabulate
# Sample text data
data = [
["Alice", "Lorem ipsum dolor sit amet, consectetur adipiscing elit."],
["Bob", "Sed do eiusmod tempor incididunt ut labore et dolore magna aliqua."],
["Charlie", "Ut enim ad minim veniam, quis nostrud exercitation ullamco."]
]
# Creating a table with multiline cells
table = tabulate(
data,
headers=["Name", "Description"],
tablefmt="grid",
maxcolwidths=[None, 30] # Set maximum width for the Description column
)
print(table)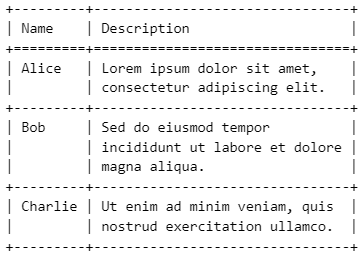
使用 Python tabulate 处理多行的表格输出。作者供图。
使用命令行工具
tabulate 库提供了一个命令行工具,帮助您直接从命令行或终端显示表格。借助该命令行工具,您无需编写额外的 Python 代码即可生成表格。
假设您有一个名为 data.csv 的 CSV 文件。您可以使用以下命令通过 tabulate 生成表格。
cat data.csv | tabulate -d , -f grid其中:
-
cat data.csv读取该 CSV 文件的内容。 -
-d ,指定分隔符(CSV 为逗号)。 -
-f grid将输出格式设置为grid样式。
实践示例与应用场景
本节我们将探讨使用 tabulate 库在 Python 中显示表格的不同场景。
展示销售数据
假设我们有如下销售数据。
# Sample sales data
sales_data = [
["Q1", 15000, 12000, 13000],
["Q2", 17000, 16000, 14500],
["Q3", 18000, 15000, 16000],
["Q4", 20000, 21000, 19000]
]
headers = ["Quarter", "Product A", "Product B", "Product C"]您可以使用 fancy_grid 格式将数据展示为表格。
# Import tabulate library
from tabulate import tabulate
# Displaying sales data using the 'fancy_grid' format
table_fancy = tabulate(sales_data, headers=headers, tablefmt="fancy_grid")
print(table_fancy)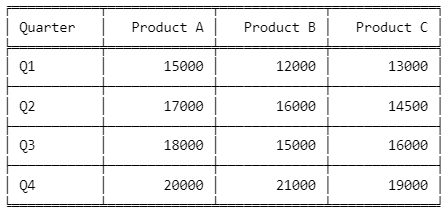
在 Python tabulate 中使用 fancy_grid 格式的表格输出。作者供图。
您还可以通过将 tablefmt 设置为 html 来以 HTML 格式显示数据。
# Displaying sales data using the 'html' format
table_html = tabulate(sales_data, headers=headers, tablefmt="HTML")
print(table_html)输出:
<table>
<thead>
<tr><th>Quarter </th><th style="text-align: right;"> Product A</th><th style="text-align: right;"> Product B</th><th style="text-align: right;"> Product C</th></tr>
</thead>
<tbody>
<tr><td>Q1 </td><td style="text-align: right;"> 15000</td><td style="text-align: right;"> 12000</td><td style="text-align: right;"> 13000</td></tr>
<tr><td>Q2 </td><td style="text-align: right;"> 17000</td><td style="text-align: right;"> 16000</td><td style="text-align: right;"> 14500</td></tr>
<tr><td>Q3 </td><td style="text-align: right;"> 18000</td><td style="text-align: right;"> 15000</td><td style="text-align: right;"> 16000</td></tr>
<tr><td>Q4 </td><td style="text-align: right;"> 20000</td><td style="text-align: right;"> 21000</td><td style="text-align: right;"> 19000</td></tr>
</tbody>
</table>如果您希望将表格输出嵌入网站,HTML 表格输出在 Web 集成中很有用。您还可以使用 CSS 进一步自定义 HTML 表格输出,以提升用户观感。
与 Jupyter Notebooks 集成
tabulate 库可以轻松与 Jupyter Notebooks 集成,便于数据呈现。下面的示例展示了如何在 Jupyter Notebook 中创建一个示例 DataFrame,并以网格格式的表格显示。
# Import required library
import pandas as pd
from tabulate import tabulate
# Sample student exam scores DataFrame
exam_scores_df = pd.DataFrame({
"Student": ["Alice", "Bob", "Charlie", "David"],
"Math": [85, 90, 78, 92],
"Science": [88, 76, 95, 85],
"English": [90, 88, 84, 91]
})
# Displaying the DataFrame as a formatted table using 'grid' format
table_jupyter = tabulate(exam_scores_df, headers='keys', tablefmt='grid')
print(table_jupyter)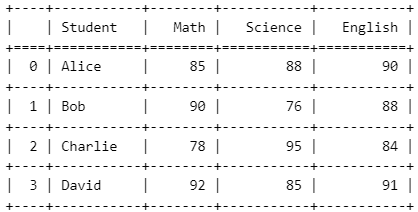
在 Jupyter Notebook 中结合 Python tabulate 的表格输出。作者供图。
在 Jupyter 环境中使用 tabulate 的优势在于提升可读性和数据对比,尤其适用于数据分析任务。
总结
tabulate 库对于在 Python 中创建格式优良的表格非常重要。正如您所见,它还提供了在不同环境中使用的灵活性,例如 Jupyter Notebooks、命令行和 Web 应用,并支持包括 HTML 在内的多种输出选项。
如果您想进一步提升 Python 技能,我强烈推荐查看 DataCamp 的 Python Programming 技能路线。同时也鼓励您关注我们的 Python Developer 和 Data Analyst with Python 职业路线,帮助您构建与岗位相关的技能,成为一名熟练的数据分析师。此外,如果您喜欢在 Python 中处理表格,不妨试试 DataCamp 的 Introduction to Databases in Python 课程,了解更多将 SQL 与 Python 结合使用的内容。最后,如果您已经准备好迈出那令人兴奋的一步,点击下方,成为一名使用 Python 的机器学习科学家。

数据科学技术写作者,具备数据分析、商业智能和数据科学的一线实践经验。我撰写以行业为导向的实用内容,涵盖 SQL、Python、Power BI、Databricks 和数据工程,并以真实的分析工作为基础。我的写作兼顾技术深度与业务影响,帮助专业人士将数据转化为自信的决策。
常见问题解答
什么是 Python 中的 tabulate 库?
tabulate 库可以从 Python 中的不同数据结构创建格式良好的表格。
How do I install the tabulate library?
To install the tabulate library, use the pip install tabulate command.
Python 的 tabulate 库支持哪些输出格式?
tabulate 库支持以纯文本、HTML、grid、LaTeX、Markdown 等格式输出表格。
tabulate 库支持哪些数据结构?
tabulate 库可用于从以下数据结构创建表格输出:列表的列表、字典列表、可迭代对象的字典、二维 NumPy 数组,以及 Pandas DataFrame。
tabulate 库可以直接在命令行中使用吗?
Tabulate 提供了一个命令行工具,可直接在终端生成表格,而无需编写完整的 Python 代码。
表格数据指的是按行和列组织的结构化数据。以这种方式组织数据很重要,因为它便于解读输出结果。在 Python 中,我们可以使用
tabulate库来创建外观整洁的表格数据。tabulate库易于使用,已成为需要为展示创建干净格式表格的数据科学家、分析师和开发者的常用工具之一。如果您刚开始做数据分析或数据科学,我建议先学习 DataCamp 的Introduction to Python课程,掌握 Python 语言的基础知识,包括函数和包。
什么是 Python Tabulate?
Python 中的
tabulate包可以从多种数据源创建格式良好的表格。tabulate包的主要使用场景包括:在命令行界面(CLI)中展示数据:
tabulate包帮助开发者在终端或控制台中以易读的方式显示格式化表格。Jupyter Notebooks:
tabulate()函数有助于在 Jupyter Notebooks 中展示美观的表格。Web 应用:
tabulate包帮助开发者在 Web 应用中以 HTML 格式展示表格。tabulate库的一些关键特性包括:多种输出格式:
tabulate包允许以不同格式输出表格,包括纯文本、HTML、LaTeX 等;因此用户可以根据场景选择。自动列对齐:
tabulate会自动对齐不同数据类型(如字符串、数字等)的列。处理多种数据结构:
tabulate可处理字典、列表、pandas DataFrame 和 NumPy 数组。如何在 Python 中安装 Tabulate
您可以使用
pip包管理器安装 Python 的tabulate包。在终端或命令提示符中输入并运行以下命令:如果您希望在无需管理员权限的情况下为单个用户安装该包,可以使用如下所示的
–user标志。在虚拟环境中运行脚本时,您可以使用以下命令创建一个新的虚拟环境。
要激活虚拟环境,请运行以下命令:
Windows:
macOS/Linux:
如果安装成功,您可以在 Python 编辑器中运行以下代码,检查当前环境中
tabulate包的版本号。如果您发现工具需要更新,请阅读我们的指南:How to Upgrade Python and Pip in Windows, MacOS, and Linux。
Python Tabulate 的基础用法
下面的示例展示了使用
tabulate包创建格式化表格的基本方法。创建简单表格
使用
tabulate()函数创建表格的最简单方式是提供一个列表的列表。tabulate()函数语法中的关键参数包括:tabular_data:要格式化的数据,例如列表的列表或字典。headers:表格的表头。如果省略,表格将没有表头。tablefmt: 表格的输出格式,如“plain”、“pipe”、“grid”或“html”。下面的示例展示了如何使用
tabulate()函数创建网格格式的表格。使用 Python tabulate 的网格格式表格。作者供图。
查阅我们的 Python Fundamentals 技能路线,进一步了解 Python 中的列表和其他数据结构。
显示 pandas DataFrame 的数据
pandas DataFrame 是 Python 中常用的表格数据结构。使用
tabulate库,您可以根据需求将表格数据格式化为不同的样式。下面的示例展示了如何使用‘pipe’格式显示表格。在 Python tabulate() 函数中使用 pipe 样式的表格输出。作者供图。
使用相同的 DataFrame(
df),您也可以以网格格式显示表格输出。在 Python tabulate() 函数中使用网格样式的表格输出。作者供图。