Course
Python Toolbox
4 hr
318.1K
Tabular data refers to structured data in rows and columns. Structuring data in this way is important because it makes it easy to interpret the output. In Python, we can create nice-looking tabular data by using the tabulate library. The tabulate library is easy to use and has become one of the preferred tools for data scientists, analysts, and developers who need to create cleanly formatted tables for presentation.
If you are starting as a data analyst or data scientist, I recommend taking DataCamp’s Introduction to Python course to learn the basics of the Python language, including functions and packages.
The tabulate package in Python creates well-formatted tables from various data sources. The primary use cases of the tabulate package include the following:
Displaying Data in Command-Line Interfaces (CLIs): The tabulate package helps developers display formatted tables in a readable way in the terminal or console.
Jupyter Notebooks: The tabulate() function helps display nice tables in Jupyter Notebooks.
Web Applications: The tabulate package helps developers display tables in HTML format in web applications.
Some of the key features of the tabulate library include the following:
Multiple Output Formats: The tabulate package allows table output in different formats, including plain text, HTML, LaTeX, and others; hence, users can choose according to the use case.
Automatic Column Alignment: tabulate automatically aligns the columns of different data types, including strings, numbers, and others.
Handling Various Data Structures: tabulate handles dictionaries, lists, pandas DataFrames, and NumPy arrays.
You can use the pip package manager to install the tabulate package in Python. On your terminal or command prompt, type and run the following prompt:
pip install tabulateIf you want to install the package for a single user without requiring administrative privileges, you can use the –user flag as shown below.
pip install --user tabulateYou can create a new virtual environment using the following command when running scripts in a virtual environment.
python -m venv myenvTo activate the virtual environment, run the following commands:
myenv\Scripts\activatesource myenv/bin/activateIf the installation is successful, you can run the following code in your Python editor to check the version number of the tabulate package in the Python environment.
import tabulate
print(tabulate.__version__)
If you discover that your tools need updating, read our guide: How to Upgrade Python and Pip in Windows, MacOS, and Linux.
The examples below show the basic use of the tabulate package to create formatted tables.
The simplest way to use the tabulate() function to create tables is by providing a list of lists. The key arguments in the tabulate() function syntax include the following:
tabular_data: The data to format such as list of lists or dictionaries.
headers: The headers to be provided in the table. If omitted, the table will have no headers.
tablefmt: The table output format such as “plain”, “pipe”, “grid”, or “html”.
The example below shows how to use the tabulate() function to create a grid-formatted table.
# Import the tabulate module
from tabulate import tabulate

# Sample data: list of lists
data = [
    ["Alice", 24, "Engineer"],
    ["Bob", 30, "Data Scientist"],
    ["Charlie", 28, "Teacher"]
]

# Creating a table with headers and a grid format
table = tabulate(
    data,
    headers=["Name", "Age", "Profession"],
    tablefmt="grid"
)

print(table)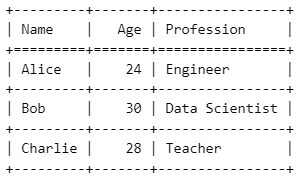
Grid-formatted table using Python tabulate. Image by Author.
Check out our Python Fundamentals skill track to learn more about lists and other data structures in Python.
The pandas DataFrame is a common data structure in Python that handles tabular data. Using the tabulate library, you can format the tabular data in different formats according to the required specifications. The following example shows how to display a table using the ‘pipe’ format.
# Import libraries
import pandas as pd
from tabulate import tabulate

# Sample DataFrame
df = pd.DataFrame({
    "Name": ["Alice", "Bob", "Charlie"],
    "Age": [24, 30, 28],
    "Profession": ["Engineer", "Data Scientist", "Teacher"]
})

# Displaying the DataFrame as a formatted table
table = tabulate(
    df,
    headers='keys',
    tablefmt='pipe'
)

print(table)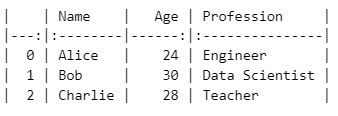
Table output using pipe formatting style in Python tabulate() function. Image by Author.
Using the same DataFrame, df, you can display the table output in grid format.
print(tabulate(df, headers='keys', tablefmt='grid'))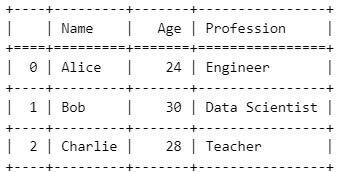
Table output using grid formatting style in Python tabulate() function. Image by Author.
The tabulate library offers advanced features that allow you to customize the appearance of complex tables. Let us discuss some of these features.
The tabulate library offers different ways to customize table appearance, such as adjusting alignment, setting column widths, and using different table formats. The following are some of the key formatting options.
numalign: Controls the alignment of numeric columns. Acceptable values are "left", "center", and "right".
stralign: Controls the alignment of string columns. Acceptable values are "left", "center", and "right".
colalign: Allows for specific alignment of individual columns by providing a list of alignment options.
The example below shows the application of these formatting options.
from tabulate import tabulate

# Sample data: list of lists
data = [
    ["Alice", 24, 1200.50],
    ["Bob", 30, 3500.75],
    ["Charlie", 28, 2500.00]
]

# Customizing table appearance
table = tabulate(
    data,
    headers=["Name", "Age", "Salary"],
    tablefmt="fancy_grid",
    numalign="right",
    stralign="center",
    colalign=("center", "center", "right")
)

print(table)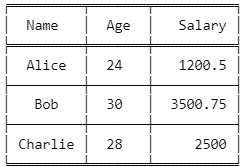
Customized table output using Python tabulate. Image by Author.
The tabulate library also lets you handle text data exceeding the typical column width. The maxcolwidths argument specifies the maximum width of each cell in the output table to manage text wrapping within cells. This functionality allows you to display lengthy information in a more readable way.
In the example below, the maxcolwidths is set to 30 characters to wrap the text data into multiple lines if it exceeds the specified number of characters.
# Import tabulate library
from tabulate import tabulate

# Sample text data
data = [
    ["Alice", "Lorem ipsum dolor sit amet, consectetur adipiscing elit."],
    ["Bob", "Sed do eiusmod tempor incididunt ut labore et dolore magna aliqua."],
    ["Charlie", "Ut enim ad minim veniam, quis nostrud exercitation ullamco."]
]

# Creating a table with multiline cells
table = tabulate(
    data,
    headers=["Name", "Description"],
    tablefmt="grid",
    maxcolwidths=[None, 30]  # Set maximum width for the Description column
)

print(table)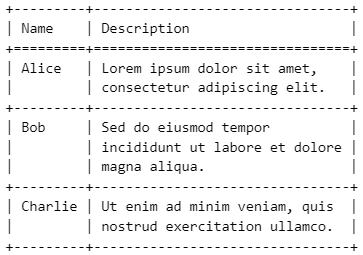
Table output handling multiple lines using Python tabulate. Image by Author.
The tabulate library provides a command-line utility to help you display tables directly from the command line or terminal. This command-line utility allows you to generate the tables without writing additional Python code.
Assume you have a CSV file named data.csv. You will use the following command prompt to generate a table using tabulate.
cat data.csv | tabulate -d , -f gridWhere:
cat data.csv reads the content of the CSV file.
-d , specifies the delimiter (comma for CSV).
-f grid sets the output format to grid style.
In this section, we will explore the different use cases of the tabulate library to display tables in Python.
Assume we have the following sales data.
# Sample sales data
sales_data = [
    ["Q1", 15000, 12000, 13000],
    ["Q2", 17000, 16000, 14500],
    ["Q3", 18000, 15000, 16000],
    ["Q4", 20000, 21000, 19000]
]

headers = ["Quarter", "Product A", "Product B", "Product C"]
You can display the data in a table using the fancy_grid format.
# Import tabulate library
from tabulate import tabulate

# Displaying sales data using the 'fancy_grid' format
table_fancy = tabulate(sales_data, headers=headers, tablefmt="fancy_grid")

print(table_fancy)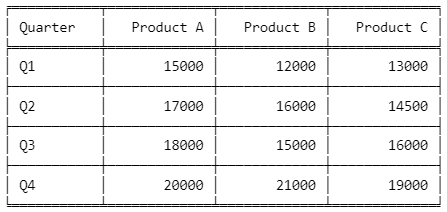
Table output using fancy_grid formatting in Python tabulate. Image by Author.
You can also display the data in HTML format by setting tablefmt to html.
# Displaying sales data using the 'html' format
table_html = tabulate(sales_data, headers=headers, tablefmt="HTML")

print(table_html)
Output:
<table>
<thead>
<tr><th>Quarter  </th><th style="text-align: right;">  Product A</th><th style="text-align: right;">  Product B</th><th style="text-align: right;">  Product C</th></tr>
</thead>
<tbody>
<tr><td>Q1       </td><td style="text-align: right;">      15000</td><td style="text-align: right;">      12000</td><td style="text-align: right;">      13000</td></tr>
<tr><td>Q2       </td><td style="text-align: right;">      17000</td><td style="text-align: right;">      16000</td><td style="text-align: right;">      14500</td></tr>
<tr><td>Q3       </td><td style="text-align: right;">      18000</td><td style="text-align: right;">      15000</td><td style="text-align: right;">      16000</td></tr>
<tr><td>Q4       </td><td style="text-align: right;">      20000</td><td style="text-align: right;">      21000</td><td style="text-align: right;">      19000</td></tr>
</tbody>
</table>
The HTML table output is useful in web integrations if you want to embed the table output into websites. You can also further customize the HTML table output using CSS to have a more appealing look to the user.
The tabulate library can easily be integrated with Jupyter Notebooks for easier data presentation. The example below shows how to create a sample DataFrame in a Jupyter Notebook and display it in a grid-formatted table.
# Import required library
import pandas as pd
from tabulate import tabulate

# Sample student exam scores DataFrame
exam_scores_df = pd.DataFrame({
    "Student": ["Alice", "Bob", "Charlie", "David"],
    "Math": [85, 90, 78, 92],
    "Science": [88, 76, 95, 85],
    "English": [90, 88, 84, 91]
})

# Displaying the DataFrame as a formatted table using 'grid' format
table_jupyter = tabulate(exam_scores_df, headers='keys', tablefmt='grid')

print(table_jupyter)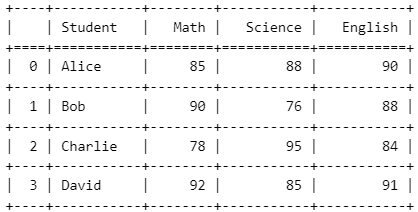
Table output using Python tabulate integrated with a Jupyter Notebook. Image by Author.
The advantage of using the tabulate library in a Jupyter environment is that it enhances readability and data comparison, especially for data analysis tasks.
The tabulate library is important for creating nicely formatted tables in Python. As you have seen, it also offers flexibility for use in different environments, such as Jupyter Notebooks, command lines, and web applications, including options for the output, such as HTML.
If you want to advance your Python skills, I highly recommend checking DataCamp’s Python Programming skill track. I also encourage you to check our Python Developer and Data Analyst with Python career tracks to help you build job-relevant skills to become a proficient data analyst. Also, if you like working with tables in Python, try DataCamp’s Introduction to Databases in Python to learn more about using SQL with Python. Finally, click below to become a machine learning scientist in Python, if you feel ready for that exciting step.
Learn with DataCamp
Course
Course
Course
blog
Abid Ali Awan
12 min
cheat-sheet
Karlijn Willems
Tutorial
Abid Ali Awan
Tutorial
Karlijn Willems
Tutorial
Kevin Babitz
Tutorial
Matthew Przybyla